2. STRUCTURAL SETTING OF THE LEG 156 AREA, NORTHERN ...
2. STRUCTURAL SETTING OF THE LEG 156 AREA, NORTHERN ...
2. STRUCTURAL SETTING OF THE LEG 156 AREA, NORTHERN ...

Create successful ePaper yourself
Turn your PDF publications into a flip-book with our unique Google optimized e-Paper software.
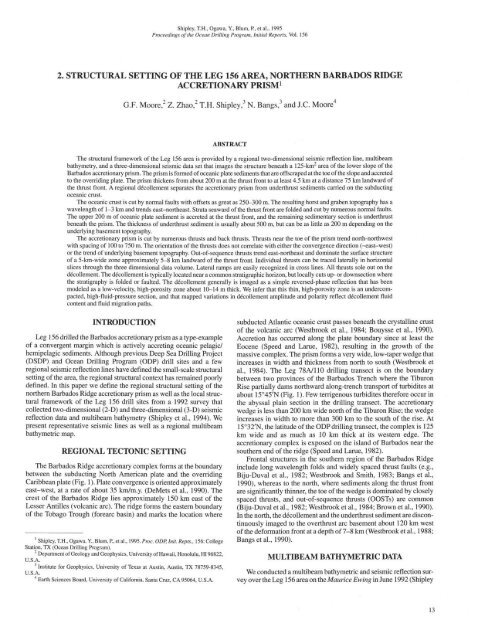
Shipley, T.H., Ogawa, Y., Blum, P., et al., 1995<br />
Proceedings of the Ocean Drilling Program, Initial Reports, Vol. <strong>156</strong><br />
<strong>2.</strong> <strong>STRUCTURAL</strong> <strong>SETTING</strong> <strong>OF</strong> <strong>THE</strong> <strong>LEG</strong> <strong>156</strong> <strong>AREA</strong>, NOR<strong>THE</strong>RN BARBADOS RIDGE<br />
ACCRETIONARY PRISM 1<br />
G.F. Moore, 2 Z. Zhao, 2 T.H. Shipley, 3 N. Bangs, 3 and J.C. Moore 4<br />
ABSTRACT<br />
The structural framework of the Leg <strong>156</strong> area is provided by a regional two-dimensional seismic reflection line, multibeam<br />
bathymetry, and a three-dimensional seismic data set that images the structure beneath a 125-km 2 area of the lower slope of the<br />
Barbados accretionary prism. The prism is formed of oceanic plate sediments that are off scraped at the toe of the slope and accreted<br />
to the overriding plate. The prism thickens from about 200 m at the thrust front to at least 4.5 km at a distance 75 km landward of<br />
the thrust front. A regional décollement separates the accretionary prism from underthrust sediments carried on the subducting<br />
oceanic crust.<br />
The oceanic crust is cut by normal faults with offsets as great as 250-300 m. The resulting horst and graben topography has a<br />
wavelength of 1-3 km and trends east-northeast. Strata seaward of the thrust front are folded and cut by numerous normal faults.<br />
The upper 200 m of oceanic plate sediment is accreted at the thrust front, and the remaining sedimentary section is underthrust<br />
beneath the prism. The thickness of underthrust sediment is usually about 500 m, but can be as little as 200 m depending on the<br />
underlying basement topography.<br />
The accretionary prism is cut by numerous thrusts and back thrusts. Thrusts near the toe of the prism trend north-northwest<br />
with spacing of 100 to 750 m. The orientation of the thrusts does not correlate with either the convergence direction (~east-west)<br />
or the trend of underlying basement topography. Out-of-sequence thrusts trend east-northeast and dominate the surface structure<br />
of a 5-km-wide zone approximately 5-8 km landward of the thrust front. Individual thrusts can be traced laterally in horizontal<br />
slices through the three dimensional data volume. Lateral ramps are easily recognized in cross lines. All thrusts sole out on the<br />
décollement. The décollement is typically located near a common stratigraphic horizon, but locally cuts up- or downsection where<br />
the stratigraphy is folded or faulted. The décollement generally is imaged as a simple reversed-phase reflection that has been<br />
modeled as a low-velocity, high-porosity zone about 10-14 m thick. We infer that this thin, high-porosity zone is an undercompacted,<br />
high-fluid-pressure section, and that mapped variations in décollement amplitude and polarity reflect décollement fluid<br />
content and fluid migration paths.<br />
INTRODUCTION<br />
Leg <strong>156</strong> drilled the Barbados accretionary prism as a type-example<br />
of a convergent margin which is actively accreting oceanic pelagic/<br />
hemipelagic sediments. Although previous Deep Sea Drilling Project<br />
(DSDP) and Ocean Drilling Program (ODP) drill sites and a few<br />
regional seismic reflection lines have defined the small-scale structural<br />
setting of the area, the regional structural context has remained poorly<br />
defined. In this paper we define the regional structural setting of the<br />
northern Barbados Ridge accretionary prism as well as the local structural<br />
framework of the Leg <strong>156</strong> drill sites from a 1992 survey that<br />
collected two-dimensional (2-D) and three-dimensional (3-D) seismic<br />
reflection data and multibeam bathymetry (Shipley et al., 1994). We<br />
present representative seismic lines as well as a regional multibeam<br />
bathymetric map.<br />
REGIONAL TECTONIC <strong>SETTING</strong><br />
The Barbados Ridge accretionary complex forms at the boundary<br />
between the subducting North American plate and the overriding<br />
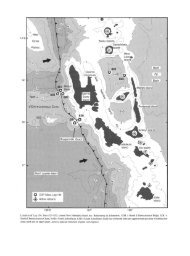
Caribbean plate (Fig. 1). Plate convergence is oriented approximately<br />
east-west, at a rate of about 35 km/m.y. (DeMets et al., 1990). The<br />
crest of the Barbados Ridge lies approximately 150 km east of the<br />
Lesser Antilles (volcanic arc). The ridge forms the eastern boundary<br />
of the Tobago Trough (forearc basin) and marks the location where<br />
Shipley, T.H., Ogawa, Y., Blum, P., et al., 1995. Proc. ODP, Init. Repts., <strong>156</strong>: College<br />
Station, TX (Ocean Drilling Program).<br />
Department of Geology and Geophysics, University of Hawaii, Honolulu, HI 96822,<br />
U.S.A.<br />
3<br />
Institute for Geophysics, University of Texas at Austin, Austin, TX 78759-8345,<br />
U.S.A.<br />
4<br />
Earth Sciences Board, University of California, Santa Cruz, CA 95064, U.S.A.<br />
subducted Atlantic oceanic crust passes beneath the crystalline crust<br />
of the volcanic arc (Westbrook et al., 1984; Bouysse et al., 1990).<br />
Accretion has occurred along the plate boundary since at least the<br />
Eocene (Speed and Lame, 1982), resulting in the growth of the<br />
massive complex. The prism forms a very wide, low-taper wedge that<br />
increases in width and thickness from north to south (Westbrook et<br />
al., 1984). The Leg 78A/110 drilling transect is on the boundary<br />
between two provinces of the Barbados Trench where the Tiburon<br />
Rise partially dams northward along-trench transport of turbidites at<br />
about 15°45'N (Fig. 1). Few terrigenous turbidites therefore occur in<br />
the abyssal plain section in the drilling transect. The accretionary<br />
wedge is less than 200 km wide north of the Tiburon Rise; the wedge<br />
increases in width to more than 300 km to the south of the rise. At<br />
15°32'N, the latitude of the ODP drilling transect, the complex is 125<br />
km wide and as much as 10 km thick at its western edge. The<br />
accretionary complex is exposed on the island of Barbados near the<br />
southern end of the ridge (Speed and Larue, 1982).<br />
Frontal structures in the southern region of the Barbados Ridge<br />
include long wavelength folds and widely spaced thrust faults (e.g.,<br />
Biju-Duval et al., 1982; Westbrook and Smith, 1983; Bangs et al.,<br />
1990), whereas to the north, where sediments along the thrust front<br />
are significantly thinner, the toe of the wedge is dominated by closely<br />
spaced thrusts, and out-of-sequence thrusts (OOSTs) are common<br />
(Biju-Duval et al., 1982; Westbrook et al., 1984; Brown et al., 1990).<br />
In the north, the décollement and the underthrust sediment are discontinuously<br />
imaged to the overthrust arc basement about 120 km west<br />
of the deformation front at a depth of 7-8 km (Westbrook et al., 1988;<br />
Bangs et al., 1990).<br />
MULTIBEAM BATHYMETRIC DATA<br />
We conducted a multibeam bathymetric and seismic reflection survey<br />
over the Leg <strong>156</strong> area on the Maurice Ewing in June 1992 (Shipley<br />
13
G.F. MOORE ET AL.<br />
18°N<br />
62°W<br />
Figure 1. Regional tectonic map of the Lesser Antilles (bathymetry in meters). Shaded zone is the extent of the northern Barbados Ridge accretionary prism. The<br />
rectangular box is approximately the size of the multibeam bathymetric map shown in Figure <strong>2.</strong> IDF = inner deformation front.<br />
et al, 1994). Navigation was based on a real-time differential global<br />
positioning system (DGPS) with a base station in Barbados.<br />
Bathymetric data were collected during the entire survey using the<br />
Atlas Electronik Hydrosweep-DS formed-beam swath-mapping sonar<br />
system (Grant and Schreiber, 1990; Chayes, 1991). We processed<br />
a small portion of the data that covered the area of the 3-D survey and<br />
a long east-west line through the center of the survey area (Figs. 1 and<br />
2). We first corrected the survey navigation with the DGPS data,<br />
followed by analysis using the MB-System software (Chayes and<br />
Caress, 1993) to calculate the water depth and horizontal offset for<br />
each beam from raw traveltime measurements using a ray-tracing<br />
routine through a 24-layer sonic-velocity model appropriate for this<br />
region. The data were passed through a bathymetric gradient filter to<br />
remove bad beams associated with anomalously long or short traveltime<br />
measurements. An across-track filter was applied to remove<br />
along-track anomalies, and the depth data were gridded at a 25-m<br />
interval. The grid was contoured to produce a bathymetric map and<br />
14<br />
was then fit with a smooth surface and illuminated to produce the<br />
shaded-relief image (Fig. 2; see also back-pocket foldout).<br />
The thrust front is expressed along the seafloor as a narrow northsouth-trending<br />
trough that extends to a water depth of 5050 m at the<br />
south edge of the survey area and to about 5190 m at the north end.<br />
The topography on the oceanic plate, east of the thrust front, trends<br />
generally north-south, but curves to the northwest-north of the 3-D<br />
survey area.<br />
In the southern part of the 3-D survey, the topographic trends of<br />
the accretionary prism within 6 km of the thrust front are north-south,<br />
but curve to the northwest in the northern part of the survey area.<br />
North-northeast-trending ridges, which mark OOSTs, cross the prism<br />
beginning about 9 km west of the thrust front.<br />
The region west of the 3-D survey area is dominated by the gentle<br />
east-west slope of the accretionary prism surface. Several fault scarps<br />
are associated with OOSTs at 58°52'W and 59°02'W Anorth-southtrending<br />
basin at 59° 1 l'W is bounded by a north-south ridge on the
15°30"N<br />
A<br />
59°30'W 59°24' 59°18 59°12' 59°06' 59°00' 58°54' 58°48' 58°42' 58°36' 58°30'<br />
10 15 20 25<br />
58°30'N<br />
59°00W<br />
Depth (km)<br />
4400 ! 4800<br />
Figure <strong>2.</strong> Regional hydrosweep bathymetry. (See back-pocket foldout for original-size reproduction.) Contour interval is 25 m. See Figure 1 for location. Circles are locations of drill sites; box is boundary of 3-D<br />
seismic survey; long line is location of Line 1; barbed line is thrust front. A. Contour map of entire survey. B. Shaded relief map of eastern half of survey. Small gridding artifacts in the eastern portion of the data<br />
are visible because of the generally subdued topography.<br />
58°36'<br />
_58°3σ
G.F. MOORE ET AL.<br />
2050<br />
2050<br />
Site<br />
947 Site Site Final<br />
Original<br />
_6<br />
7<br />
r6<br />
7 5<br />
Figure 3. Velocity model used for time-to-depth conversion of the seismic<br />
reflection data. All velocities are interval velocities in m/s. A. Velocity function<br />
used for conversion of seismic lines in this paper is based on Leg <strong>156</strong> vertical<br />
seismic profile and logging data. B. Original velocity used for depth conversion<br />
by Shipley et al. (1994). C. Bangs et al. (1990) velocities for region to the north<br />
of Leg <strong>156</strong> transect shown for comparison.<br />
west and a northwest-trending ridge on the east. Topography at the<br />
west end of the map is complex, with a north-northeast-trending ridge<br />
at 59°23'W and a northwest-trending basin at 59°26'W.<br />
SEISMIC REFLECTION DATA<br />
Acquisition<br />
The seismic acquisition program consisted of a 3-D survey in<br />
which we collected 102 seismic lines, each 25 km long and separated<br />
by 50 m, followed by acquisition of a 100 km long 2-D seismic line<br />
(Line 1). Acquisition used a 10-air-gun, 38-L (2320 in. 3 ) source array<br />
and a 650-m, 52-channel streamer with 1<strong>2.</strong>5-m group interval. We<br />
used a short streamer in order to minimize streamer feathering. The<br />
streamer used six compass sections to monitor feathering. The common<br />
midpoint (CMP) of the far offset channel was later determined<br />
to be less than 25 m (half the distance between lines). This obviated<br />
the need for full 3-D sorting and stacking. Shot firing was controlled<br />
by software coupled to the DGPS system at a nominal 30.0-m spacing<br />
(37.5 m for Line 1). Actual shot distances were later determined by<br />
comparing DGPS positions for each shot. These actual shot distances<br />
were used for CMP sorting.<br />
Processing<br />
Initial processing of the 3-D data followed a standard 2-D processing<br />
sequence. Each line was edited for bad traces, sorted into 2-D<br />
CMP bins (15 m), filtered (5-80 Hz), corrected for normal move out<br />
(NMO), and stacked (-26 fold). One line was then interpolated between<br />
each acquired line. The resulting 25-m line spacing decreased<br />
(but did not eliminate) spatial aliasing in the 3-D migration. The total<br />
16<br />
data volume of 205 lines × 1635 traces (5100 m x 24,510 m × 9 s)<br />
underwent a one-pass 3-D time migration, spherical spreading correction,<br />
and depth conversion. Velocities for depth conversion were<br />
derived from the model of Bangs et al. (1990) (Fig. 3C) modified by<br />
depth data from Leg 110 (Fig. 3). Selected lines over the Leg <strong>156</strong> drill<br />
sites were reconverted from time to depth using new velocity information<br />
(Fig. 3A) from vertical seismic profiles acquired in Holes<br />
948D and 949C (see site chapters, this volume). The 3-D data volume<br />
was also remigrated at the Geotechnology Research Institute of the<br />
Houston Area Research Center (HARC) using a split-step depth<br />
migration (Stoffa et al., 1990). The lines used in this paper were scaled<br />
with a 0.5-s automatic gain control operator to enhance structural<br />
features. Processing parameters for the 2-D line were the same as for<br />
the 3-D survey, except that we used a 2-D frequency-wave number<br />
(F-K) time migration.<br />
Interpretation<br />
Structural interpretation of the 3-D seismic lines was carried out<br />
on a workstation using Landmarks SeisWorks software. We used<br />
both the original migrations and the remigrated versions for interpretation.<br />
Structural features are generally similar in the two versions,<br />
but there are subtle differences in positioning of some reflections,<br />
which leads to slightly different interpretations. Because reprocessing<br />
and interpretation of the 3-D data set are ongoing, the interpretations<br />
presented here should be considered preliminary.<br />
Fault locations were originally interpreted on dip lines. These<br />
fault locations were transferred to strike lines that were constructed<br />
from the 3-D data volume. Lateral ramps were readily apparent in<br />
these displays.<br />
The seafloor, décollement, and top of oceanic crust reflections were<br />
digitized throughout the 3-D data volume and maps were made of these<br />
horizons. We also generated a map of the amplitude of the seafloor<br />
reflection (Fig. 4) as an aid in identifying the trends of thrust faults.<br />
Regional Seismic Line<br />
Our regional seismic line (Line 1, Fig. 5; see also back-pocket<br />
foldout) was run through the middle of the 3-D survey, coincident<br />
with Line 688 (Fig. 6). This 2-D line illustrates the main structural<br />
features of the Barbados prism. There are four major structural elements<br />
in this region: (1) the subducting oceanic crust, (2) the sedimentary<br />
sequence overlying oceanic crust seaward of the frontal<br />
thrust, which is apportioned into (3) the underthrusting sedimentary<br />
sequence, and (4) the accretionary prism.<br />
Oceanic Crust<br />
The oceanic crust is a strong west-dipping reflection that can be<br />
traced westward under the accretionary prism to at least CMP 4650 at<br />
7.5-km depth, and with less certainty to approximately CMP5900 (65<br />
km landward of the thrust front) where the reflection is obscured by<br />
the seafloor multiple at approximately 8.25-km depth (Fig. 5). The<br />
regional dip of the oceanic crust under the accretionary prism is 3.5°.<br />
The oceanic crust has significant topography, with relief of 300-<br />
400 m that is caused by normal faults, although seamounts locally<br />
account for 200-300 m of relief. The normal faults dip both west and<br />
east, defining a series of horst and graben structures. The generally<br />
smooth westward dip of the oceanic crust is disrupted by a large offset<br />
at about CMP 4000, where the crust is displaced upward approximately<br />
500 m.<br />
Sedimentary Sequence Seaward of the Thrust Front<br />
Although the sedimentary section seaward of the thrust front was<br />
previously divided into five seismic units at Site 672 (Shipboard<br />
Scientific Party, 1988), the distinction between their Units A and B
15°32'N<br />
58°48'W 58°46' 58°44' 58°42'<br />
600 800 1000<br />
Cross-line<br />
2 3<br />
km<br />
1200 1400<br />
2 3 4 5 6 7<br />
Reflection amplitude x 100,000<br />
<strong>STRUCTURAL</strong> <strong>SETTING</strong><br />
Figure 4. Map of seafloor reflection amplitudes digitized from 3-D seismic data set. Dark regions (low reflection amplitudes) are structural lows; lighter regions<br />
(high reflection amplitudes) are structural highs. Thrust front is shown with barbed line. Circles designate drill site locations (ODP Leg <strong>156</strong> in black type; ODP<br />
Leg 110 and DSDP Leg 78A in reverse type). Three-dimensional strike lines are labeled along right side; 3-D dip lines are labeled along bottom (CMP numbers).<br />
::i<br />
Figure 5. Depth section of east-west seismic Line 1 (coincident with 3-D Line 688). Location is shown in Figure 2A. (See back-pocket foldout for original-size<br />
reproduction.) CDP = common depth point. VE = vertical exaggeration (Figs. 5-14).<br />
is not apparent on our seismic lines, so we prefer to use only four<br />
seismic units. The upper unit (Unit 1) correlates with Site 672 Units<br />
A and B and is bounded by the seafloor and a strong reflection at a<br />
depth of approximately 200 m (Horizon "A" on Figs. 7 and 8). The<br />
unit is composed of discontinuous, parallel, relatively high-amplitude<br />
reflections. Unit 2 correlates with 672 Unit C, is nearly acoustically<br />
transparent, and is generally 180-200 m thick. Unit 3 (672 Unit D)<br />
consists of strong, laterally continuous reflections and varies in thickness<br />
from 100 m to about 200 m. Unit 4 (672 Unit E) lies below Unit<br />
3 and above the oceanic crust. This unit has weak, but laterally<br />
continuous, parallel reflections that onlap structural highs in the oceanic<br />
crust.<br />
13<br />
800<br />
600<br />
The overall thickness of the sedimentary sequence seaward of the<br />
frontal thrust is controlled by the oceanic crust topography. It varies<br />
from a maximum of 850 m above structural lows to a minimum of 490<br />
m over structural highs. Most of the thickness variation occurs in<br />
seismic Unit 4, indicating that most of the basement topography was<br />
formed well seaward of the northern Barbados Ridge.<br />
Sediments above the oceanic crust are moderately folded and<br />
faulted seaward of the thrust front. Most faults within the sedimentary<br />
section mimic faults in the oceanic crust. Most folds are localized<br />
over basement topographic highs, suggesting that they are the result<br />
of pelagic drape and later differential compaction over these highs.<br />
Horizon "A" has relief of 50-100 m in several locations.<br />
17
G.F. MOORE ET AL.<br />
400 600<br />
4.5<br />
5.5<br />
800 Common midpoint Q<br />
1200 1400<br />
Site 949<br />
Frontal thrust<br />
VE = <strong>2.</strong>4x<br />
Frontal thrust<br />
Figure 6. Depth sections of 3-D seismic Lines 688 and 736. Depth corrected using Leg <strong>156</strong> vertical-sesimic-profile velocity data. See Figure 4 for location.<br />
Underthrust Sedimentary Sequence<br />
The upper seismic unit is offscraped at the frontal thrust and<br />
incorporated into the accretionary prism. The lower three units are<br />
underthrust beneath the prism. The top of the underthrust sedimentary<br />
sequence is the basal décollement of the accretionary prism. The<br />
décollement is a strong reflection from the thrust front westward to at<br />
least CMP 4300 (Fig. 5).<br />
The underthrust sequence is highly variable in thickness because of<br />
the previously discussed basement topography. The thickness varies<br />
from approximately 500 m thick in a structural low beneath the frontal<br />
thrust to less than 300 m thick over a basement structural high at CMP<br />
2300, to 250 m (or less) over a basement high at CMP 3000 (Fig. 5).<br />
West of this basement high, the thickness of the underthrust sequence<br />
is more uniform at 200-250 m. West of the large basement fault at CMP<br />
4000, the underthrust sedimentary sequence is not well imaged.<br />
Accretionary Prism<br />
The accretionary prism is defined at its base by a basal décollement<br />
and at its top by the seafloor or the base of the slope sediments. It<br />
thickens from about 200 m at the thrust front to more than 4.5 km at<br />
the west end of our seismic line. This thickening is primarily the result<br />
of structural stacking of thrust sheets (Brown et al., 1990). The structure<br />
of the prism near the thrust front is better imaged on our 3-D lines<br />
and will therefore be discussed in more detail below. Only seismic Unit<br />
1, which is fairly constant in thickness, is accreted at the thrust front.<br />
The structure of the prism starting 7.5 km west of the thrust front<br />
is dominated by OOSTs which were recognized by Brown et al.<br />
(1990), who attributed their formation to reorganization of the wedge<br />
to maintain its critical taper (e.g., Davis et al., 1983). The first large<br />
OOST west of the thrust front is associated with a structural high in<br />
18<br />
the subducting oceanic crust at CMP 3000; it comes to the surface at<br />
approximately CMP 2500.<br />
Slope Sediments<br />
Slope sediments begin to accumulate on the prism a few kilometers<br />
landward of the thrust front. They thicken westward, reaching a<br />
maximum thickness of 600 m in a topographic low at about CMP<br />
5900. They are generally nearly reflection-free, which is usually an<br />
indication that they are primarily hemipelagic sediments.<br />
3-D Seismic Data<br />
The local structure around Leg <strong>156</strong> drill sites is shown by the 3-D<br />
seismic data (Figs. 6-14). Because of the increased accuracy of imaging<br />
by using 3-D migration and the ability to generate cross lines,<br />
the 3-D data set allows us to focus on details not adequately resolved<br />
in the 2-D line.<br />
Deformation Seaward of the Thrust Front<br />
The deformation of strata seaward of the thrust front noted above<br />
is displayed in the 3-D data set (Figs. 7 and 8). The oceanic crust<br />
reflection is offset at least 200 m across an east-facing normal fault at<br />
CMP 1650. West-facing normal faults between CMPs 1550 and 1600<br />
offset the oceanic crust 50 to 75 m.<br />
The deepest sedimentary sequence is highly variable in thickness,<br />
particularly in the strike direction (north-south) (Figs. 7 and 8).<br />
Sequence 4 thickens from 300 m at the north end of the survey area<br />
to about 500 m at the south end. The reflections in Unit 4 onlap the<br />
oceanic crust reflection, suggesting that this unit is formed of turbidites<br />
that were deposited in pre existing topographic lows.
w 1500 1600<br />
Common midpoint<br />
<strong>STRUCTURAL</strong> <strong>SETTING</strong><br />
1700 Line 751<br />
Figure 7. Line 751 showing sedimentary sequence at ODP Site 67<strong>2.</strong> See Figure 4 for location. Note deformation of Horizon "A."<br />
Seismic Units 1-3 are of nearly constant thickness throughout the<br />
3-D survey area, but they are folded and offset by normal faults. Much<br />
of the folding appears to be a result of differential compaction over<br />
the structural highs in the oceanic crust. Fold wavelengths in Horizon<br />
"A" are about 1-2 km and fold amplitudes are 150-200 m.<br />
Proto-décollement<br />
The existence of an incipient or "proto"-décollement was postulated<br />
based on the results of drilling on ODP Leg 110 (Moore et al.,<br />
1988). Reverse faults and other structural features indicative of compressive<br />
stress are restricted to a lower Miocene interval at Site 67<strong>2.</strong><br />
This lower Miocene section correlates stratigraphically with the top<br />
of the décollement at Site 671, leading to the hypothesis that stresses<br />
related to the developing accretionary complex propagate a few kilometers<br />
seaward of the thrust front and that this horizon will become<br />
the site of the future décollement (Shipboard Scientific Party, 1988).<br />
• • • • • , • •<br />
0 km 0.5<br />
VE = 1.5x<br />
Our 3-D seismic data support the idea that the décollement at the<br />
base of the accretionary prism is localized near, but not at, the protodécollement<br />
(Horizon "A") identified at Site 67<strong>2.</strong> The reflections<br />
beneath the décollement at Site 947 are likely to be this horizon (Figs.<br />
9-11). Near Site 949 in the northern part of the survey area, Horizon<br />
"A" is at least 25-50 m below the reflection interpreted as the décollement<br />
(Figs. 12 and 13). Where the proto-décollement horizon is<br />
structurally below the décollement, it is folded at relatively short<br />
wavelengths compared to the décollement.<br />
Décollement<br />
The décollement at the base of the northern Barbados accretionary<br />
prism is imaged as a distinct reflection that is typically reversed in<br />
polarity with respect to the seafloor reflection (Figs. 8 and 9; Bangs<br />
and Westbrook, 1991). Variations in amplitude of the décollement<br />
reflection were discussed by Shipley et al. (1994), who attribute the<br />
19
G.F. MOORE ET AL.<br />
20<br />
600<br />
I<br />
650<br />
I<br />
Line number<br />
700<br />
I<br />
750<br />
I<br />
N<br />
Cross-line 1753<br />
:i' Hh^ I rsJL ii »i^i: »!!'M. 1•.!* i ii,;;^<br />
) ) , . ! > . , ' 1 1 1 . . i l l i . I > f > , ' » » . ' * . 1 . , ' » . . » «<br />
ssiiiiiiliiiiiii<br />
Figure 8. Cross-line 1753 showing sedimentary sequence at Site 67<strong>2.</strong> See Figure 4 for location. Note large lateral variation in thickness of seismic Unit 4
6.0<br />
W<br />
900 1000<br />
I<br />
'^iiiSlijiiitli^ü iS^i liiiM^ilii^iiiig^iliii!;;;<br />
||:;•|;g:;;gj| Duplexes? ;|;g : •:<br />
mm^ : àà<br />
Common midpoint<br />
1100<br />
<strong>STRUCTURAL</strong> <strong>SETTING</strong><br />
Line 688<br />
Figure 9. Detail of Line 688 showing locations of Sites 947 and 948. Only a few of the major thrust faults are highlighted. Box indicates location of Figure 10.<br />
See Figure 4 for location.<br />
reversed polarities to a relatively thin fault zone (-14 m) with lower<br />
acoustic impedance (velocity times density) than the surrounding<br />
material. The décollement zone was a primary target for Leg <strong>156</strong><br />
drilling and its local variations amplitude around the drill sites are<br />
significant. The most important décollement amplitude variation with<br />
respect to the Leg <strong>156</strong> drill sites is the change from reversed polarity<br />
at Site 947 to normal polarity (same as the seafloor reflection) at Site<br />
948 (Fig. 9). Pronounced variations in the décollement reflection also<br />
occur in the strike direction as seen in Cross-line 1100 (Fig. 14).<br />
Imbricate Thrusting<br />
The dominant structural processes at the toe of the prism are<br />
imbricate thrusting and subsidiary back thrusting. The surface expression<br />
of the thrusts is shown in Figure 4, a map of seafloor reflection<br />
E<br />
1200<br />
i<br />
amplitudes. Most of the thrusts trend north-northwest with a spacing<br />
of 200-300 m. Many of the thrusts are closely spaced and have offsets<br />
just at or below the resolution of our seismic data. Lallemant et al.<br />
(1990) observed numerous small-scale thrusts and back thrusts in<br />
deep-towed side-scan sonar records from the toe of the prism.<br />
The 3-D seismic lines show that the structure within the first<br />
kilometer west of the thrust front is very complex (Fig. 12). The<br />
frontal thrust breaks the surface, and a ramp anticline has developed<br />
over it. The frontal ramp is difficult to follow westward and downward<br />
toward the décollement. We have identified a backthrust extending<br />
westward from the frontal ramp in this area (Fig. 12).<br />
A second major thrust, also overlain by a ramp anticline, has<br />
developed about 1 km west of the frontal thrust on Line 736, CMP<br />
1275 (Fig. 12). This thrust cuts off a thick sedimentary section just<br />
above the décollement and was identified at Site 949 at a depth of<br />
21
G.F. MOORE ET AL.<br />
Figure 10. Enlargement of Line 688 near Site 947 showing<br />
details of imbricate thrusts and possible duplexes.<br />
See Figure 9 for location. Reprocessed line using splitstep<br />
depth migration. Solid lines are thrusts and dashed<br />
lines are stratigraphic horizons.<br />
5.25<br />
5.5<br />
5.75<br />
about 250 mbsf where it has a dip of approximately 15°. Additional<br />
backthrusts cut the section between CMPs 1270 and 1300 and disrupt<br />
reflector continuity.<br />
Major thrust faults were also intersected at Sites 947 and 948 (Fig.<br />
9). We have identified at least nine thrusts that dip 20°-30° in the 2<br />
km between Sites 947 and 948. These dips are steep enough that none<br />
of the thrusts intersected at Site 947 extends to the region of Site 948.<br />
Duplexing<br />
Brown et al. (1990) interpreted subhorizontal reflections just<br />
above the décollement as sediment underplated by duplexing starting<br />
about 12 km landward of the thrust front. Although the distinction<br />
between duplexing and underplating by OOSTs is difficult to resolve,<br />
we believe that our 3-D seismic lines show evidence for duplexing<br />
along the décollement. We interpret duplexes to be very common near<br />
Site 947 and perhaps as far seaward as Site 948, approximately 4 km<br />
landward of the thrust front (Figs. 9 and 10). Depth slices from 5396<br />
to 5404 m near Site 947 show that the duplexes trend north-northwest,<br />
similar to the trend of the surface topography. They are laterally<br />
continuous for more than 2 km.<br />
Lateral Ramps<br />
Lateral ramps are important structural features near the toe of the<br />
Barbados prism (Fig. 11). Most of the ramps that we have mapped dip<br />
to the south and have 50-100 m of relief. As the imbricate thrusts<br />
climb up the lateral ramps, the thrust packets are folded at wavelengths<br />
of 1-2 km. Lateral ramps are most common from about 1.5 to<br />
6 km west of the thrust front.<br />
950 Common midpoint 1000 1050<br />
:•T- II•M>•IIHII I „ , ,» >>.I.>»»»»»I»»>µ>>,<br />
DISCUSSION<br />
An important parameter in the development of the Barbados accretionary<br />
prism is the relatively strong preexisting deformation of<br />
strata seaward of the thrust front. The folding and normal faulting is<br />
much more intense in other prisms, such as Cascadia (e.g., Cochrane<br />
et al., 1994) or Nankai (e.g., Moore et al., 1990). In these prisms that<br />
have thick sections of terrigenous trench fill, strata are generally<br />
horizontal and undeformed; a proto-décollement propagates seaward<br />
of the thrust front and a protothrust zone is developed. There is<br />
evidence for seaward propagation of the décollement in Barbados,<br />
but there is not a well-developed protothrust zone.<br />
The Barbados décollement is generally located near a specific<br />
stratigraphic layer (Horizon "A"), but is locally above or below this<br />
horizon. We believe that this is because this horizon has been deformed<br />
seaward of the thrust front and is not planar, thus causing the<br />
relatively planar décollement to jump between weak regions, above<br />
or below the horizon, as it propagates seaward.<br />
Duplexes, backthrusts, and lateral ramps are important features of<br />
the Barbados prism, causing small-scale imbrication and disruption of<br />
thrust packages at a scale of 1-2 km. Out-of-sequence thrusting becomes<br />
an important process more than 6 km west of the thrust front. Many of<br />
the major OOSTs are localized over basement topographic highs.<br />
ACKNOWLEDGMENTS<br />
This research was supported by NSF grants OCE-9119336 (UH),<br />
OCE-9116350 (UCSC), and OCE-9116172 (UT). Don Reed and Kirk<br />
Mclntosh provided insightful and helpful reviews of the manuscript.<br />
We thank Captain Ian Young, the officers, and crew for professional
6.0<br />
s<br />
600 650<br />
I<br />
Line number<br />
700 750<br />
I<br />
<strong>STRUCTURAL</strong> <strong>SETTING</strong><br />
N<br />
Cross-line 988<br />
Figure 11. Cross-line 988. Lateral ramps inteΦreted by connecting fault locations transferred from dip lines. See Figure 4 for location.<br />
23
G.F. MOORE ET AL.<br />
W<br />
1100 1200<br />
|ll:SPii|; iillil<br />
'JT Accretionary ^"iii>:^;';:'!!^^;^"';^;;!'-'?! 1 '';<br />
Common midpoint<br />
1300<br />
Line 736<br />
»" l ''!i.ii.'•"• l i••i;'•.•i|'• •:»'i)i:iiii;Hli!•»i'i":J;. l f:'!'i,>»''Li>i!li"; .-.!',H;.•.i»w>»i).)»iil>i'!^ii»ii»'!?.;:,».»;..'i.••il: M•'•v::t^»i<br />
&IS •^^^SSs SS? ••iiSSS<br />
Figure 1<strong>2.</strong> Detail of Line 736 showing location of Site 949. Proto-décollement horizon (Horizon "A") shown as dashed line. See Figure 4 for location.<br />
operations of the Maurice Ewing. We thank Joan Marsden and Director<br />
Wayne Hunte of the Bellairs Research Station of McGill University<br />
for the use of their facilities, Sevin Bilir (UT) who monitored the DGPS<br />
station, and Claudia Kawakami and Iris Stewart for their painstaking<br />
trace editing. Stephen Saustrup performed the 3-D migrations at UT.<br />
The MB-System data processing programs were kindly provided by<br />
Dale Chayes and Dave Caress of LDEO. Karen Sender performed<br />
the initial Hydrosweep data processing. We thank Manik Talwani of<br />
HARC for providing the computer time for the split-step migration and<br />
Walter Kessinger of HARC for performing the remigration. SOEST<br />
contribution number 367<strong>2.</strong> UTIG contribution number 1074.<br />
REFERENCES*<br />
Bangs, N.L., and Westbrook, G.K., 1991. Seismic modeling of the décollement<br />
zone at the base of the Barbados Ridge accretionary complex. J. Geophys.<br />
Res., 96:3853-3866.<br />
Abbreviations for names of organizations and publication titles in ODP reference lists<br />
follow the style given in Chemical Abstracts Service Source Index (published by<br />
American Chemical Society).<br />
E<br />
1400<br />
Bangs, N.L., Westbrook, G.K., Ladd, J.W., and Buhl, P., 1990. Seismic<br />
velocities from the Barbados Ridge complex: indicators of high pore fluid<br />
pressures in an accretionary complex. J. Geophys. Res., 95:8767-878<strong>2.</strong><br />
Biju-Duval, B., LeQuellec, P., Mascle, A., Renard, V., and Valery, P., 198<strong>2.</strong><br />
Multibeam bathymetric survey and high resolution seismic investigations<br />
of the Barbados Ridge complex (Eastern Caribbean): a key to the knowledge<br />
and interpretation of an accretionary wedge. Tectonophysics, 86:275-<br />
304.<br />
Bouysse, P., Westercamp, D., and Andreieff, P., 1990. The Lesser Antilles<br />
island arc. In Moore, J.C., Mascle, A., et al., Proc. ODP, Sci. Results, 110:<br />
College Station, TX (Ocean Drilling Program), 29^4.<br />
Brown, K.M., Mascle, A. and Behrmann, J.H., 1990. Mechanisms of accretion<br />
and subsequent thickening in the Barbados Ridge accretionary complex:<br />
balanced cross sections across the wedge toe. In Moore, J.C., Mascle, A.,<br />
et al., Proc. ODP, Sci. Results, 110: College Station, TX (Ocean Drilling<br />
Program), 209-227.<br />
Chayes, D.N., 1991. Hydrosweep-DS on the R/V Ewing. In Oceans '91:<br />
Ocean Technologies and Opportunities in the Pacific for the '90's:<br />
Pascataway, NJ (IEEE), 2:737-74<strong>2.</strong><br />
Chayes, D.N., and Caress, D.W., 1993. Processing and display of multibeam<br />
echosounder data on the R/V Maurice Ewing. Eos, 74:56<strong>2.</strong><br />
Cochrane, G.R., Moore, J.C., MacKay, M.E., and Moore, G.F., 1994. Velocity<br />
and inferred porosity model of the Oregon accretionary prism from multi-
channel seismic reflection data: implications on sediment dewatering and<br />
overpressure. J. Geophys. Res., 99:7033-7043.<br />
Davis, D.M., Suppe, J., and Dahlen, F.A., 1983. Mechanics of fold-and-thrust<br />
belts and accretionary wedges. J. Geophys. Res., 88:1153-117<strong>2.</strong><br />
DeMets, C, Gordon, R.G., Argus, D.F., and Stein, S., 1990. Current plate<br />
motions. Geophys. J. Int., 101:425^78.<br />
Grant, J.A., and Schreiber, R., 1990. Modern swath sounding and sub-bottom<br />
profiling technology for research applications: the Atlas Hydrosweep and<br />
Parasound systems. Mar. Geophys. Res., 12:9-19.<br />
Lallemant, S.J.C., Henry, P., Le Pichon, X., and Foucher, J.P., 1990. Detailed<br />
structure and possible fluid paths at the toe of the Barbados accretionary<br />
wedge (ODPLeg 110 area). Geology, 18:854-857.<br />
Moore, G.F., Shipley, T.H., Stoffa, PL., Karig, D.E., Taira, A., Kuramoto, S.,<br />
Tokuyama, H., and Suyehiro, K., 1990. Structure of the Nankai Trough<br />
accretionary zone from multichannel seismic reflection data. J. Geophys.<br />
Res., 95:8753-8765.<br />
Moore, J.C., Mascle, A., Taylor, E., Andreieff, P., Alvarez, E, Barnes, R., Beck,<br />
C, Behrmann, J., Blanc, G., Brown, K., Clark, M., Dolan, J., Fisher, A.,<br />
Gieskes, J., Hounslow, M., McLellan, P., Moran, K., Ogawa, Y., Sakai, T.,<br />
Schoonmaker, J., Vrolijk, P.J., Wilkens, R., and Williams, C, 1988. Tectonics<br />
and hydrogeology of the northern Barbados Ridge: results from<br />
Ocean Drilling Program Leg 110. Geol. Soc. Am. Bull., 100:1578-1593.<br />
Shipboard Scientific Party, 1988. Site 67<strong>2.</strong> In Mascle, A., Moore, J.C., et al.,<br />
Proc. ODP, Init. Repts., 110: College Station, TX (Ocean Drilling Program),<br />
205-310.<br />
<strong>STRUCTURAL</strong> <strong>SETTING</strong><br />
Shipley, T.H., Moore, G.F., Bangs, N.L., Moore, J.C., and Stoffa, PL., 1994.<br />
Seismically inferred dilatancy distribution, northern Barbados Ridge<br />
décollement: implications for fluid migration and fault strength. Geology,<br />
22:411-414.<br />
Speed, R.C., and Larue, D.K., 198<strong>2.</strong> Barbados: architecture and implications<br />
for accretion. /. Geophys. Res., 87:3633-3643.<br />
Stoffa, PL., Fokkema, J.T., de Luna Freire, R.M., and Kessinger, W.P., 1990.<br />
Split-step Fourier migration. Geophysics, 55:410-421.<br />
Westbrook, G.K., Ladd, J.W., Buhl, P., Bangs, N., and Tiley, G.J., 1988. Cross<br />
section of an accretionary wedge: Barbados Ridge complex. Geology,<br />
16:631-635.<br />
Westbrook, G.K., Mascle, A., and Biju-Duval, B., 1984. Geophysics and<br />
structure of the Lesser Antilles forearc. In Biju-Duval, B., Moore, J.C., et<br />
al., Init. Repts. DSDP, 78A: Washington (U.S. Govt. Printing Office),<br />
23-38.<br />
Westbrook, G.K., and Smith, M.J., 1983. Long décollements and mud volcanoes:<br />
evidence from the Barbados Ridge Complex for the role of high<br />
pore-fluid pressure in the development of an accretionary complex. Geology,<br />
11:279-283.<br />
Ms <strong>156</strong>IR-102<br />
25
G.F. MOORE ET AL.<br />
26<br />
S<br />
600 650<br />
I<br />
Line number<br />
700<br />
Site 949<br />
Figure 13. Cross-line 1228 showing structure near Site 949. See Figure 4 for location.<br />
750<br />
I<br />
Cross-line 1228<br />
km<br />
VE = <strong>2.</strong>5x
5.0<br />
6.0<br />
S<br />
600<br />
I<br />
650<br />
I<br />
Line number<br />
700<br />
I<br />
Figure 14. Cross-line 1100 showing structure near Site 948. See Figure 4 for location.<br />
750 Cross-line 1100<br />
I<br />
<strong>STRUCTURAL</strong> <strong>SETTING</strong><br />
km<br />
VE = <strong>2.</strong>5×<br />
27