Economic Contribution of the Oceans Sector in British Columbia
Economic Contribution of the Oceans Sector in British Columbia
Economic Contribution of the Oceans Sector in British Columbia

You also want an ePaper? Increase the reach of your titles
YUMPU automatically turns print PDFs into web optimized ePapers that Google loves.
<strong>Economic</strong><br />
<strong>Contribution</strong> <strong>of</strong><br />
<strong>the</strong> <strong>Oceans</strong> <strong>Sector</strong><br />
<strong>in</strong> <strong>British</strong> <strong>Columbia</strong><br />
Prepared for:<br />
Canada/<strong>British</strong> <strong>Columbia</strong><br />
<strong>Oceans</strong> Coord<strong>in</strong>at<strong>in</strong>g Committee<br />
Prepared by:<br />
GSGislason & Associates Ltd.<br />
Vancouver, B.C.<br />
In Association with:<br />
Ellen F. Battle Consult<strong>in</strong>g Inc., Victoria, B.C.<br />
Edna Lam Consult<strong>in</strong>g, Vancouver, B.C.<br />
Pierce Lefebvre Consult<strong>in</strong>g, Vancouver, B.C.<br />
APRIL 2007
<strong>Economic</strong> <strong>Contribution</strong> <strong>of</strong> <strong>the</strong> <strong>Oceans</strong> <strong>Sector</strong> <strong>in</strong> <strong>British</strong> <strong>Columbia</strong> i<br />
Preface<br />
This report was prepared under contract for <strong>the</strong><br />
Canada/<strong>British</strong> <strong>Columbia</strong> <strong>Oceans</strong> Coord<strong>in</strong>at<strong>in</strong>g<br />
Committee (OCC). The OCC consists <strong>of</strong> <strong>the</strong> follow<strong>in</strong>g<br />
federal and prov<strong>in</strong>cial agencies:<br />
h federal<br />
Fisheries & <strong>Oceans</strong> Canada<br />
Environment Canada<br />
Natural Resources Canada<br />
Parks Canada<br />
h prov<strong>in</strong>cial -<br />
B.C. M<strong>in</strong>istry <strong>of</strong> Environment (<strong>Oceans</strong> &<br />
Mar<strong>in</strong>e Fisheries Branch)<br />
B.C. M<strong>in</strong>istry <strong>of</strong> Energy, M<strong>in</strong>es & Petroleum<br />
Resources<br />
Summary<br />
1. Introduction<br />
h <strong>the</strong> ris<strong>in</strong>g <strong>in</strong>terest <strong>in</strong> <strong>the</strong> ocean has not been<br />
matched by support<strong>in</strong>g economic <strong>in</strong>formation<br />
and analysis <strong>in</strong> <strong>British</strong> <strong>Columbia</strong> – <strong>the</strong> oceans<br />
sector is not well represented by conventional<br />
statistics<br />
h this study is a first step <strong>in</strong> fill<strong>in</strong>g <strong>the</strong> data gaps to<br />
help all levels <strong>of</strong> government, First Nations, key<br />
stakeholders, and <strong>the</strong> public at large to better<br />
comprehend <strong>the</strong> ocean’s economic significance<br />
h this study has two ma<strong>in</strong> objectives<br />
def<strong>in</strong>e and describe <strong>the</strong> B.C. oceans sector<br />
estimate <strong>the</strong> direct <strong>in</strong>dustry, <strong>in</strong>direct supplier<br />
and <strong>in</strong>duced consumer spend<strong>in</strong>g impacts <strong>of</strong><br />
<strong>the</strong> B.C. oceans sector to <strong>the</strong> prov<strong>in</strong>ce<br />
h <strong>the</strong> study also reviews <strong>the</strong> economic potential <strong>of</strong><br />
some o<strong>the</strong>r ocean sectors, <strong>in</strong> particular <strong>of</strong>fshore<br />
oil & gas and <strong>of</strong>fshore w<strong>in</strong>d energy<br />
h <strong>the</strong> study does not encompass some key areas<br />
<strong>of</strong> valuation, specifically ecosystem values and<br />
o<strong>the</strong>r non-market values. It is recognized that<br />
an assessment <strong>of</strong> <strong>the</strong>se o<strong>the</strong>r non-commercial<br />
values is essential to appreciate fully <strong>the</strong><br />
economic, social, and environmental value <strong>of</strong> <strong>the</strong><br />
ocean to <strong>British</strong> <strong>Columbia</strong><br />
h <strong>the</strong> Project Team reviewed ocean sector<br />
economic studies <strong>in</strong> o<strong>the</strong>r jurisdictions with<strong>in</strong><br />
and outside Canada, reviewed a variety<br />
<strong>of</strong> documents, conducted <strong>in</strong>terviews with<br />
B.C. Agriculture & Lands (Integrated Land<br />
Management Bureau)<br />
B.C. Attorney General<br />
The consultants have benefited from discussions<br />
with government <strong>of</strong>ficials, <strong>in</strong>dustry associations<br />
and o<strong>the</strong>rs. Notwithstand<strong>in</strong>g this assistance, <strong>the</strong><br />
authors have f<strong>in</strong>al responsibility for <strong>the</strong> analyses and<br />
conclusions <strong>of</strong> <strong>the</strong> study. The report should not be<br />
considered a reflection <strong>of</strong> <strong>the</strong> policies or positions<br />
<strong>of</strong> <strong>the</strong> <strong>in</strong>dividual member agencies <strong>of</strong> <strong>the</strong> <strong>Oceans</strong><br />
Coord<strong>in</strong>at<strong>in</strong>g Committee.<br />
government and <strong>in</strong>dustry <strong>of</strong>ficials <strong>in</strong>clud<strong>in</strong>g<br />
Statistics Canada and BC Stats personnel, and<br />
conducted special surveys <strong>of</strong> public and nongovernment<br />
agencies<br />
2. Approach and Methodology<br />
h <strong>the</strong> ocean sector is comprised <strong>of</strong> <strong>the</strong> private<br />
<strong>in</strong>dustries, research and education organizations,<br />
and various levels <strong>of</strong> government that depend<br />
on <strong>the</strong> ocean for transportation, operation,<br />
<strong>in</strong>novation or recreation or as a source <strong>of</strong><br />
extractable resources<br />
h <strong>the</strong> study adopted five pr<strong>in</strong>ciples:<br />
use <strong>the</strong> North American Industry<br />
Classification System (NAICS), to <strong>the</strong> extent<br />
possible<br />
use BC Stats/Statistics Canada data and<br />
concepts to <strong>the</strong> extent possible<br />
identify an ocean share <strong>of</strong> total sector activity<br />
where possible<br />
avoid double count<strong>in</strong>g<br />
<strong>in</strong>clude land-based process<strong>in</strong>g <strong>of</strong> ocean<br />
resources<br />
h <strong>the</strong> study identified seven (7) private sectors, two<br />
(2) public sectors and two (2) non-government<br />
sectors for analysis<br />
h <strong>the</strong> study addressed four (4) ma<strong>in</strong> economic<br />
<strong>in</strong>dicators: Gross Output, Gross Domestic
ii<br />
<strong>Economic</strong> <strong>Contribution</strong> <strong>of</strong> <strong>the</strong> <strong>Oceans</strong> <strong>Sector</strong> <strong>in</strong> <strong>British</strong> <strong>Columbia</strong><br />
Product (GDP), Labour Income, and Employment<br />
(measured <strong>in</strong> person-years)<br />
3. Results for Exist<strong>in</strong>g Industries<br />
h <strong>the</strong>re are many bus<strong>in</strong>ess activities that are<br />
dependent on <strong>the</strong> ocean environment,<br />
<strong>in</strong>clud<strong>in</strong>g: 1) resource extraction, process<strong>in</strong>g<br />
and distribution, 2) goods construction and<br />
manufactur<strong>in</strong>g, and 3) services. In addition,<br />
many public (government) and non-government<br />
sector activities are tied to <strong>the</strong> promotion and<br />
regulation <strong>of</strong> ocean-based bus<strong>in</strong>ess activities,<br />
ocean-related education and research, and ocean<br />
environmental stewardship<br />
h <strong>the</strong> ocean sector makes a very important<br />
contribution to <strong>the</strong> economy <strong>of</strong> <strong>British</strong> <strong>Columbia</strong><br />
(Table A). The total economic impact <strong>of</strong> oceanbased<br />
bus<strong>in</strong>ess activities are summarized <strong>in</strong> Table<br />
A-1. Table A-2 provides subsector details, and<br />
Table A-3 summarizes <strong>the</strong> ocean sector’s share <strong>of</strong><br />
<strong>the</strong> B.C. economy <strong>in</strong> 2005<br />
h ocean-related economic activity is concentrated<br />
<strong>in</strong> <strong>the</strong> four private sectors –ocean recreation,<br />
ocean transport, seafood, and ocean high tech<br />
- and <strong>in</strong> <strong>the</strong> federal government public sector.<br />
These five sectors comprise over 90% <strong>of</strong> <strong>the</strong><br />
ocean sector total. Never<strong>the</strong>less, all ocean-related<br />
sectors are important as <strong>the</strong>y contribute to a<br />
diversified economy throughout Coastal B.C.<br />
h total ocean sector revenues/expenditures <strong>in</strong> 2005<br />
were $11.6 billion:<br />
$3,791 million ocean recreation<br />
$3,330 million ocean transport<br />
$1,380 million seafood<br />
$1,125 million ocean high tech<br />
$854 million federal government<br />
$398 million ship & boat build<strong>in</strong>g<br />
$283 million forestry<br />
$216 million mar<strong>in</strong>e construction<br />
$153 million prov<strong>in</strong>cial government<br />
$60 million universities & research<br />
<strong>in</strong>stitutions<br />
$27 million environmental nongovernment<br />
organizations<br />
(ENGOs)<br />
h<br />
h<br />
h<br />
h<br />
h<br />
h<br />
h<br />
h<br />
<strong>the</strong> direct <strong>in</strong>dustry economic impacts <strong>of</strong> <strong>the</strong><br />
ocean sector from <strong>the</strong> $11.6 billion <strong>in</strong> revenues <strong>in</strong><br />
2005 were:<br />
$5.7 billion <strong>in</strong> GDP<br />
$4.2 billion <strong>in</strong> Labour Income i.e., wages &<br />
benefits<br />
84,400 person-years <strong>of</strong> employment<br />
<strong>the</strong> public sector has direct Labour Income<br />
compris<strong>in</strong>g over half <strong>of</strong> sector revenues whereas<br />
<strong>the</strong> private sector has direct Labour Income at<br />
one-third <strong>of</strong> revenues overall (Table B)<br />
public sector direct wages per person-year (PY)<br />
are higher than private sector direct wages per<br />
person-year - <strong>the</strong> seafood and ocean recreation<br />
sectors have <strong>the</strong> lowest annual wage rates <strong>of</strong> all<br />
bus<strong>in</strong>ess sectors considered<br />
<strong>the</strong> total direct, <strong>in</strong>direct supplier plus <strong>in</strong>duced<br />
consumer spend<strong>in</strong>g economic impacts <strong>of</strong> <strong>the</strong><br />
ocean sector <strong>in</strong> 2005 were:<br />
$11.1 billion <strong>in</strong> GDP<br />
$7.6 billion <strong>in</strong> Labour Income i.e., wages &<br />
benefits<br />
167,800 person-years <strong>of</strong> employment<br />
<strong>the</strong> <strong>in</strong>dustry sp<strong>in</strong><strong>of</strong>f <strong>in</strong>direct and <strong>in</strong>duced effects<br />
essentially double <strong>the</strong> direct impacts<br />
<strong>in</strong>direct and <strong>in</strong>duced employment generally<br />
is lower pay<strong>in</strong>g than direct ocean <strong>in</strong>dustry<br />
employment<br />
<strong>the</strong> above total ocean sector impacts comprise<br />
7-8% <strong>of</strong> <strong>the</strong> total B.C. economy<br />
<strong>the</strong>re are substantial opportunities for all private<br />
sector components <strong>of</strong> <strong>the</strong> B.C. ocean economy<br />
to grow. The most promis<strong>in</strong>g sectors for future<br />
growth are: high technology, ocean recreation,<br />
and ports & shipp<strong>in</strong>g<br />
4. Potential Energy <strong>Sector</strong>s<br />
h federal and prov<strong>in</strong>cial policy moratoria<br />
prohibit<strong>in</strong>g <strong>of</strong>fshore oil & gas exploration and<br />
development <strong>in</strong> B.C. rema<strong>in</strong> <strong>in</strong> place, and <strong>the</strong>re<br />
are significant regulatory uncerta<strong>in</strong>ties associated<br />
with potential development <strong>of</strong> <strong>of</strong>fshore energy<br />
resources, as well as uncerta<strong>in</strong>ties about <strong>the</strong><br />
size <strong>of</strong> <strong>the</strong> oil and gas resources. Based on an<br />
estimated 1.6 billion barrels <strong>of</strong> oil and 6.1 tcf <strong>of</strong><br />
gas that appear economic to extract <strong>in</strong> <strong>the</strong> Queen<br />
Charlotte Bas<strong>in</strong>, <strong>the</strong> value <strong>of</strong> potential production<br />
is $129 billion CDN over <strong>the</strong> project life (at prices
h<br />
h<br />
h<br />
<strong>Economic</strong> <strong>Contribution</strong> <strong>of</strong> <strong>the</strong> <strong>Oceans</strong> <strong>Sector</strong> <strong>in</strong> <strong>British</strong> <strong>Columbia</strong> iii<br />
<strong>of</strong> $50 US per barrel for oil and $6 US per mcf for<br />
gas) (Table C)<br />
<strong>the</strong> construction & operation phases <strong>of</strong> oil &<br />
gas projects could result <strong>in</strong> total project lifetime<br />
benefits <strong>of</strong> $137 billion GDP, $14 billion Labour<br />
Income and 269,500 person-years <strong>of</strong> employment<br />
<strong>of</strong>fshore w<strong>in</strong>d resources have substantial<br />
potential to generate electricity (Table C). About<br />
1,500 MW <strong>of</strong> w<strong>in</strong>d generat<strong>in</strong>g capacity could be<br />
developed, result<strong>in</strong>g <strong>in</strong> project lifetime benefits<br />
<strong>of</strong> an estimated $13 billion GDP, $2 billion Labour<br />
Income and 42,600 person-years <strong>of</strong> employment<br />
<strong>the</strong>re is also significant potential to harness <strong>the</strong><br />
immense energy embodied <strong>in</strong> <strong>the</strong> ocean’s waves,<br />
tides, and currents, but a quantitative assessment<br />
<strong>of</strong> <strong>the</strong> potential economic impacts associated<br />
with tidal and wave energy <strong>in</strong> B.C. is not possible<br />
at this time<br />
5. Conclusions<br />
h <strong>the</strong> ocean-based economy <strong>of</strong> B.C.<br />
is much larger than previously estimated<br />
is more broad, diversified than previously<br />
thought<br />
is not well-understood<br />
h <strong>the</strong> components <strong>of</strong> <strong>the</strong> ocean sector <strong>in</strong> total<br />
comprise 7-8% <strong>of</strong> <strong>the</strong> B.C. economy<br />
h <strong>the</strong>re is substantial potential for growth, both<br />
from exist<strong>in</strong>g sectors and also from new, potential<br />
energy sectors<br />
h this study implemented substantial<br />
improvements <strong>in</strong> sector coverage and<br />
procedures, never<strong>the</strong>less fur<strong>the</strong>r methodological<br />
advances are still possible<br />
h <strong>the</strong> F<strong>in</strong>al Report should be distributed to users<br />
to solicit feedback and to marshal support for<br />
a regular report<strong>in</strong>g on <strong>the</strong> B.C.-ocean based<br />
economy
iv<br />
<strong>Economic</strong> <strong>Contribution</strong> <strong>of</strong> <strong>the</strong> <strong>Oceans</strong> <strong>Sector</strong> <strong>in</strong> <strong>British</strong> <strong>Columbia</strong><br />
Table A: B.C. Ocean <strong>Sector</strong> and <strong>the</strong> B.C. Economy<br />
A-1 B.C. Ocean <strong>Sector</strong> Impact Summary 2005<br />
2005 Impacts<br />
Direct Indirect Induced Total<br />
Output $ millions 11,617 NA NA NA<br />
GDP $ millions 5,727 2,896 2,434 11,057<br />
Labour Income $ millions 4,174 1,915 1,461 7,550<br />
Employment PYs 84,430 45,875 37,500 167,805<br />
A-2 Ocean Subsector Shares <strong>of</strong> Total B.C. Impacts 2005<br />
2005 Industry Shares <strong>of</strong> Total Impacts<br />
GDP Labour Income Employment<br />
Private <strong>Sector</strong> - Seafood .12 .11 .13<br />
- Forestry .02 .02 .02<br />
- Ship & Boat Build<strong>in</strong>g .03 .03 .03<br />
- Ocean Construction .02 .02 .02<br />
- Ocean High Tech .09 .09 .08<br />
- Ocean Recreation .33 .31 .36<br />
- Ocean Transport .29 .30 .28<br />
Public <strong>Sector</strong> - Federal Government .08 .10 .07<br />
- Prov<strong>in</strong>cial Government .01 .01 .01<br />
Non-Government <strong>Sector</strong> - Universities & Research .01 .01
<strong>Economic</strong> <strong>Contribution</strong> <strong>of</strong> <strong>the</strong> <strong>Oceans</strong> <strong>Sector</strong> <strong>in</strong> <strong>British</strong> <strong>Columbia</strong> v<br />
Table B: B.C. Ocean <strong>Sector</strong> Impact Summary<br />
2002 2003 2004 2005<br />
Output GDP LI EM Output GDP LI EM Output GDP LI EM Output GDP LI EM<br />
DIRECT IMPACTS<br />
Private <strong>Sector</strong><br />
Seafood 1,310 750 450 12,970 1,300 745 445 12,600 1,290 740 445 12,300 1,380 790 475 12,900<br />
Forestry 269 100 60 960 256 90 58 930 308 118 59 910 283 108 60 910<br />
Ship & Boat Bldg 378 165 131 2,520 422 186 148 2,740 380 168 134 2,410 398 175 139 2,490<br />
Mar<strong>in</strong>e Construction 110 47 35 720 117 50 37 750 161 69 52 990 216 93 69 1,330<br />
Ocean High Tech 925 465 300 5,010 995 500 320 5,280 1,050 530 340 5,450 1,125 565 365 5,730<br />
Ocean Recreation 3,351 1,610 1,080 28,500 3,397 1,630 1,100 28,800 3,610 1,740 1,170 30,100 3,791 1,820 1,220 32,200<br />
Ocean Transport 2,930 1,330 1,040 19,400 3,050 1,380 1,080 19,800 3,190 1,450 1,130 20,200 3,330 1,510 1,180 20,700<br />
Subtotal 9,273 4,467 3,096 70,080 9,537 4,581 3,188 70,900 9,989 4,815 3,330 72,360 10,523 5,061 3,508 76,260<br />
Public <strong>Sector</strong><br />
Federal Gov’t 772 530 530 6,870 760 535 535 6,880 819 555 555 6,770 854 580 580 7,010<br />
Prov<strong>in</strong>cial Gov’t 103 20 20 300 141 25 25 350 151 31 31 430 153 32 32 430<br />
Subtotal 875 550 550 7,170 901 560 560 7,230 970 586 586 7,200 1,007 612 612 7,440<br />
Non-Government <strong>Sector</strong><br />
Universities & Research 41 27 27 275 48 31 31 310 52 34 34 330 60 39 39 370<br />
ENGOs 20 11 11 290 24 13 13 340 26 15 15 360 27 15 15 360<br />
Subtotal 61 38 38 565 72 44 44 650 78 49 49 690 87 54 54 730<br />
TOTAL 10,209 5,055 3,684 77,815 10,510 5,185 3,792 78,780 11,037 5,450 3,965 80,250 11,617 5,727 4,174 84,430<br />
2002 2003 2004 2005<br />
GDP LI EM GDP LI EM GDP LI EM GDP LI EM<br />
INDIRECT IMPACTS<br />
Private <strong>Sector</strong><br />
Seafood 240 170 4,680 230 170 4,550 230 170 4,430 250 180 4,640<br />
Forestry 97 67 1,290 92 64 1,200 111 77 1,420 102 71 1,280<br />
Ship & Boat Bldg 85 41 970 98 47 1,080 89 42 960 92 44 980<br />
Mar<strong>in</strong>e Construction 34 22 560 36 23 590 50 32 790 67 43 1,040<br />
Ocean High Tech 220 140 3,720 240 150 3,940 255 160 4,100 275 170 4,300<br />
Ocean Recreation 920 580 14,600 930 580 14,700 980 620 15,700 1,030 650 16,500<br />
Ocean Transport 850 590 14,100 880 610 14,400 920 640 14,700 960 670 15,100<br />
Subtotal<br />
Public <strong>Sector</strong><br />
2,446 1,610 39,920 2,506 1,644 40,460 2,635 1,741 42,100 2,776 1,828 43,840<br />
Federal Gov’t 85 64 1,570 84 63 1,540 91 68 1,640 96 72 1,680<br />
Prov<strong>in</strong>cial Gov’t 4 3 75 5 4 90 7 4 110 7 5 110<br />
Subtotal<br />
Non-Government <strong>Sector</strong><br />
89 67 1,645 89 67 1,630 98 72 1,750 103 77 1,790<br />
Universities & Research 6 3 85 7 4 95 8 4 100 9 5 115<br />
ENGOs 6 4 100 7 5 120 8 5 125 8 5 130<br />
Subtotal 12 7 185 14 9 215 16 9 225 17 10 245<br />
TOTAL 2,547 1,684 41,750 2,609 1,720 42,305 2,749 1,822 44,075 2,896 1,915 45,875
vi<br />
<strong>Economic</strong> <strong>Contribution</strong> <strong>of</strong> <strong>the</strong> <strong>Oceans</strong> <strong>Sector</strong> <strong>in</strong> <strong>British</strong> <strong>Columbia</strong><br />
2002 2003 2004 2005<br />
GDP LI EM GDP LI EM GDP LI EM GDP LI EM<br />
INDUCED IMPACTS<br />
Private <strong>Sector</strong><br />
Seafood 250 150 4,050 250 150 3,940 250 150 3,860 260 160 4,030<br />
Forestry 51 30 810 49 29 780 54 33 850 52 31 840<br />
Ship & Boat Bldg 69 41 1,120 78 47 1,250 70 42 1,100 73 44 1,130<br />
Mar<strong>in</strong>e Construction 23 14 370 24 14 380 34 20 530 45 27 690<br />
Ocean High Tech 175 105 2,870 190 110 3,010 200 120 3,140 215 130 3,290<br />
Ocean Recreation 660 400 10,800 670 400 10,800 710 430 11,200 750 450 11,500<br />
Ocean Transport 650 390 10,600 680 410 10,800 710 420 11,100 740 440 11,400<br />
Subtotal<br />
Public <strong>Sector</strong><br />
1,878 1,130 30,620 1,941 1,160 30,960 2,028 1,215 31,780 2,135 1,282 32,880<br />
Federal Gov’t 240 145 3,880 240 145 3,830 250 150 3,910 260 155 4,010<br />
Prov<strong>in</strong>cial Gov’t 9 6 150 11 7 180 14 8 220 14 9 220<br />
Subtotal<br />
Non-Government <strong>Sector</strong><br />
249 151 4,030 251 152 4,010 264 158 4,130 274 164 4,230<br />
Universities & Research 12 7 190 14 8 220 15 9 235 17 10 270<br />
ENGOs 6 4 100 7 4 120 8 5 130 8 5 120<br />
Subtotal 18 11 290 21 12 340 23 14 365 25 15 390<br />
TOTAL 2,145 1,292 34,940 2,213 1,324 35,310 2,315 1,387 36,275 2,434 1,461 37,500<br />
2002 2003 2004 2005<br />
GDP LI EM GDP LI EM GDP LI EM GDP LI EM<br />
TOTAL IMPACTS<br />
Private <strong>Sector</strong><br />
Seafood 1,240 770 21,700 1,225 765 21,090 1,220 765 20,590 1,300 815 21,570<br />
Forestry 248 157 3,060 231 151 2,910 283 169 3,180 262 162 3,030<br />
Ship & Boat Bldg 319 213 4,610 362 242 5,070 327 218 4,470 340 227 4,600<br />
Mar<strong>in</strong>e Construction 104 71 1,650 110 74 1,720 153 104 2,310 205 139 3,060<br />
Ocean High Tech 860 545 11,600 930 580 12,230 985 620 12,690 1,055 665 13,320<br />
Ocean Recreation 3,190 2,060 53,900 3,230 2,080 54,300 3,430 2,220 57,000 3,600 2,320 60,200<br />
Ocean Transport 2,830 2,020 44,100 2,940 2,100 45,000 3,080 2,190 46,000 3,210 2,290 47,200<br />
Subtotal<br />
Public <strong>Sector</strong><br />
8,791 5,836 140,620 9,028 5,992 142,320 9,478 6,286 146,240 9,972 6,618 152,980<br />
Federal Gov’t 855 739 12,320 859 743 12,250 896 773 12,320 936 807 12,700<br />
Prov<strong>in</strong>cial Gov’t 33 29 525 41 36 620 52 43 760 53 46 760<br />
Subtotal<br />
Non-Government <strong>Sector</strong><br />
888 768 12,845 900 779 12,870 948 816 13,080 989 853 13,460<br />
Universities & Research 45 37 550 52 43 625 57 47 665 65 54 755<br />
ENGOs 23 19 490 27 22 580 31 25 615 31 25 610<br />
Subtotal 68 56 1,040 79 65 1,205 88 72 1,280 96 79 1,365<br />
TOTAL 9,747 6,660 154,505 10,007 6,836 156,395 10,514 7,174 160,600 11,057 7,550 167,805<br />
Source: Sections 3 and 4 Ma<strong>in</strong> Report.<br />
Legend: Output - Gross Output/Revenues/Expenditures ($ millions).<br />
GDP - Gross Domestic Product ($ millions).<br />
LI - Labour Income ($ millions).<br />
EM - Employment (Person-Years).
<strong>Economic</strong> <strong>Contribution</strong> <strong>of</strong> <strong>the</strong> <strong>Oceans</strong> <strong>Sector</strong> <strong>in</strong> <strong>British</strong> <strong>Columbia</strong> vii<br />
Table C: Illustrative Potential Energy Scenarios<br />
A. Oil Scenario - 1.615 billion bbls oil at $50 US/bbl (5% quality adjustment) worth an estimated $90.2 billion CDN<br />
Total Project Annual Impactsa Direct<br />
Indirect &<br />
Induced<br />
Total Direct<br />
Indirect &<br />
Induced<br />
Total<br />
GDP $ millions CDN 84,520 10,310 94,830 3,520 430 3,950<br />
Labour Income $ millions CDN 3,470 5,320 8,790 145 220 365<br />
Employment PYs 52,300 114,800 167,100 2,180 4,780 6,960<br />
a Total construction and operation impacts divided by 24 year construction and operation phase<br />
B. Gas Scenario - 6.06 tcf gas at $6 US/mcf (10% losses) worth an estimated $38.5 billion CDN<br />
Total Project Annual Impactsa Direct<br />
Indirect &<br />
Induced<br />
Total Direct<br />
Indirect &<br />
Induced<br />
Total<br />
GDP $ millions CDN 36,260 5,880 42,140 1,170 190 1,360<br />
Labour Income $ millions CDN 2,350 3,070 5,420 75 100 175<br />
Employment PYs 35,600 66,800 102,400 1,150 2,150 3,300<br />
a Total construction and operation impacts divided by 31 year construction and operation phase<br />
C. W<strong>in</strong>d Energy Scenario - 1,500 MW development at $100/Mwh worth an estimated $10.5 billion CDN<br />
Total Project Annual Impactsa Direct<br />
Indirect &<br />
Induced<br />
Total Direct<br />
Indirect &<br />
Induced<br />
Total<br />
GDP $ millions CDN 10,090 2,500 12,590 480 120 600<br />
Labour Income $ millions CDN 940 1,340 2,280 45 65 110<br />
Employment PYs 13,600 29,000 42,600 650 1,380 2,030<br />
a Total construction and operation impacts divided by 21 year construction and operation phase (40% capacity factor)<br />
Note: 1. all f<strong>in</strong>ancial figures given <strong>in</strong> undiscounted 2006 dollars<br />
2. $1 CDN = $0.85 US
viii<br />
<strong>Economic</strong> <strong>Contribution</strong> <strong>of</strong> <strong>the</strong> <strong>Oceans</strong> <strong>Sector</strong> <strong>in</strong> <strong>British</strong> <strong>Columbia</strong><br />
Acronyms<br />
ACOA Atlantic Canada Opportunities Agency<br />
bbl barrel<br />
B.C. <strong>British</strong> <strong>Columbia</strong><br />
bcf billion cubic feet<br />
BCIT B.C. Institute <strong>of</strong> Technology<br />
CFIA Canadian Food Inspection Agency<br />
CTC Canadian Tourism Commission<br />
COINPacific Cooperative Ocean Information Network Pacific<br />
CTSA Canadian Transportation Satellite Account<br />
DFO Canada Department <strong>of</strong> Fisheries & <strong>Oceans</strong><br />
DND Department <strong>of</strong> National Defence<br />
EBITDA Earn<strong>in</strong>gs Before Interest, Taxes, Depreciation and Amortization<br />
EC Environment Canada<br />
EI Employment Insurance<br />
EMPR B.C. M<strong>in</strong>istry Energy, M<strong>in</strong>es & Petroleum Resources<br />
ENGO Environmental Non-Government Organization<br />
FTE Full Time Equivalent<br />
GDP Gross Domestic Product<br />
GST Goods & Services Tax (a federal consumption tax)<br />
Gwh gigawatt-hour<br />
HRDC Human Resources Development Canada (now Service Canada)<br />
IOS Institute <strong>of</strong> Ocean Sciences (an arm <strong>of</strong> DFO)<br />
ILMB Integrated Land Management Branch (an arm <strong>of</strong> MAL)<br />
LNG Liquefied Natural Gas<br />
LI Labour Income (wages, salaries & supplementary labour <strong>in</strong>come)<br />
MAL B.C. M<strong>in</strong>istry <strong>of</strong> Agriculture & Lands<br />
mcf thousand cubic feet<br />
MED B.C. M<strong>in</strong>istry <strong>of</strong> <strong>Economic</strong> Development<br />
mmcf million cubic feet<br />
MOE B.C. M<strong>in</strong>istry <strong>of</strong> Environment<br />
MOT B.C. M<strong>in</strong>istry <strong>of</strong> Transportation<br />
MPA Mar<strong>in</strong>e Protected Area<br />
MTSA B.C. M<strong>in</strong>istry <strong>of</strong> Tourism, Sport and <strong>the</strong> Arts<br />
MW megawatt<br />
Mwh megawatt-hour<br />
NAICS North American Industry Classification System<br />
NEPTUNE North-East Pacific Time Series Undersea Networked Experiments
<strong>Economic</strong> <strong>Contribution</strong> <strong>of</strong> <strong>the</strong> <strong>Oceans</strong> <strong>Sector</strong> <strong>in</strong> <strong>British</strong> <strong>Columbia</strong> ix<br />
NRCan Natural Resources Canada<br />
NSERC National Science and Eng<strong>in</strong>eer<strong>in</strong>g Research Council <strong>of</strong> Canada<br />
OREG Ocean Renewable Energy Group<br />
PBS Pacific Biological Station (an arm <strong>of</strong> DFO)<br />
PC Parks Canada<br />
PEI Pr<strong>in</strong>ce Edward Island<br />
PST Prov<strong>in</strong>cial Services Tax (a prov<strong>in</strong>cial consumption tax)<br />
PY Person Year<br />
QCB Queen Charlotte Bas<strong>in</strong><br />
ROPOS Remotely Operated Platform for Ocean Science<br />
SFU Simon Fraser University<br />
SLI Supplementary Labour Income i.e. employer paid benefits<br />
SSHRC Social Sciences and Humanities Research Council <strong>of</strong> Canada<br />
Stats Can Statistics Canada<br />
SWOT Strengths, Weaknesses, Opportunities, Threats<br />
TC Transport Canada<br />
tcf trillion cubic feet<br />
TSA Tourism Satellite Account<br />
UB.C. University <strong>of</strong> <strong>British</strong> <strong>Columbia</strong><br />
UVic University <strong>of</strong> Victoria<br />
VENUS Victoria Experimental Network Under Sea<br />
WCVI West Coast Vancouver Island<br />
WD Western <strong>Economic</strong> Diversification<br />
WUP Water Use Plan
x<br />
<strong>Economic</strong> <strong>Contribution</strong> <strong>of</strong> <strong>the</strong> <strong>Oceans</strong> <strong>Sector</strong> <strong>in</strong> <strong>British</strong> <strong>Columbia</strong><br />
Contents<br />
PREfACE _________________________________________________________________________________ I<br />
SuMMARy ________________________________________________________________________________ I<br />
1. Introduction .....................................................................................i<br />
2. Approach and Methodology .....................................................................i<br />
3. Results for Exist<strong>in</strong>g Industries....................................................................ii<br />
4. Potential Energy <strong>Sector</strong>s.........................................................................ii<br />
5. Conclusions.....................................................................................iii<br />
ACROnyMS ____________________________________________________________________________ vIII<br />
TABlE Of COnTEnTS _____________________________________________________________________ Ix<br />
Appendices .........................................................................................x<br />
List <strong>of</strong> Map, Figures and Tables .......................................................................x<br />
1.0 InTROduCTIOn _____________________________________________________________________ 1<br />
1.1 Study Objectives ................................................................................1<br />
1.2 Regional Resolution .............................................................................3<br />
1.3 Information Sources.............................................................................3<br />
1.4 Report Outl<strong>in</strong>e ..................................................................................3<br />
2.0 APPROACh & METhOdOlOGy ________________________________________________________ 5<br />
2.1 Previous Work...................................................................................5<br />
2.2 Pr<strong>in</strong>ciples for Analysis ...........................................................................7<br />
2.3 The Ocean Economy <strong>of</strong> B.C. - Def<strong>in</strong>ition & <strong>Sector</strong> Coverage .......................................7<br />
2.4 <strong>Economic</strong> Indicators ............................................................................9<br />
2.5 <strong>Economic</strong> Multipliers ............................................................................9<br />
3.0 ThE B.C. OCEAn ECOnOMy - PRIvATE SECTORS ________________________________________ 10<br />
3.1 Seafood <strong>Sector</strong>.................................................................................10<br />
3.2 Forestry........................................................................................12<br />
3.3 Ship & Boat Build<strong>in</strong>g ...........................................................................15<br />
3.4 Ocean Construction ............................................................................16<br />
3.5 High Tech Manufactur<strong>in</strong>g & Services ............................................................17<br />
3.6 Ocean-Based Leisure/Recreation................................................................19<br />
3.7 Ocean Transport ...............................................................................22<br />
3.8 O<strong>the</strong>r Ocean <strong>Sector</strong>s ...........................................................................25<br />
4.0 ThE B.C. OCEAn ECOnOMy – PuBlIC & nOn-GOvERnMEnT SECTORS ____________________ 26<br />
4.1 Federal Government ...........................................................................26<br />
4.2 Prov<strong>in</strong>cial Government .........................................................................28<br />
4.3 University and Research Institutions ............................................................29<br />
4.4 Environmental Organizations...................................................................32<br />
5.0 TOTAl OCEAn SECTOR IMPACTS TOdAy And In ThE fuTuRE ____________________________ 35<br />
5.1 Direct and Total Ocean <strong>Sector</strong> Impacts ..........................................................35<br />
5.2 Growth Potential ...............................................................................36
<strong>Economic</strong> <strong>Contribution</strong> <strong>of</strong> <strong>the</strong> <strong>Oceans</strong> <strong>Sector</strong> <strong>in</strong> <strong>British</strong> <strong>Columbia</strong> xi<br />
6.0 POTEnTIAl EnERGy SECTORS & ThEIR ESTIMATEd IMPACTS ____________________________ 39<br />
6.1 Offshore Oil & Gas..............................................................................39<br />
6.2 Offshore W<strong>in</strong>d Energy ..........................................................................42<br />
6.3 Tidal and Wave Energy .........................................................................43<br />
7.0 COnCluSIOnS _____________________________________________________________________ 44<br />
BIBlIOGRAPhy _________________________________________________________________________ 45<br />
APPEndICES<br />
Appendix A: 2001 Census Employment <strong>in</strong> B.C. .............................................................49<br />
Appendix B: Background - Seafood........................................................................52<br />
Appendix C: Background - Forestry........................................................................54<br />
Appendix D: Background - Ship & Boat Build<strong>in</strong>g ...........................................................56<br />
Appendix E: Background - Mar<strong>in</strong>e Construction............................................................57<br />
Appendix F: Background - Ocean High Tech ...............................................................58<br />
Appendix G: Background - Ocean Recreation ..............................................................60<br />
Appendix H: Background – Ocean Transport...............................................................65<br />
Appendix I: Background - Federal Government ............................................................68<br />
Appendix J: Background - Prov<strong>in</strong>cial Government .........................................................71<br />
Appendix K: Background - Potential Offshore Oil & Gas ....................................................73<br />
Appendix L: Background - Potential Offshore W<strong>in</strong>d Farms ..................................................76<br />
Appendix M: <strong>Economic</strong> Impact Multipliers.................................................................77<br />
lIST Of MAP, fIGuRES And TABlES<br />
MAP <strong>of</strong> B.C. Coastl<strong>in</strong>e ......................................................................................2<br />
Figure 1: B.C. Seafood <strong>Sector</strong> Pr<strong>of</strong>ile .......................................................................11<br />
Figure 2: B.C. Ocean Recreation <strong>Sector</strong> Pr<strong>of</strong>ile..............................................................20<br />
Figure 3: B.C. Ocean Transport Volumes and Revenues .....................................................23<br />
Figure 4: B.C. Ocean <strong>Sector</strong> and <strong>the</strong> B.C. Economy..........................................................35<br />
Table 1: RASCL Estimates <strong>of</strong> Mar<strong>in</strong>e <strong>Contribution</strong> to Canadian Economy 2000................................6<br />
Table 2: B.C. Ocean <strong>Sector</strong>s for Analysis .....................................................................8<br />
Table 3: B.C. Seafood <strong>Sector</strong> <strong>Economic</strong> Impacts ............................................................13<br />
Table 4: B.C. Forest <strong>Sector</strong> <strong>Economic</strong> Impacts - Ocean Component..........................................14<br />
Table 5: B.C. Ocean-Related Ship Build<strong>in</strong>g & Boat Build<strong>in</strong>g <strong>Economic</strong> Impacts ...............................16<br />
Table 6: B.C. Ocean Construction <strong>Economic</strong> Impacts .......................................................17<br />
Table 7: B.C. Ocean High Tech Manufactur<strong>in</strong>g & Services <strong>Economic</strong> Impacts.................................19<br />
Table 8: B.C. Ocean-Related Recreation <strong>Economic</strong> Impacts .................................................22<br />
Table 9: B.C. Ocean Transport <strong>Economic</strong> Impacts ...........................................................24<br />
Table 10: Federal Government Ocean-Related Expenditures <strong>in</strong> B.C. .........................................27<br />
Table 11: Federal Government Ocean-Related <strong>Economic</strong> Impacts...........................................27
xii<br />
<strong>Economic</strong> <strong>Contribution</strong> <strong>of</strong> <strong>the</strong> <strong>Oceans</strong> <strong>Sector</strong> <strong>in</strong> <strong>British</strong> <strong>Columbia</strong><br />
Table 12: B.C. Prov<strong>in</strong>cial Government Ocean <strong>Sector</strong> Expenditures...........................................29<br />
Table 13: Prov<strong>in</strong>cial Government Ocean-Related <strong>Economic</strong> Impacts ........................................30<br />
Table 14: B.C. Academic and Research Institution Ocean <strong>Sector</strong> Expenditures ...............................31<br />
Table 15: B.C. Academic/Research Ocean-Related <strong>Economic</strong> Impacts .......................................31<br />
Table 16: ENGO Ocean-Related Expenditures & Activities <strong>in</strong> B.C. ............................................33<br />
Table 17: B.C. ENGO Ocean-Related <strong>Economic</strong> Impacts .....................................................33<br />
Table 18: B.C. Ocean <strong>Sector</strong> Impact Summary ..............................................................37<br />
Table 18: B.C. Ocean <strong>Sector</strong> Impact Summary (cont<strong>in</strong>ued)..................................................38<br />
Table 19: B.C. Illustrative Offshore Oil & Gas <strong>Economic</strong> Impacts .............................................39<br />
Table 20: Lifetime and Annual Impacts for Oil & Gas Development .........................................41<br />
Table 21: B.C. Illustrative W<strong>in</strong>d Energy <strong>Economic</strong> Impacts...................................................42
<strong>Economic</strong> <strong>Contribution</strong> <strong>of</strong> <strong>the</strong> <strong>Oceans</strong> <strong>Sector</strong> <strong>in</strong> <strong>British</strong> <strong>Columbia</strong> 1<br />
1.0 Introduction<br />
The ocean environment <strong>of</strong> <strong>British</strong> <strong>Columbia</strong> <strong>in</strong>cludes<br />
some 29,000 km <strong>of</strong> coastl<strong>in</strong>e, 6,500 islands, and<br />
450,000 sq km <strong>of</strong> <strong>in</strong>ternal and <strong>of</strong>fshore waters. The<br />
ocean is <strong>in</strong>tegral not just to <strong>the</strong> economy, but also to<br />
our culture, way <strong>of</strong> life, and collective identity as well<br />
as to <strong>the</strong> natural ecosystems <strong>of</strong> which we are a part.<br />
The <strong>in</strong>fluence <strong>of</strong> <strong>the</strong> Pacific Ocean on <strong>the</strong> lives and<br />
livelihoods <strong>of</strong> <strong>British</strong> <strong>Columbia</strong>ns has been pr<strong>of</strong>ound.<br />
The early settlement patterns <strong>of</strong> First Nations and<br />
Europeans alike were guided by proximity to <strong>the</strong><br />
ocean and its tributary waterways. Even today, threequarters<br />
<strong>of</strong> <strong>British</strong> <strong>Columbia</strong>’s population lives with<strong>in</strong><br />
200 kilometres <strong>of</strong> <strong>the</strong> Coast.<br />
The prov<strong>in</strong>ce’s first market economies were built<br />
around ocean-related resource <strong>in</strong>dustries, such as<br />
ship build<strong>in</strong>g, fish<strong>in</strong>g, and coastal logg<strong>in</strong>g. Over <strong>the</strong><br />
years, <strong>the</strong> growth <strong>of</strong> export-oriented sectors from<br />
m<strong>in</strong><strong>in</strong>g and forest products to agricultural goods<br />
and petroleum production depended on ocean<br />
transportation for access to markets. Now <strong>in</strong> <strong>the</strong> 21st<br />
Century, emerg<strong>in</strong>g <strong>in</strong>dustries like ocean tourism and<br />
mar<strong>in</strong>e technology development are help<strong>in</strong>g to drive<br />
<strong>the</strong> economy.<br />
There are tremendous economic opportunities<br />
<strong>in</strong> B.C.’s coastal and <strong>of</strong>fshore waters rang<strong>in</strong>g from<br />
recreation and tourism to fisheries and aquaculture<br />
development to ocean research and energy<br />
production. At <strong>the</strong> same time, <strong>the</strong> ocean environment<br />
faces formidable challenges, notably from ocean and<br />
land-based pollution, global climate change, and <strong>the</strong><br />
result<strong>in</strong>g threats to mar<strong>in</strong>e species. These challenges<br />
and opportunities are <strong>of</strong> concern to all <strong>British</strong><br />
<strong>Columbia</strong>ns and Canadians.<br />
Under Canada’s 1997 <strong>Oceans</strong> Act and subsequent<br />
Memorandum <strong>of</strong> Understand<strong>in</strong>gs (MOUs), <strong>the</strong><br />
responsibility for plann<strong>in</strong>g and manag<strong>in</strong>g ocean<br />
activities lies with both <strong>the</strong> federal and prov<strong>in</strong>cial<br />
governments - <strong>the</strong> Federal Department <strong>of</strong> Fisheries<br />
and <strong>Oceans</strong> has lead responsibility. The B.C.<br />
M<strong>in</strong>istry <strong>of</strong> Environment (MOE) co-chairs an <strong>Oceans</strong><br />
Coord<strong>in</strong>at<strong>in</strong>g Committee (OCC) with <strong>the</strong> federal<br />
Department <strong>of</strong> Fisheries and <strong>Oceans</strong> (DFO). In<br />
order to meet <strong>the</strong>ir jo<strong>in</strong>t responsibilities, MOE and<br />
DFO have a critical <strong>in</strong>terest <strong>in</strong> understand<strong>in</strong>g <strong>the</strong><br />
contribution that <strong>the</strong> ocean sector makes to <strong>the</strong> B.C.<br />
economy.<br />
To date, <strong>the</strong> ris<strong>in</strong>g <strong>in</strong>terest <strong>in</strong> <strong>the</strong> ocean and its<br />
economic role has not been matched by support<strong>in</strong>g<br />
<strong>in</strong>formation and analysis. The oceans sector is not<br />
well-represented by conventional statistics. This study<br />
is a first step <strong>in</strong> fill<strong>in</strong>g <strong>the</strong> data gaps to help all levels<br />
<strong>of</strong> government, First Nations, key stakeholders, and<br />
<strong>the</strong> public at large to better comprehend <strong>the</strong> ocean’s<br />
economic significance.<br />
1.1 Study Objectives<br />
The <strong>in</strong>tent <strong>of</strong> this study is to:<br />
h def<strong>in</strong>e, describe, and quantify <strong>the</strong> various market<br />
(commercial) activities that comprise B.C.’s ocean<br />
sector<br />
h estimate <strong>in</strong> a consistent manner <strong>the</strong> direct,<br />
<strong>in</strong>direct, and <strong>in</strong>duced impacts <strong>of</strong> <strong>the</strong>se<br />
commercial activities to <strong>the</strong> B.C. economy<br />
h<br />
assess <strong>the</strong> growth potential <strong>of</strong> <strong>the</strong> ocean sector
2<br />
<strong>Economic</strong> <strong>Contribution</strong> <strong>of</strong> <strong>the</strong> <strong>Oceans</strong> <strong>Sector</strong> <strong>in</strong> <strong>British</strong> <strong>Columbia</strong><br />
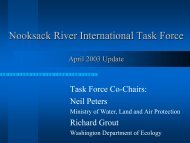
MAP <strong>of</strong> B.C. Coastl<strong>in</strong>e
<strong>Economic</strong> <strong>Contribution</strong> <strong>of</strong> <strong>the</strong> <strong>Oceans</strong> <strong>Sector</strong> <strong>in</strong> <strong>British</strong> <strong>Columbia</strong> 3<br />
An additional task is to illustrate <strong>the</strong> economic<br />
potential <strong>of</strong> some o<strong>the</strong>r ocean sectors, <strong>in</strong> particular<br />
<strong>of</strong>fshore oil and gas development and <strong>of</strong>fshore w<strong>in</strong>d<br />
power generation.<br />
The study does not encompass some key areas <strong>of</strong><br />
valuation, specifically ecosystem values, First Nations<br />
traditional use values, and o<strong>the</strong>r non-market values. It<br />
is recognized that an assessment <strong>of</strong> <strong>the</strong>se o<strong>the</strong>r noncommercial<br />
values is essential to appreciate fully <strong>the</strong><br />
ocean’s economic, social, and environmental value to<br />
B.C. The <strong>Oceans</strong> Coord<strong>in</strong>at<strong>in</strong>g Committee sponsored<br />
a literature and methodological review <strong>of</strong> noncommercial<br />
valuation <strong>of</strong> ocean resources that lays<br />
<strong>the</strong> groundwork for future work <strong>in</strong> this area (Philcox,<br />
2007).<br />
1.2 Regional Resolution<br />
The focus <strong>of</strong> this study is <strong>the</strong> economic contribution<br />
<strong>of</strong> <strong>the</strong> oceans sector to <strong>the</strong> prov<strong>in</strong>ce as a whole. The<br />
study does provide <strong>the</strong> approximate distribution<br />
<strong>of</strong> employment for some subsectors, <strong>in</strong> percentage<br />
terms, for four broad subprov<strong>in</strong>cial regions (see Map):<br />
h <strong>the</strong> North - Haida Gwaii/Queen Charlotte Islands<br />
plus <strong>the</strong> Ma<strong>in</strong>land north <strong>of</strong> Vancouver Island i.e.,<br />
<strong>the</strong> Rivers Inlet - Bella Bella - Bella Coola area plus<br />
<strong>the</strong> Pr<strong>in</strong>ce Rupert and surround<strong>in</strong>g area<br />
h Vancouver Island - all <strong>of</strong> Vancouver Island plus <strong>the</strong><br />
very sparsely populated Ma<strong>in</strong>land along <strong>the</strong> east<br />
side <strong>of</strong> Johnstone Strait<br />
h Lower Ma<strong>in</strong>land - <strong>the</strong> Sunsh<strong>in</strong>e Coast south <strong>of</strong> <strong>the</strong><br />
Powell River area plus Greater Vancouver and <strong>the</strong><br />
Fraser Valley<br />
h o<strong>the</strong>r - <strong>the</strong> rema<strong>in</strong>der <strong>of</strong> <strong>the</strong> Prov<strong>in</strong>ce i.e., <strong>the</strong><br />
Interior<br />
The estimation <strong>of</strong> <strong>the</strong> economic contribution <strong>of</strong> <strong>the</strong><br />
oceans sector, at a f<strong>in</strong>e regional level, on par with<br />
prov<strong>in</strong>cial estimates is a formidable task. Such an<br />
exercise would <strong>in</strong>volve an effort level an order <strong>of</strong><br />
magnitude greater than allocated for this study.<br />
1.3 Information Sources<br />
To conduct an economic study <strong>of</strong> this k<strong>in</strong>d is<br />
daunt<strong>in</strong>g s<strong>in</strong>ce <strong>of</strong>ficial government statistics and<br />
<strong>in</strong>dustry classification systems do not def<strong>in</strong>e ocean<br />
<strong>in</strong>dustries as a dist<strong>in</strong>ct category. As a result, it is<br />
necessary to designate which <strong>in</strong>dustry sectors, <strong>in</strong><br />
whole or <strong>in</strong> part, comprise ocean-related <strong>in</strong>dustries<br />
and to estimate <strong>the</strong>ir economic contribution<br />
attributable to <strong>the</strong> ocean. These tasks necessitated a<br />
substantial research program.<br />
The study has <strong>in</strong>volved both primary (<strong>in</strong>terviews and<br />
surveys) and secondary (literature review) research,<br />
<strong>in</strong>clud<strong>in</strong>g:<br />
h <strong>the</strong> review <strong>of</strong> 16 o<strong>the</strong>r mar<strong>in</strong>e sector economic<br />
impact studies<br />
h <strong>the</strong> acquisition and review <strong>of</strong> more than 80 o<strong>the</strong>r<br />
publications, <strong>in</strong>clud<strong>in</strong>g data purchases from BC<br />
Stats and Statistics Canada (see <strong>the</strong> Bibliography)<br />
h an <strong>in</strong>terview program with over 60<br />
representatives from <strong>the</strong> prov<strong>in</strong>cial and federal<br />
governments and <strong>the</strong> private sector<br />
h four targeted special surveys <strong>of</strong> prov<strong>in</strong>cial<br />
and federal agencies, university and research<br />
<strong>in</strong>stitutions, and Environmental Non-Government<br />
Organizations (ENGOs) with respect to <strong>the</strong>ir<br />
ocean-related spend<strong>in</strong>g and activities<br />
The lead consultant also visited and <strong>in</strong>terviewed BC<br />
Stats and Statistics Canada personnel <strong>in</strong> Victoria and<br />
Ottawa, respectively.<br />
1.4 Report Outl<strong>in</strong>e<br />
The next section presents an overview <strong>of</strong> <strong>the</strong> B.C.<br />
ocean economy, its activities and sectors, and <strong>the</strong><br />
approach for measur<strong>in</strong>g <strong>the</strong> economic contribution<br />
<strong>of</strong> each sector. The study results are presented and<br />
summarized <strong>in</strong> <strong>the</strong> rema<strong>in</strong>der <strong>of</strong> <strong>the</strong> report:<br />
Section Subject<br />
2 Approach and Methodology<br />
3 The B.C. Ocean Economy – Private <strong>Sector</strong>s<br />
4 The B.C. Ocean Economy – Public & Non-Government <strong>Sector</strong>s<br />
5 Total Ocean <strong>Sector</strong> Impacts Today and <strong>in</strong> <strong>the</strong> Future<br />
6 Potential <strong>Sector</strong>s and <strong>the</strong>ir Estimated Impacts<br />
7 Conclusions<br />
In addition, several appendices provide supplemental<br />
material.<br />
The terms “ocean” and “mar<strong>in</strong>e” are used<br />
<strong>in</strong>terchangeably <strong>in</strong> <strong>the</strong> report. The term “ocean” <strong>in</strong> this<br />
study refers to <strong>the</strong> subtidal area <strong>of</strong>f coastal B.C. to <strong>the</strong><br />
western outer boundary <strong>of</strong> <strong>the</strong> Canadian Exclusive<br />
<strong>Economic</strong> Zone (EEZ), <strong>the</strong> area extend<strong>in</strong>g 200 nautical<br />
miles seaward from <strong>the</strong> B.C. coast.<br />
Note that all dollar figures are presented <strong>in</strong> nom<strong>in</strong>al<br />
or current dollars unless o<strong>the</strong>rwise stated (and not<br />
constant, <strong>in</strong>flation adjusted dollars). Our research and<br />
discussions with practitioners <strong>in</strong> o<strong>the</strong>r jurisdictions<br />
suggest that nom<strong>in</strong>al dollar impacts are more useful<br />
and more transparent than constant dollar impacts.
4<br />
<strong>Economic</strong> <strong>Contribution</strong> <strong>of</strong> <strong>the</strong> <strong>Oceans</strong> <strong>Sector</strong> <strong>in</strong> <strong>British</strong> <strong>Columbia</strong>
<strong>Economic</strong> <strong>Contribution</strong> <strong>of</strong> <strong>the</strong> <strong>Oceans</strong> <strong>Sector</strong> <strong>in</strong> <strong>British</strong> <strong>Columbia</strong> 5<br />
2.0 Approach & Methodology<br />
Our methodology for assess<strong>in</strong>g <strong>the</strong> economic<br />
dimensions <strong>of</strong> <strong>the</strong> ocean sector <strong>in</strong> Canada draws on<br />
“lessons learned” from previous work <strong>in</strong> and outside<br />
Canada, and on a set <strong>of</strong> underly<strong>in</strong>g pr<strong>in</strong>ciples. These<br />
are identified <strong>in</strong> this section as well as <strong>the</strong> list <strong>of</strong><br />
ocean sectors to be considered for analysis.<br />
2.1 Previous Work<br />
A variety <strong>of</strong> mar<strong>in</strong>e sector economic impact studies<br />
have been completed for specific prov<strong>in</strong>ces with<strong>in</strong><br />
Canada and for specific countries around <strong>the</strong> world.<br />
We reviewed 7 Canadian impact studies (for Canada,<br />
Newfoundland & Labrador, PEI, Nova Scotia, New<br />
Brunswick, Quebec and <strong>the</strong> North), 5 <strong>in</strong>ternational<br />
impact studies (for California and Florida <strong>in</strong> <strong>the</strong> US,<br />
United K<strong>in</strong>gdom, Australia and New Zealand) and<br />
4 methodology studies (DFO Halifax 2002, Colgan<br />
2003, APEC 2004, and GSGislason 2007). Only one<br />
<strong>of</strong> <strong>the</strong>se studies - <strong>the</strong> Roger A. Stacey Consultants<br />
Ltd. (RASCL) 2003 report - addressed Pacific Region<br />
ocean sector impacts, part <strong>of</strong> an analysis <strong>of</strong> national<br />
ocean sector impacts (see Table 1). The RASCL Report<br />
estimated <strong>the</strong> economic contribution <strong>of</strong> <strong>the</strong> B.C.<br />
ocean’s sector as $6.0 billion <strong>in</strong> Gross Output and<br />
$2.8 billion <strong>in</strong> Gross Domestic Product, or 2% <strong>of</strong> <strong>the</strong><br />
prov<strong>in</strong>cial total <strong>in</strong> 2000.<br />
However, several potential improvements to this<br />
<strong>in</strong>itial work, <strong>in</strong> terms <strong>of</strong> methodology and sector<br />
coverage, have been identified (GSGislason 2007).<br />
Many <strong>of</strong> <strong>the</strong>se suggestions have been implemented<br />
<strong>in</strong> this current report. The review <strong>of</strong> previous studies<br />
and our research/<strong>in</strong>terviews suggest <strong>the</strong> follow<strong>in</strong>g<br />
“lessons learned”:<br />
h <strong>the</strong> work to date with<strong>in</strong> and outside Canada<br />
differs significantly e.g., non-Canadian studies<br />
do not address <strong>the</strong> public (government) sector,<br />
Canadian studies treat mar<strong>in</strong>e tourism differently,<br />
<strong>the</strong> <strong>in</strong>clusion <strong>of</strong> universities and research<br />
organizations is sporadic, some studies address<br />
direct effects only whereas o<strong>the</strong>r studies address<br />
direct, <strong>in</strong>direct and <strong>in</strong>duced effects.<br />
h certa<strong>in</strong> sectors seem not to be addressed <strong>in</strong><br />
any <strong>of</strong> <strong>the</strong> studies analyzed e.g., Environmental<br />
Non-Government Organizations (ENGOs),<br />
environmental consult<strong>in</strong>g, subsistence (except for<br />
<strong>the</strong> North <strong>in</strong> Canada).<br />
h f<strong>in</strong>ancial data for <strong>the</strong> shipp<strong>in</strong>g component <strong>of</strong><br />
water transport is difficult to access due to<br />
confidentiality concerns i.e., national and not<br />
prov<strong>in</strong>cial figures are reported by Statistics<br />
Canada.<br />
h <strong>the</strong> tourism <strong>in</strong>dustry is a notoriously difficult<br />
sector to measure <strong>in</strong> all jurisdictions <strong>in</strong> <strong>the</strong> world;<br />
isolat<strong>in</strong>g <strong>the</strong> mar<strong>in</strong>e component adds one more<br />
layer <strong>of</strong> difficulty.<br />
h double count<strong>in</strong>g is an issue i.e., one sector’s<br />
output can be ano<strong>the</strong>r sector’s <strong>in</strong>put (for<br />
example, fish harvest<strong>in</strong>g output is an <strong>in</strong>put to fish<br />
process<strong>in</strong>g).<br />
Analyz<strong>in</strong>g <strong>the</strong> ocean sector <strong>in</strong>volves a considerable<br />
amount <strong>of</strong> pr<strong>of</strong>essional judgement - and approaches<br />
can and should vary across jurisdictions depend<strong>in</strong>g<br />
on <strong>the</strong> importance <strong>of</strong> each sector, data availability<br />
and o<strong>the</strong>r factors. A May 2002 workshop sponsored<br />
by DFO suggested that <strong>the</strong>re was no standard<br />
methodology for measur<strong>in</strong>g <strong>the</strong> economic<br />
contribution <strong>of</strong> <strong>the</strong> ocean sector.
6<br />
<strong>Economic</strong> <strong>Contribution</strong> <strong>of</strong> <strong>the</strong> <strong>Oceans</strong> <strong>Sector</strong> <strong>in</strong> <strong>British</strong> <strong>Columbia</strong><br />
Table 1: RASCL Estimates <strong>of</strong> Ocean <strong>Contribution</strong> to Canadian Economy 2000<br />
Atlantic Canada Pacific Canada Canada<br />
Direct Impacts Gross Output GDP Employment Gross Output GDP Employment Gross Output GDP Employment<br />
$ millions PYs $ millions PYs $ millions PYs<br />
Private <strong>Sector</strong><br />
1. Seafood - Primary Fish<strong>in</strong>g 1,765 1,322 17,500 369 329 3,500 2,134 1,650 21,000<br />
- Aquaculture 281 160 4,530 292 139 2,420 573 299 6,950<br />
- Process<strong>in</strong>g 2,988 896 17,500 476 190 2,660 3,464 1,087 20,160<br />
Subtotal 3,269 2,378 39,530 768 658 8,580 4,037 3,036 48,110<br />
2. Offshore Oil & Gas 5,265 4,721 5,910 0 0 0 5,265 4,721 5,910<br />
3. Ocean Transport -Ports 179 62 1,140 195 86 1,120 374 148 2,260<br />
- Shipp<strong>in</strong>g 705 143 7,460 1,175 238 7,440 1,880 381 14,900<br />
- Ship/Boat Build<strong>in</strong>g 427 224 3,630 392 235 4,370 819 459 8,000<br />
Subtotal 1,311 429 12,230 1,762 559 12,930 3,073 988 25,160<br />
4. Mar<strong>in</strong>e Tourism - Angl<strong>in</strong>g 96 39 980 466 186 4,760 561 225 5,740<br />
- Coastal Tourism 167 67 1,710 221 88 2,260 389 155 3,970<br />
- Cruise Passengers 18 7 190 65 26 660 83 33 850<br />
Subtotal 281 113 2,880 752 300 7,680 1,033 413 10,560<br />
5. Mar<strong>in</strong>e Constn - Build<strong>in</strong>gs 75 36 410 152 73 820 227 109 1,230<br />
- Oil & Gas Rigs 1,678 805 9,110 0 0 0 1,678 805 9,110<br />
- Mar<strong>in</strong>e Works 262 126 1,420 81 39 440 343 165 1,860<br />
Subtotal 2,015 967 10,940 233 112 1,260 2,248 1,079 12,200<br />
6. Ocean Mfg & Services - Comm & Elec Equip 186 110 1,140 67 40 370 253 150 1,510<br />
- Mar<strong>in</strong>e Technology 304 188 2,990 280 174 2,610 584 362 5,600<br />
- Aquaculture 293 156 2,370 482 258 3,730 775 414 6,100<br />
- Pr<strong>of</strong> Services 329 144 3,800 439 194 4,870 768 338 8,670<br />
Subtotal 1,112 598 10,300 1,268 666 11,580 2,380 1,264 21,880<br />
TOTAL Private <strong>Sector</strong><br />
Public <strong>Sector</strong><br />
13,253 9,206 81,790 4,783 2,295 42,030 18,036 11,501 123,820<br />
7. Federal Gov’t - DFO 1,072 415 6,600 357 138 2,200 1,429 553 8,800<br />
- Transport Canada 0 0 0 0 0 0 0 0 0<br />
- DND 1,466 568 10,390 489 189 3,470 1,955 757 13,860<br />
- O<strong>the</strong>r 838 324 3,310 279 108 1,100 1,117 432 4,410<br />
Subtotal 3,376 1,307 20,300 1,125 435 6,770 4,501 1,742 27,070<br />
8. Prov<strong>in</strong>cial Gov’t - Fish & Aquaculture 69 25 400 10 5 50 77 30 450<br />
- Mar<strong>in</strong>e Transport 54 19 430 43 19 150 99 38 580<br />
- Oil & Gas 8 3 50 0 0 0 8 3 50<br />
Subtotal 131 47 880 53 24 200 184 71 1,080<br />
TOTAL Government 3,508 1,354 21,180 1,178 459 6,970 4,685 1,813 28,150<br />
TOTAL Private & Public <strong>Sector</strong>s 16,761 10,560 102,970 5,961 2,754 49,000 22,721 13,314 151,970<br />
Source: RASCL “Canada’s Ocean Industries: <strong>Contribution</strong> to <strong>the</strong> Economy 1988-2000” Prepared for DFO, September 2003.<br />
Note: 1. The Atlantic Region <strong>in</strong>cludes Quebec, DFO expenditures <strong>in</strong>clude Canadian Coast Guard.<br />
2. GDP is GDP at Factor Cost, PYs is person-years, $ are nom<strong>in</strong>al.<br />
3. The Atlantic - Pacific split <strong>of</strong> national totals for government sectors is estimated.
<strong>Economic</strong> <strong>Contribution</strong> <strong>of</strong> <strong>the</strong> <strong>Oceans</strong> <strong>Sector</strong> <strong>in</strong> <strong>British</strong> <strong>Columbia</strong> 7<br />
2.2 Pr<strong>in</strong>ciples for Analysis<br />
Our <strong>in</strong>vestigations suggest five general pr<strong>in</strong>ciples for<br />
measur<strong>in</strong>g <strong>the</strong> economic contribution <strong>of</strong> <strong>the</strong> ocean<br />
sector:<br />
h Pr<strong>in</strong>ciple #1: mar<strong>in</strong>e sector def<strong>in</strong>itions should be<br />
NAICS-based to <strong>the</strong> extent possible (it is realized<br />
that ocean-based recreation will need to be<br />
treated <strong>in</strong> a different manner)<br />
h Pr<strong>in</strong>ciple #2: <strong>the</strong> analysis for subsectors should<br />
use BC Stats/Statistics Canada data and concepts<br />
to <strong>the</strong> extent possible (this confers consistency<br />
with procedures used for measur<strong>in</strong>g <strong>the</strong><br />
economic contribution <strong>of</strong> o<strong>the</strong>r sectors <strong>of</strong> <strong>the</strong><br />
economy)<br />
h Pr<strong>in</strong>ciple #3: it is important to designate a mar<strong>in</strong>e<br />
share <strong>of</strong> relevant NAICS <strong>in</strong>dustries e.g., not all<br />
DFO expenditures are mar<strong>in</strong>e-based, not all boat<br />
build<strong>in</strong>g is mar<strong>in</strong>e-based<br />
h Pr<strong>in</strong>ciple #4: double count<strong>in</strong>g should be avoided<br />
(where one sector’s output is an <strong>in</strong>put to ano<strong>the</strong>r<br />
sector <strong>the</strong> economic activity should be recorded<br />
at <strong>the</strong> po<strong>in</strong>t closest to consumption)<br />
h Pr<strong>in</strong>ciple #5: land-based process<strong>in</strong>g/distribution<br />
<strong>of</strong> mar<strong>in</strong>e resources should be <strong>in</strong>cluded<br />
where <strong>the</strong> resource does not undergo drastic<br />
transformation e.g., seafood process<strong>in</strong>g and<br />
market<strong>in</strong>g should be <strong>in</strong>cluded.<br />
These pr<strong>in</strong>ciples underly our approach to <strong>the</strong> study.<br />
2.3 The Ocean Economy <strong>of</strong> B.C. - def<strong>in</strong>ition &<br />
<strong>Sector</strong> Coverage<br />
def<strong>in</strong>ition. The ocean sector is comprised <strong>of</strong><br />
<strong>the</strong> private <strong>in</strong>dustries, research and education<br />
organizations, and various levels <strong>of</strong> government that<br />
depend on <strong>the</strong> ocean environment as a medium for<br />
transportation, operation, <strong>in</strong>novation, or recreation,<br />
or as a source <strong>of</strong> extractable resources. That is, <strong>the</strong><br />
ocean sector <strong>in</strong>cludes not only fish<strong>in</strong>g and <strong>of</strong>fshore<br />
oil and gas, but also such <strong>in</strong>dustries as ocean<br />
transport, ship build<strong>in</strong>g, and ocean tourism.<br />
The Challenge. Standard <strong>in</strong>dustry classification<br />
systems such as <strong>the</strong> North America Industry<br />
Classification System (NAICS) were designed to group<br />
producers <strong>in</strong>to <strong>in</strong>dustries on <strong>the</strong> basis <strong>of</strong> similarities <strong>in</strong><br />
<strong>the</strong>ir production processes and <strong>the</strong>ir outputs. NAICS<br />
was not designed to measure economic activity <strong>of</strong><br />
<strong>in</strong>dustries with similar use <strong>of</strong> resources such as <strong>the</strong><br />
ocean. Therefore, one has to exam<strong>in</strong>e <strong>the</strong> component<br />
parts <strong>of</strong> <strong>in</strong>dustries and decide whe<strong>the</strong>r <strong>the</strong>y<br />
comprise, <strong>in</strong> whole or <strong>in</strong> part, ocean-related activity.<br />
Industry <strong>Sector</strong>s. Table 2 identifies <strong>the</strong> various<br />
ocean sectors addressed <strong>in</strong> <strong>the</strong> study. The sectors<br />
<strong>in</strong>clude <strong>the</strong> ma<strong>in</strong> sectors addressed <strong>in</strong> o<strong>the</strong>r studies,<br />
and comprise <strong>the</strong> sectors for which we can make<br />
reasonable estimates <strong>of</strong> economic activity. The sector<br />
coverage represents a substantial expansion over<br />
sectors covered <strong>in</strong> <strong>the</strong> orig<strong>in</strong>al RASCL Report (Table<br />
1). This notwithstand<strong>in</strong>g, several sectors such as<br />
ocean high technology and ocean recreation should<br />
be considered works-<strong>in</strong>-progress subject to more<br />
<strong>in</strong>tensive analysis <strong>in</strong> future studies.<br />
years for Analysis. We present estimates for four<br />
years 2002 through 2005. The latter two years should<br />
be considered prelim<strong>in</strong>ary as many Statistics Canada<br />
data series for prov<strong>in</strong>ces, a key underp<strong>in</strong>n<strong>in</strong>g to <strong>the</strong><br />
analysis, presently are only available up to 2003 (<strong>the</strong><br />
National Accounts Division <strong>of</strong> Statistics Canada just<br />
released 2003 Gross Output and Gross Domestic<br />
Product estimates by <strong>in</strong>dustry at <strong>the</strong> prov<strong>in</strong>cial level<br />
<strong>in</strong> November 2006). There is close to a 3 year lag <strong>in</strong><br />
release <strong>of</strong> data.
8<br />
<strong>Economic</strong> <strong>Contribution</strong> <strong>of</strong> <strong>the</strong> <strong>Oceans</strong> <strong>Sector</strong> <strong>in</strong> <strong>British</strong> <strong>Columbia</strong><br />
Table 2: B.C. Ocean <strong>Sector</strong>s for Analysis<br />
Exist<strong>in</strong>g Private <strong>Sector</strong>s Exist<strong>in</strong>g Public <strong>Sector</strong>s<br />
NAICS/<strong>Sector</strong> Data Source for Gross Revenue NAICS/<strong>Sector</strong> Data Source for Gross Revenue<br />
1. Seafood 1. Federal Government<br />
114 Fish<strong>in</strong>g MOE CFIA Survey/Interviews<br />
1125 Aquaculture MOE DFO "<br />
3117 Process<strong>in</strong>g MOE DND "<br />
Market<strong>in</strong>g & Distn Secondary Sources Parks Canada "<br />
Environment Canada "<br />
2. Forestry-Mar<strong>in</strong>e Component Transport Canada "<br />
113 Forestry & Logg<strong>in</strong>g Stats Can/Interviews Service Canada (formerly HRDC) "<br />
321 Wood Mfg " WD "<br />
322 Paper Mfg " NRCan "<br />
NSERC & SSHRC "<br />
3. Mar<strong>in</strong>e Construction o<strong>the</strong>r "<br />
DFO Interviews<br />
DND Interviews 2. Prov<strong>in</strong>cial Government<br />
Port Authorities Annual Reports Agriculture & Lands Survey/Interviews<br />
B.C. Ferries Annual Reports <strong>Economic</strong> Development "<br />
Environment "<br />
4. Ship & Boat Build<strong>in</strong>g Tourism B.C. "<br />
336611 Ship Build<strong>in</strong>g Repair Stats Can Sports, Arts & Culture "<br />
336612 Boat Build<strong>in</strong>g Stats Can EMPR "<br />
Innovation Council "<br />
5. Ocean-Related High Technology Transportation "<br />
Manufactur<strong>in</strong>g BC Stats Satellite BC Hydro "<br />
Services <strong>in</strong>c. Env Consult<strong>in</strong>g " o<strong>the</strong>r "<br />
6. Ocean Recreation Exist<strong>in</strong>g Non-Government <strong>Sector</strong>s<br />
Saltwater Angl<strong>in</strong>g DFO Survey NAICS/<strong>Sector</strong> Data Source for Gross Revenue<br />
Ferries Annual Reports 1. University/R&D Survey/Interviews<br />
Cruise Tourism Secondary Sources 2. Environmental Non-Gov’t Organizations Survey/Interviews<br />
O<strong>the</strong>r BC Stats Satellite<br />
7. Ocean Transport Potential Energy <strong>Sector</strong>s<br />
483115 Shipp<strong>in</strong>g exc. Ferries Secondary Sources NAICS/<strong>Sector</strong> Data Source for Gross Revenue<br />
4883 Services to Water Transport " 1. Offshore Oil & Gas Secondary Sources<br />
Related Services " 2. Offshore W<strong>in</strong>d Energy Secondary Sources<br />
2.4 <strong>Economic</strong> Indicators<br />
The basic <strong>in</strong>formation to pr<strong>of</strong>ile any <strong>in</strong>dustry as a whole, whe<strong>the</strong>r it be forestry, m<strong>in</strong><strong>in</strong>g, tourism, or fish<strong>in</strong>g<br />
<strong>in</strong>cludes - product/activity volumes, sales values, employment, and markets. Without this basic <strong>in</strong>formation<br />
an <strong>in</strong>dustry cannot present its stature and assert its legitimacy to <strong>the</strong> public and to compet<strong>in</strong>g resource users.<br />
One cannot conduct even <strong>the</strong> barest m<strong>in</strong>imum policy analysis without this basic <strong>in</strong>formation. Simply put,<br />
legitimate <strong>in</strong>dustries can describe <strong>the</strong>ir basic economic parameters.<br />
four Ma<strong>in</strong> Indicators. The key <strong>in</strong>dicators for this economic impact analysis <strong>of</strong> <strong>the</strong> contribution <strong>of</strong> <strong>the</strong> B.C.<br />
ocean sector to <strong>the</strong> B.C. economy are:<br />
h Gross Output and/or Revenues<br />
h<br />
Gross Domestic Product (GDP)
<strong>Economic</strong> <strong>Contribution</strong> <strong>of</strong> <strong>the</strong> <strong>Oceans</strong> <strong>Sector</strong> <strong>in</strong> <strong>British</strong> <strong>Columbia</strong> 9<br />
h Labour Income (Wages, Salaries & Supplementary<br />
Labour Income or SLI)<br />
h Employment (measured <strong>in</strong> person-years or PYs)<br />
GDP measures <strong>the</strong> unduplicated value <strong>of</strong> production<br />
as <strong>the</strong> “value added” by producers to <strong>in</strong>termediate<br />
<strong>in</strong>puts <strong>in</strong> generat<strong>in</strong>g output i.e., Gross Output less<br />
Intermediate Purchases <strong>of</strong> Goods & Services. When<br />
measured at basic prices, an <strong>in</strong>dustry’s GDP is <strong>the</strong><br />
sum <strong>of</strong> factor <strong>in</strong>comes - Wages & Salaries, SLI, Mixed<br />
Income (comb<strong>in</strong>ed return to capital & labour <strong>of</strong> <strong>the</strong><br />
self-employed) and operat<strong>in</strong>g surplus - plus <strong>in</strong>direct<br />
taxes less subsidies on capital and labour <strong>in</strong>puts (see<br />
Statistics Canada “Prov<strong>in</strong>cial GDP by Industry and<br />
<strong>Sector</strong>”, Cat. No. 15-209-XCB).<br />
Labour Income is <strong>the</strong> return to labour and is <strong>in</strong>cluded<br />
<strong>in</strong> GDP - Labour Income <strong>in</strong>cludes wages, salaries, and<br />
employer contributions to Employment Insurance,<br />
Canada Pension Plan, private pension plans, health/<br />
dental plans etc. The Operat<strong>in</strong>g Surplus component<br />
<strong>of</strong> GDP is <strong>the</strong> return to capital and <strong>in</strong>cludes pre-tax<br />
pr<strong>of</strong>its, depreciation, and <strong>in</strong>terest paid.<br />
As noted earlier, all dollar figures are expressed <strong>in</strong><br />
nom<strong>in</strong>al dollars.<br />
The Importance <strong>of</strong> <strong>the</strong> Gross Output Measure.<br />
Gross Output drives <strong>the</strong> estimation <strong>of</strong> GDP, Labour<br />
Income and Employment. If one has an estimate <strong>of</strong><br />
sector revenues, <strong>the</strong>n one can apply a GDP, Labour<br />
Income or Employment direct impact multiplier or<br />
ratio to estimate direct impacts. Alternatively, one<br />
could use more sector-specific <strong>in</strong>formation on <strong>the</strong><br />
cost structure <strong>of</strong> <strong>the</strong> <strong>in</strong>dustry <strong>in</strong> question, if available,<br />
to estimate direct impacts.<br />
In some cases BC Stats or Statistics Canada can<br />
provide <strong>the</strong> relevant Gross Output data directly<br />
e.g., Statistics Canada, “Prov<strong>in</strong>cial Gross Output<br />
by Industry and <strong>Sector</strong>”, Cat. No. 15-210-XCB. In<br />
o<strong>the</strong>r cases, <strong>the</strong> data may need to be adjusted to<br />
conform to <strong>the</strong> appropriate ocean sector focus<br />
e.g., elim<strong>in</strong>at<strong>in</strong>g <strong>the</strong> freshwater or non-mar<strong>in</strong>e<br />
component. In still o<strong>the</strong>r cases, <strong>the</strong> researcher will<br />
have to estimate Gross Output <strong>in</strong>dependent <strong>of</strong> BC<br />
Stats or Statistics Canada data.<br />
2.5 <strong>Economic</strong> Multipliers<br />
In addition to direct impacts, <strong>the</strong> ocean sector has<br />
impacts on <strong>the</strong> economy through backward l<strong>in</strong>kages<br />
to suppliers <strong>of</strong> goods and services (called <strong>in</strong>direct<br />
impacts), and through <strong>the</strong> respend<strong>in</strong>g <strong>of</strong> wage<br />
<strong>in</strong>comes earned at <strong>the</strong> direct and <strong>in</strong>direct stages<br />
(called <strong>in</strong>duced impacts).<br />
Typically <strong>the</strong>se sp<strong>in</strong><strong>of</strong>f <strong>in</strong>direct and <strong>in</strong>duced impacts<br />
are analyzed through economic “multipliers”. For<br />
example, an activity may generate direct GDP <strong>of</strong><br />
$0.50 from each $1 <strong>of</strong> direct <strong>in</strong>dustry output. The<br />
<strong>in</strong>direct supplier and <strong>in</strong>duced consumer spend<strong>in</strong>g<br />
impacts may add $0.40 to GDP. The total GDP<br />
multiplier - direct plus sp<strong>in</strong><strong>of</strong>f - per $1 direct output<br />
<strong>the</strong>n would be $0.90.<br />
For this study, we utilize Statistics Canada <strong>in</strong>terprov<strong>in</strong>cial<br />
<strong>in</strong>put-output multipliers for <strong>British</strong><br />
<strong>Columbia</strong> for <strong>the</strong> year 2003, <strong>the</strong> latest year available<br />
(Statistics Canada, “Prov<strong>in</strong>cial Input-Output<br />
Multipliers 2003”, Cat. No. 15F0046XDB, 2006). We<br />
chose to use Statistics Canada multipliers for <strong>British</strong><br />
<strong>Columbia</strong> ra<strong>the</strong>r than BC Stats multipliers s<strong>in</strong>ce <strong>the</strong><br />
Statistics Canada multipliers are more recent, and<br />
are more detailed (<strong>the</strong> most current set <strong>of</strong> BC Stats<br />
multipliers refer to <strong>the</strong> year 2001). Appendix M<br />
presents our multiplier analysis.<br />
Note that <strong>the</strong>re are several limitations and/or<br />
embedded assumptions to <strong>in</strong>put-output models<br />
(see GE Bridges 2004a p.4) e.g., impacts are assumed<br />
to be <strong>in</strong>stantaneous, marg<strong>in</strong>al changes equal<br />
average changes, any changes <strong>in</strong> output results<br />
<strong>in</strong> proportional changes <strong>in</strong> capital, labour and<br />
<strong>in</strong>termediate <strong>in</strong>puts etc.
10<br />
<strong>Economic</strong> <strong>Contribution</strong> <strong>of</strong> <strong>the</strong> <strong>Oceans</strong> <strong>Sector</strong> <strong>in</strong> <strong>British</strong> <strong>Columbia</strong><br />
3.0 The B.C. Ocean Economy - Private <strong>Sector</strong>s<br />
There are many bus<strong>in</strong>esses and bus<strong>in</strong>ess activities<br />
that are dependent on <strong>the</strong> ocean environment. These<br />
bus<strong>in</strong>ess sectors <strong>in</strong>clude: 1) resource extraction,<br />
process<strong>in</strong>g and distribution e.g., seafood,<br />
2) goods construction and manufactur<strong>in</strong>g e.g., ship<br />
build<strong>in</strong>g, and 3) services e.g., ocean transport and<br />
ocean-based recreation.<br />
The analysis <strong>of</strong> <strong>the</strong> economic dimensions <strong>of</strong> private<br />
sector bus<strong>in</strong>esses tied to <strong>the</strong> ocean environment<br />
<strong>in</strong>clude:<br />
h seafood<br />
h forestry<br />
h ship & boat build<strong>in</strong>g<br />
h mar<strong>in</strong>e construction<br />
h high tech manufactur<strong>in</strong>g & services<br />
h ocean recreation<br />
h ocean transport (ports & shipp<strong>in</strong>g)<br />
Each bus<strong>in</strong>ess sector is analyzed under several<br />
head<strong>in</strong>gs: 1) def<strong>in</strong>ition, 2) activities & output, 3) data<br />
adjustments & assumptions, 4) regional employment,<br />
and 5) direct impacts. Regional employment from<br />
2001 Census for some ocean-related bus<strong>in</strong>ess sectors<br />
is given <strong>in</strong> Appendix A.<br />
3.1 Seafood <strong>Sector</strong><br />
def<strong>in</strong>ition. The B.C. seafood <strong>in</strong>dustry produces,<br />
processes, and markets fish and shellfish <strong>in</strong>to<br />
<strong>in</strong>termediate or f<strong>in</strong>ished food products for<br />
consumers. The <strong>in</strong>dustry <strong>in</strong>volves several l<strong>in</strong>kages or<br />
phases <strong>of</strong> activity between <strong>the</strong> natural resource <strong>in</strong> its<br />
mar<strong>in</strong>e environment and <strong>the</strong> f<strong>in</strong>al products available<br />
to consumers (GSGislason 2004).<br />
h Production - Fish and shellfish are harvested us<strong>in</strong>g<br />
a variety <strong>of</strong> nets, hooks and l<strong>in</strong>es, traps, div<strong>in</strong>g<br />
techniques, or o<strong>the</strong>r gear. In addition, <strong>the</strong>y are<br />
cultured from birth through rear<strong>in</strong>g and feed<strong>in</strong>g<br />
to market size.<br />
h Process<strong>in</strong>g - Raw fish and shellfish reach<br />
commercial processors via delivery by sea<br />
to process<strong>in</strong>g plants, custom unload<strong>in</strong>g at<br />
transhipment po<strong>in</strong>ts, and truck<strong>in</strong>g. Processors<br />
transform <strong>the</strong> raw material <strong>in</strong>to a variety <strong>of</strong> live,<br />
fresh, whole, frozen whole, fillet, steak, smoked,<br />
canned, roe, and o<strong>the</strong>r products.<br />
h Distribution - F<strong>in</strong>al processed products are<br />
delivered to consumers through wholesale and<br />
retail food channels.<br />
These three <strong>in</strong>dustry elements also exist for <strong>the</strong> food<br />
bus<strong>in</strong>ess <strong>in</strong> general.<br />
Appendix B provides background <strong>in</strong>formation on <strong>the</strong><br />
seafood sector.<br />
Activities & Output. In recent years <strong>the</strong> B.C. seafood<br />
<strong>in</strong>dustry has produced 300,000-350,000 tonnes <strong>of</strong><br />
output worth $600 to $700 million at <strong>the</strong> primary<br />
landed or farm gate level, approximately $1.1-1.2<br />
billion at <strong>the</strong> wholesale (processed) level and $1.3-1.4<br />
billion at <strong>the</strong> distribution level.<br />
Approximately 20-30% by volume and 30-40% by<br />
value is tied to aquaculture production, ma<strong>in</strong>ly<br />
farmed salmon production - see Figure 1.
<strong>Economic</strong> <strong>Contribution</strong> <strong>of</strong> <strong>the</strong> <strong>Oceans</strong> <strong>Sector</strong> <strong>in</strong> <strong>British</strong> <strong>Columbia</strong> 11<br />
Figure 1: B.C. Seafood <strong>Sector</strong> Pr<strong>of</strong>ile<br />
A. Seafood Production 2005<br />
Seafood Value Cha<strong>in</strong><br />
Production Landed/Farm Value Wholesale Value<br />
‘000 tonnes $ millions $ millions<br />
Capture - salmon 26 33 212<br />
- herr<strong>in</strong>g 30 31 86<br />
- shellfish 18 122 178<br />
- groundfish 168 157 286<br />
- o<strong>the</strong>r 11 21 37<br />
Subtotal 253 364 799<br />
Aquaculture - salmon 71 319 371<br />
- shellfish 10 17 32<br />
Subtotal 81 336 403<br />
Total 334 700 1,202<br />
Source: B.C. M<strong>in</strong>istry <strong>of</strong> Environment (MOE), “Seafood Industry Year <strong>in</strong> Review”, Annual.<br />
B. Seafood Sales value and Export value 1990-2005<br />
$ millions<br />
1,400<br />
1,200<br />
1,000<br />
800<br />
600<br />
400<br />
200<br />
0<br />
1990 91 92 93 94 95 96 97 98 99 2000 01 02 03 04 05<br />
Year<br />
Capture Aquaculture<br />
Source: Sales Value - “Seafood Industry Year <strong>in</strong> Review”.<br />
Export Value - BC Stats, “B.C. Fisheries & Aquaculture <strong>Sector</strong>”, occasional.<br />
C. Seafood Regional Employment 2002<br />
% Employment<br />
Fish<strong>in</strong>g Aquaculture Process<strong>in</strong>g Distribution All<br />
Region<br />
North 16% 2% 10% 6% 10%<br />
Vancouver Island 46% 91% 34% 25% 44%<br />
Lower Ma<strong>in</strong>land 35% 7% 56% 65% 44%<br />
Interior 3% -
12<br />
<strong>Economic</strong> <strong>Contribution</strong> <strong>of</strong> <strong>the</strong> <strong>Oceans</strong> <strong>Sector</strong> <strong>in</strong> <strong>British</strong> <strong>Columbia</strong><br />
At one time <strong>the</strong> B.C. seafood sector was dom<strong>in</strong>ated<br />
by wild (capture) salmon and herr<strong>in</strong>g sectors - but<br />
<strong>the</strong>ir importance has decl<strong>in</strong>ed over <strong>the</strong> past 20<br />
years. In contrast, <strong>the</strong>re has been an <strong>in</strong>crease <strong>in</strong> <strong>the</strong><br />
contribution <strong>of</strong> wild shellfish and groundfish fisheries,<br />
and a substantial growth <strong>of</strong> <strong>the</strong> aquaculture (farm)<br />
sector, especially farmed salmon.<br />
data Adjustment & Assumptions. Adjustments<br />
were required to Statistics Canada <strong>in</strong>formation for<br />
<strong>the</strong> seafood sector, and <strong>the</strong> BC Stats “4 <strong>Sector</strong> Report”<br />
which relies on Statistics Canada data, because:<br />
h <strong>the</strong> Statistics Canada data excludes some<br />
establishments<br />
h Statistics Canada allocates vertically <strong>in</strong>tegrated<br />
salmon farm<strong>in</strong>g-process<strong>in</strong>g-market<strong>in</strong>g<br />
companies <strong>in</strong> <strong>the</strong>ir entirety to aquaculture - <strong>the</strong>re<br />
is a need to segment farm<strong>in</strong>g and process<strong>in</strong>g<br />
functions<br />
h Statistics Canada does not <strong>in</strong>clude crew<br />
payments and employment <strong>of</strong> self-employed<br />
<strong>in</strong>dividuals as part <strong>of</strong> Labour Income and<br />
Employment for <strong>the</strong> fishery sector - as a result <strong>the</strong><br />
wage share <strong>of</strong> fish harvest<strong>in</strong>g revenues, accord<strong>in</strong>g<br />
to Statistics Canada, is very low at under 5%<br />
h <strong>the</strong> Cost <strong>of</strong> Production pr<strong>of</strong>ile used by Statistics<br />
Canada for <strong>the</strong> fishery sector is 15+ years old and<br />
does not reflect current f<strong>in</strong>ancial circumstances<br />
Therefore we used benchmark <strong>in</strong>formation and<br />
values for <strong>the</strong> year 2002 from a comprehensive SWOT<br />
study to provide more realistic estimates <strong>of</strong> GDP,<br />
Labour Income and Employment ratios to Sales Value<br />
(GSGislason 2004). Wholesale and landed/farm gate<br />
values were taken from B.C. Environment “Seafood<br />
Industry Year <strong>in</strong> Review”. The SWOT study suggested<br />
that 10% <strong>of</strong> B.C. seafood output is consumed/sold<br />
<strong>in</strong> <strong>the</strong> prov<strong>in</strong>ce with <strong>the</strong> rema<strong>in</strong><strong>in</strong>g 90% exported to<br />
Eastern Canada and out-<strong>of</strong>-country markets. Direct<br />
exports <strong>of</strong> raw seafood are <strong>in</strong>cluded <strong>in</strong> <strong>the</strong> sales<br />
value.<br />
No adjustment to subtract non-mar<strong>in</strong>e components<br />
is needed s<strong>in</strong>ce essentially all fish production for sale<br />
comes from <strong>the</strong> ocean.<br />
Regional Employment. The bulk <strong>of</strong> seafood sector<br />
employment occurs on Vancouver Island and <strong>the</strong><br />
Lower Ma<strong>in</strong>land (each with 44% <strong>of</strong> total prov<strong>in</strong>cial<br />
seafood employment <strong>in</strong> 2002) - see Figure 1.<br />
Vancouver Island has over 90% <strong>of</strong> total aquaculture<br />
farm level employment whereas <strong>the</strong> Lower Ma<strong>in</strong>land<br />
has more than half <strong>of</strong> process<strong>in</strong>g and distribution<br />
employment.<br />
<strong>Economic</strong> Impacts. The B.C. seafood sector <strong>in</strong> 2005<br />
had sales <strong>of</strong> $1,380 million, contributed $790 million<br />
to prov<strong>in</strong>cial GDP, had Labour Income <strong>of</strong> $475 million,<br />
and employed 12,900 on a full-year basis - see<br />
Table 3. The sp<strong>in</strong><strong>of</strong>f <strong>in</strong>direct supplier and <strong>in</strong>duced<br />
consumer spend<strong>in</strong>g impacts add about 70% to <strong>the</strong><br />
GDP, Labour Income and Employment figures. The<br />
labour component <strong>of</strong> <strong>the</strong> seafood sector is higher<br />
than many o<strong>the</strong>r bus<strong>in</strong>ess sectors.<br />
3.2 forestry<br />
def<strong>in</strong>ition. A variety <strong>of</strong> <strong>in</strong>dustrial complexes are<br />
located on <strong>the</strong> B.C. coast. In many cases <strong>the</strong>se<br />
bus<strong>in</strong>esses have part <strong>of</strong> <strong>the</strong>ir workforce dedicated to<br />
load<strong>in</strong>g and unload<strong>in</strong>g ships at <strong>the</strong>ir private docks.<br />
For example, <strong>the</strong> Elk Falls forest complex at Campbell<br />
River and <strong>the</strong> Alcan alum<strong>in</strong>ium plant at Kitimat have<br />
private dock facilities.
<strong>Economic</strong> <strong>Contribution</strong> <strong>of</strong> <strong>the</strong> <strong>Oceans</strong> <strong>Sector</strong> <strong>in</strong> <strong>British</strong> <strong>Columbia</strong> 13<br />
Table 3: B.C. Seafood <strong>Sector</strong> <strong>Economic</strong> Impacts<br />
2002 2003 2004 2005<br />
A. GROSS OUTPUT<br />
Direct Sales Value $ millions<br />
Harvest<strong>in</strong>g & Farm Level 663 645 636 700<br />
Process<strong>in</strong>g Marg<strong>in</strong> 473 485 486 502<br />
Retail/Distn Marg<strong>in</strong> 174 170 168 178<br />
B. ECONOMIC IMPACTS<br />
Direct Impacts<br />
1,310 1,300 1,290 1,380<br />
GDP $ millions 750 745 740 790<br />
Labour Income $ millions 450 445 445 475<br />
Employment PYs 12,970 12,600 12,300 12,900<br />
Indirect Impacts<br />
GDP $ millions 240 230 230 250<br />
Labour Income $ millions 170 170 170 180<br />
Employment PYs 4,680 4,550 4,430 4,640<br />
Induced Impacts<br />
GDP $ millions 250 250 250 260<br />
Labour Income $ millions 150 150 150 160<br />
Employment PYs 4,050 3,940 3,860 4,030<br />
Total Impacts<br />
GDP $ millions 1,240 1,225 1,220 1,300<br />
Labour Income $ millions 770 765 765 815<br />
Employment PYs 21,700 21,090 20,590 21,570<br />
Source: Production Sales Value - MOE “Seafood Year <strong>in</strong> Review”, Annual.<br />
Process<strong>in</strong>g Marg<strong>in</strong> - MOE “Seafood Year <strong>in</strong> Review”, Annual.<br />
Distn Marg<strong>in</strong> - estimated as 15% <strong>of</strong> processed value.<br />
Direct Impacts - GSGislason, “SWOT Study” 2004 (Appendix M).<br />
Indirect & Induced Impacts - Stats Can Input-Output Multipliers (Appendix M).<br />
For this study we restrict ourselves to analysis<br />
<strong>of</strong> <strong>the</strong> mar<strong>in</strong>e component <strong>of</strong> <strong>the</strong> forest <strong>in</strong>dustry,<br />
where <strong>the</strong> forest <strong>in</strong>dustry is def<strong>in</strong>ed as logg<strong>in</strong>g plus<br />
manufactur<strong>in</strong>g <strong>of</strong> wood products and pulp & paper.<br />
Information for o<strong>the</strong>r <strong>in</strong>dustrial sectors are not readily<br />
available.<br />
We did contact <strong>the</strong> Aggregate Producers Association<br />
<strong>of</strong> B.C. as to <strong>the</strong> mar<strong>in</strong>e component <strong>of</strong> sand & gravel<br />
m<strong>in</strong><strong>in</strong>g. They <strong>in</strong>dicated that almost no material is<br />
directly extracted from <strong>the</strong> ocean floor, that Texada<br />
Island and <strong>the</strong> Sechelt Pen<strong>in</strong>sula are important<br />
m<strong>in</strong><strong>in</strong>g sites for Lower Ma<strong>in</strong>land producers, and that<br />
most barges and tugs used to transport <strong>the</strong> m<strong>in</strong>ed<br />
material from Texada and Sechelt to Vancouver are<br />
contracted to third parties i.e., this tug/barge activity<br />
would be <strong>in</strong>cluded under our “Ocean Transport”<br />
category.<br />
Appendix C provides background data on <strong>the</strong> B.C.<br />
forest <strong>in</strong>dustry.<br />
Activities & Output. The Coastal forest <strong>in</strong>dustry <strong>in</strong><br />
B.C. makes extensive use <strong>of</strong> <strong>the</strong> sheltered waterways<br />
along <strong>the</strong> West Coast <strong>in</strong>clud<strong>in</strong>g <strong>the</strong> North, Central<br />
and South Coast as well as Haida Gwaii/Queen<br />
Charlotte Islands and Vancouver Island. These<br />
waterways facilitate <strong>the</strong> transport <strong>of</strong> logs from <strong>the</strong><br />
woodlands scattered along Coastal B.C. to a large<br />
number <strong>of</strong> wood manufactur<strong>in</strong>g facilities ma<strong>in</strong>ly<br />
located <strong>in</strong> <strong>the</strong> Greater Vancouver area and on<br />
Vancouver Island. Chips from wood manufactur<strong>in</strong>g<br />
facilities are <strong>in</strong> turn shipped by water to various pulp<br />
and paper facilities along <strong>the</strong> Sou<strong>the</strong>rn Coast, and<br />
products are shipped directly by water to export<br />
markets from <strong>the</strong>se facilities.<br />
Coastal wood manufactur<strong>in</strong>g facilities <strong>in</strong> <strong>the</strong> Greater<br />
Vancouver area typically use rail and trucks to ship<br />
<strong>the</strong>ir f<strong>in</strong>al products, although some also ship <strong>the</strong>ir
14<br />
<strong>Economic</strong> <strong>Contribution</strong> <strong>of</strong> <strong>the</strong> <strong>Oceans</strong> <strong>Sector</strong> <strong>in</strong> <strong>British</strong> <strong>Columbia</strong><br />
f<strong>in</strong>al products by water. The wood manufactur<strong>in</strong>g<br />
facilities on Vancouver Island rely on port facilities to<br />
ship <strong>the</strong>ir products <strong>of</strong>fshore.<br />
There are eight primary pulp and paper facilities <strong>in</strong><br />
Coastal B.C., and all have direct dock<strong>in</strong>g facilities at<br />
<strong>the</strong> mill site.<br />
In <strong>the</strong> last 10 years <strong>the</strong> B.C. forest <strong>in</strong>dustry has<br />
harvested an average <strong>of</strong> 74 million m3 <strong>of</strong> logs with<br />
30% derived from <strong>the</strong> coast region. Total B.C. <strong>in</strong>dustry<br />
revenues <strong>in</strong> 2005 were an estimated - $6.8 billion<br />
Logg<strong>in</strong>g, $12.1 billion Wood Products Manufactur<strong>in</strong>g,<br />
$6.0 billion Paper Manufactur<strong>in</strong>g (see Table C.1,<br />
Appendix C).<br />
About 6% <strong>of</strong> B.C. logs - 21% <strong>of</strong> coastal logs and 1% <strong>of</strong><br />
<strong>in</strong>terior logs - are exported today. The export share<br />
has been <strong>in</strong>creas<strong>in</strong>g over <strong>the</strong> past decade (see Table<br />
C.1, Appendix C).<br />
data Adjustments & Assumptions. Statistics Canada<br />
provides <strong>in</strong>formation on forest sector activities and<br />
revenues. These aggregate statistics need to be<br />
prorated to reflect <strong>the</strong> 30% share that <strong>the</strong> coastal<br />
<strong>in</strong>dustry comprises, and <strong>the</strong> share <strong>of</strong> <strong>the</strong> coastal<br />
forest sector workforce that has a mar<strong>in</strong>e focus.<br />
Discussion with <strong>in</strong>dividuals <strong>in</strong> <strong>the</strong> forest <strong>in</strong>dustry<br />
suggest <strong>the</strong> follow<strong>in</strong>g approximations for <strong>the</strong> mar<strong>in</strong>e<br />
share <strong>of</strong> coastal forest activity:<br />
h Logg<strong>in</strong>g - 2% mar<strong>in</strong>e component reflect<strong>in</strong>g<br />
workers sort<strong>in</strong>g logs (note that essentially all<br />
tugboat/barge operators are <strong>in</strong>dependent<br />
contractors - <strong>the</strong>y are <strong>in</strong>cluded under <strong>the</strong><br />
category “Ocean Transport” discussed later).<br />
h Wood products - 5% mar<strong>in</strong>e component<br />
reflect<strong>in</strong>g workers <strong>in</strong> dewater<strong>in</strong>g functions (i.e.,<br />
gett<strong>in</strong>g logs out <strong>of</strong> <strong>the</strong> water <strong>in</strong>to <strong>the</strong> mill), and<br />
load<strong>in</strong>g ships.<br />
h Pulp & paper - 5% mar<strong>in</strong>e component reflect<strong>in</strong>g<br />
<strong>in</strong>-house shipp<strong>in</strong>g crew at <strong>the</strong> dockside.<br />
Table 4: B.C. Forest <strong>Sector</strong> <strong>Economic</strong> Impacts - Ocean Component<br />
2002 2003 2004 2005<br />
A. GROSS OUTPUT<br />
Direct Sales Value $ millions<br />
Forestry & Logg<strong>in</strong>ga 90 89 123 107<br />
Secondary Manufactur<strong>in</strong>g 179 167 185 176<br />
B. ECONOMIC IMPACTS<br />
Direct Impacts<br />
269 256 308 283<br />
GDP $ millionsa 100 90 118 108<br />
Labour Income $ millions 60 58 59 60<br />
Employment PYs 960 930 910 910<br />
Indirect Impacts<br />
GDP $ millions 97 92 111 102<br />
Labour Income $ millions 67 64 77 71<br />
Employment PYs 1,290 1,200 1,420 1,280<br />
Induced Impacts<br />
GDP $ millions 51 49 54 52<br />
Labour Income $ millions 30 29 33 31<br />
Employment PYs 810 780 850 840<br />
Total Impacts<br />
GDP $ millions 248 231 283 262<br />
Labour Income $ millions 157 151 169 162<br />
Employment PYs 3,060 2,910 3,180 3,030<br />
Source: Appendix C.<br />
a Includes $3 million annually <strong>in</strong> log boom tenure payments.
<strong>Economic</strong> <strong>Contribution</strong> <strong>of</strong> <strong>the</strong> <strong>Oceans</strong> <strong>Sector</strong> <strong>in</strong> <strong>British</strong> <strong>Columbia</strong> 15<br />
The result is that an estimated 0.6% <strong>of</strong> total B.C.<br />
Logg<strong>in</strong>g activity, 1.5% <strong>of</strong> total B.C. Wood Products<br />
activity, and 1.5% <strong>of</strong> total B.C. Pulp Manufactur<strong>in</strong>g<br />
activity should be allocated to <strong>the</strong> mar<strong>in</strong>e sector i.e.,<br />
30% <strong>of</strong> <strong>the</strong> above percentages.<br />
Regional Employment. The regional share <strong>of</strong><br />
coastal B.C. production employment would be<br />
approximately 20% North Coast, 60% Vancouver<br />
Island, and 20% Lower Ma<strong>in</strong>land. Head <strong>of</strong>fice activity<br />
and adm<strong>in</strong>istration employment are concentrated <strong>in</strong><br />
Vancouver.<br />
<strong>Economic</strong> Impacts. The direct and sp<strong>in</strong><strong>of</strong>f economic<br />
impacts <strong>of</strong> <strong>the</strong> mar<strong>in</strong>e component <strong>of</strong> <strong>the</strong> forest<br />
<strong>in</strong>dustry are given <strong>in</strong> Table 4. The Gross Output and<br />
GDP estimates <strong>in</strong>cludes <strong>the</strong> $3 million paid annually<br />
by forest companies for log boom tenures (payments<br />
comprise part <strong>of</strong> <strong>the</strong> <strong>in</strong>direct tax component <strong>of</strong> GDP).<br />
The estimates do not <strong>in</strong>clude <strong>the</strong> ocean contribution<br />
<strong>of</strong> large <strong>in</strong>dustrials o<strong>the</strong>r than forest companies such<br />
as Alcan. These could be <strong>in</strong>cluded <strong>in</strong> future work.<br />
3.3 Ship & Boat Build<strong>in</strong>g<br />
def<strong>in</strong>ition. The Ship & Boat Build<strong>in</strong>g <strong>in</strong>dustry NAICS<br />
3366 has two major components:<br />
h Ship Build<strong>in</strong>g & Repair<strong>in</strong>g - establishments<br />
primarily engaged <strong>in</strong> operat<strong>in</strong>g a ship yard<br />
h Boat Build<strong>in</strong>g - establishments primarily engaged<br />
<strong>in</strong> manufactur<strong>in</strong>g boats<br />
Shipyards are fixed facilities with dry docks and<br />
fabrication equipment capable <strong>of</strong> build<strong>in</strong>g a ship,<br />
a watercraft for o<strong>the</strong>r than personal or recreational<br />
use. Boats are def<strong>in</strong>ed as watercraft for personal or<br />
recreational use.<br />
Appendix D provides background <strong>in</strong>formation on <strong>the</strong><br />
sector.<br />
Activities & Output. Gross output or sales <strong>of</strong><br />
<strong>the</strong> sector has been $380-420 million <strong>in</strong> recent<br />
years. Large shipyards <strong>in</strong>clude Victoria Shipyards,<br />
Nanaimo Shipyards, Vancouver Shipyards and Allied<br />
Shipbuilders (<strong>the</strong> latter two are <strong>in</strong> North Vancouver).<br />
The B.C. Yacht Build<strong>in</strong>g Association has about 65<br />
builders, designers, and supplier members. Boat<br />
builders <strong>in</strong>clude ABD Alum<strong>in</strong>ium Yachts <strong>of</strong> North<br />
Vancouver, Coast Craft Welded Alum<strong>in</strong>ium Boats<br />
Ltd. <strong>of</strong> Gibsons and Philbrook’s Boatyard <strong>in</strong> Sidney. A<br />
significant share <strong>of</strong> yachts built <strong>in</strong> B.C. are exported –<br />
see Table D.2, Appendix D.<br />
The nature <strong>of</strong> <strong>the</strong> ship & boat build<strong>in</strong>g bus<strong>in</strong>ess is<br />
that it is lumpy i.e., a few large orders can create a<br />
spike <strong>in</strong> bus<strong>in</strong>ess activity followed by a bus<strong>in</strong>ess lull<br />
<strong>the</strong>reafter.<br />
data Adjustments & Assumptions. Some Boat<br />
Build<strong>in</strong>g activity is directed at freshwater markets e.g.,<br />
canoes, skiffs with outboards etc. For <strong>the</strong> purpose <strong>of</strong><br />
this analysis we assume that 100% <strong>of</strong> Ship Build<strong>in</strong>g<br />
and about 90% <strong>of</strong> Boat Build<strong>in</strong>g activity is mar<strong>in</strong>erelated.<br />
Regional Employment. The 2001 Census had<br />
<strong>the</strong> follow<strong>in</strong>g distribution <strong>of</strong> Ship & Boat Build<strong>in</strong>g<br />
<strong>in</strong>dustry employment for coastal B.C. - 1% North, 35%<br />
Vancouver Island, and 64% Lower Ma<strong>in</strong>land.
16<br />
<strong>Economic</strong> <strong>Contribution</strong> <strong>of</strong> <strong>the</strong> <strong>Oceans</strong> <strong>Sector</strong> <strong>in</strong> <strong>British</strong> <strong>Columbia</strong><br />
Table 5: B.C. Ocean-Related Ship Build<strong>in</strong>g & Boat Build<strong>in</strong>g <strong>Economic</strong> Impacts<br />
2002 2003 2004 2005<br />
A. GROSS OUTPUT<br />
Direct Sales Value $ millions<br />
Ship Build<strong>in</strong>g & Repair<strong>in</strong>g 175 217 200 200<br />
Boat Build<strong>in</strong>g 203 205 180 198<br />
B. ECONOMIC IMPACTS<br />
Direct Impacts<br />
378 422 380 398<br />
GDP $ millions 165 186 168 175<br />
Labour Income $ millions 131 148 134 139<br />
Employment PYs 2,520 2,740 2,410 2,490<br />
Indirect Impacts<br />
GDP $ millions 85 98 89 92<br />
Labour Income $ millions 41 47 42 44<br />
Employment PYs 970 1,080 960 980<br />
Induced Impacts<br />
GDP $ millions 69 78 70 73<br />
Labour Income $ millions 41 47 42 44<br />
Employment PYs 1,120 1,250 1,100 1,130<br />
Total Impacts<br />
GDP $ millions 319 362 327 340<br />
Labour Income $ millions 213 242 218 227<br />
Employment PYs 4,610 5,070 4,470 4,600<br />
Source: Table D.1, Appendix D.<br />
<strong>Economic</strong> Impacts. The ocean component <strong>of</strong> <strong>the</strong> B.C.<br />
Ship & Boat Build<strong>in</strong>g sector <strong>in</strong> 2005 had estimated<br />
revenues <strong>of</strong> $398 million, contributed $175 million to<br />
prov<strong>in</strong>cial GDP, had Labour Income <strong>of</strong> $139 million,<br />
and had Employment <strong>of</strong> 2,490 person-years. Trickle<br />
down effects on supplier and retail sectors create<br />
additional economic activity.<br />
3.4 Ocean Construction<br />
def<strong>in</strong>ition. The category Ocean Construction can not<br />
be allocated to a specific NAICS code. This category<br />
comprises mar<strong>in</strong>e structures such as docks, wharves,<br />
and dredg<strong>in</strong>g.<br />
Appendix E provides <strong>in</strong>formation on construction<br />
activities <strong>of</strong> <strong>the</strong> six Port Authorities <strong>in</strong> B.C.<br />
Activities & Outputs. There currently are no mar<strong>in</strong>erelated<br />
oil & gas-related construction expenditures<br />
<strong>in</strong> B.C. The current oil & gas <strong>in</strong>dustry and related<br />
construction <strong>in</strong>dustry is restricted to land-based<br />
activities ma<strong>in</strong>ly <strong>in</strong> Nor<strong>the</strong>ast B.C.<br />
The Federal Department <strong>of</strong> National Defence spends<br />
significant monies on shore <strong>in</strong>frastructure at its CFB<br />
Esquimalt naval facility.<br />
The Small Craft Harbour (SCH) division <strong>of</strong> DFO is<br />
responsible for <strong>the</strong> capital program for <strong>the</strong> network<br />
<strong>of</strong> close to 100 Small Craft Harbour facilities up<br />
and down <strong>the</strong> coast. B.C. Ferries spends money on<br />
berthage, build<strong>in</strong>gs and equipment related to <strong>the</strong>ir<br />
mar<strong>in</strong>e ferry operations (<strong>the</strong> construction <strong>of</strong> ferries is<br />
not <strong>in</strong>cluded <strong>in</strong> this sector).<br />
Port development and construction is an important<br />
sector component. The six federal Port Authorities<br />
have capital programs for mar<strong>in</strong>e construction. For<br />
example, <strong>the</strong> Port <strong>of</strong> Pr<strong>in</strong>ce Rupert is undergo<strong>in</strong>g a<br />
substantial conta<strong>in</strong>er term<strong>in</strong>al expansion.<br />
data Adjustments & Assumptions. The ocean<br />
construction expenditures are relatively modest s<strong>in</strong>ce<br />
capital expenditures on ships and <strong>the</strong>ir repair have<br />
already been addressed. It is likely that <strong>the</strong> above<br />
estimates are conservative as private sector <strong>in</strong>itiatives<br />
are not <strong>in</strong>cluded.<br />
Regional Employment. It is likely that <strong>the</strong> regional<br />
employment pattern for mar<strong>in</strong>e construction
<strong>Economic</strong> <strong>Contribution</strong> <strong>of</strong> <strong>the</strong> <strong>Oceans</strong> <strong>Sector</strong> <strong>in</strong> <strong>British</strong> <strong>Columbia</strong> 17<br />
would be similar to that for Ship & Boat Build<strong>in</strong>g i.e.,<br />
1% North, 35% Vancouver Island and 64% Lower<br />
Ma<strong>in</strong>land.<br />
<strong>Economic</strong> Impacts. The mar<strong>in</strong>e construction <strong>in</strong>dustry<br />
impacts are given <strong>in</strong> Table 6.<br />
3.5 high Tech Manufactur<strong>in</strong>g & Services<br />
def<strong>in</strong>ition. The mar<strong>in</strong>e technology <strong>in</strong>dustry does not<br />
comprise a separate NAICS <strong>in</strong>dustry code or set <strong>of</strong><br />
codes. It is diverse and <strong>in</strong>cludes:<br />
Table 6: B.C. Ocean Construction <strong>Economic</strong> Impacts<br />
h Acoustics Systems and Equipment: Equipment<br />
and systems that use sound underwater. For<br />
example hydrophones record underwater<br />
sounds, echo sounders use sound to measure<br />
water depth, multi beam sonar uses sound beams<br />
to image <strong>the</strong> bottom, acoustic telemetry sends<br />
signals by means <strong>of</strong> sound, etc. Products <strong>in</strong>clude<br />
sonars, echo sounders, sub bottom pr<strong>of</strong>ilers, and<br />
data acquisition and process<strong>in</strong>g systems.<br />
2002 2003 2004 2005<br />
A. GROSS OUTPUT<br />
Direct Sales Value $ millions<br />
B.C. Ferries 33 34 70 101<br />
DFO 26 36 25 27<br />
DND 11 7 23 55<br />
Ports 40 40 43 33<br />
B. ECONOMIC IMPACTS<br />
Direct Impacts<br />
110 117 161 216<br />
GDP $ millions 47 50 69 93<br />
Labour Income $ millions 35 37 52 69<br />
Employment PYs 720 750 990 1,330<br />
Indirect Impacts<br />
GDP $ millions 34 36 50 67<br />
Labour Income $ millions 22 23 32 43<br />
Employment PYs 560 590 790 1,040<br />
Induced Impacts<br />
GDP $ millions 23 24 34 45<br />
Labour Income $ millions 14 14 20 27<br />
Employment PYs 370 380 530 690<br />
Total Impacts<br />
GDP $ millions 104 110 153 205<br />
Labour Income $ millions 71 74 104 139<br />
Employment PYs 1,650 1,720 2,310 3,060<br />
Source: Gross Output - Interviews (DFO & DND). - Annual Reports (B.C. Ferries & Port Authorities).<br />
<strong>Economic</strong> Impacts - based on Stats Can “2003 B.C. Input Output Multipliers” for eng<strong>in</strong>eer<strong>in</strong>g construction (see Appendix M).<br />
h defence <strong>Oceans</strong> Technology:<br />
Ocean technology<br />
products or services for <strong>the</strong> naval market,<br />
e.g., anti submar<strong>in</strong>e warfare (ASW), military<br />
underwater vehicles, stealth buoys, surveillance<br />
systems etc.<br />
h Imag<strong>in</strong>g <strong>Oceans</strong> Technology:<br />
This category is<br />
largely remote sens<strong>in</strong>g for ocean applications,<br />
e.g., s<strong>of</strong>tware for visualization <strong>of</strong> large<br />
hydrographic data sets, geomatics, etc.<br />
h Instrumentation and Information Systems:<br />
Sensors and systems that measure mar<strong>in</strong>e<br />
parameters, e.g., oceanographic <strong>in</strong>struments,<br />
drift<strong>in</strong>g buoys, data collection systems, cabled<br />
seafloor observatories & <strong>the</strong>ir components etc.<br />
h Mar<strong>in</strong>e Communications:<br />
Companies primarily<br />
engaged <strong>in</strong> mar<strong>in</strong>e navigation, communications<br />
and <strong>in</strong>formation technology, e.g., <strong>in</strong>formation<br />
seaway, mar<strong>in</strong>e geomatics, mar<strong>in</strong>e <strong>in</strong>formation
18<br />
<strong>Economic</strong> <strong>Contribution</strong> <strong>of</strong> <strong>the</strong> <strong>Oceans</strong> <strong>Sector</strong> <strong>in</strong> <strong>British</strong> <strong>Columbia</strong><br />
skyway, mar<strong>in</strong>e <strong>in</strong>telligent systems, and wireless<br />
R&D.<br />
h Platforms and vehicles:<br />
This category <strong>in</strong>cludes<br />
ocean vehicles ROVs (Remotely Operated<br />
Vehicles), AUVs (Autonomous Underwater<br />
Vehicles), Submersibles, Ocean Platforms,<br />
Handl<strong>in</strong>g Systems etc.<br />
h Services:<br />
Mar<strong>in</strong>e services are similar to<br />
land based, but undertaken <strong>in</strong> <strong>the</strong> mar<strong>in</strong>e<br />
environment, e.g., mar<strong>in</strong>e survey, mar<strong>in</strong>e<br />
eng<strong>in</strong>eer<strong>in</strong>g, naval architecture, mar<strong>in</strong>e<br />
environmental services, vessel operations, mar<strong>in</strong>e<br />
simulation, mar<strong>in</strong>e tra<strong>in</strong><strong>in</strong>g etc.<br />
Appendix F provides background <strong>in</strong>formation on <strong>the</strong><br />
sector.<br />
Activities & Output. It is difficult to designate an<br />
all-<strong>in</strong>clusive group<strong>in</strong>g for ocean technology firms<br />
and activities, one component <strong>of</strong> a larger aggregate<br />
called “High Technology”. BC Stats has def<strong>in</strong>ed High<br />
Technology firms as those belong<strong>in</strong>g to 30+ <strong>in</strong>dustry<br />
group<strong>in</strong>gs - see Table F.3, Appendix F.<br />
The mar<strong>in</strong>e component <strong>of</strong> this larger group <strong>of</strong><br />
companies provid<strong>in</strong>g goods and services would<br />
comprise a small component <strong>of</strong> High Technology<br />
firms. Some evidence as to <strong>the</strong> size or mar<strong>in</strong>e share<br />
<strong>in</strong>cludes:<br />
h<br />
h<br />
a recent study <strong>of</strong> <strong>the</strong> Vancouver Island<br />
technology <strong>in</strong>dustry <strong>in</strong>dicated that <strong>the</strong> ocean<br />
component was <strong>the</strong> primary focus <strong>of</strong> 7% <strong>of</strong><br />
technology companies surveyed (Innovation and<br />
Science Council <strong>of</strong> <strong>British</strong> <strong>Columbia</strong>, 2004).<br />
<strong>the</strong> 1990 revenues <strong>of</strong> high tech ocean activities <strong>in</strong><br />
B.C. was an estimated $300 million (SPARK, 1993).<br />
For <strong>the</strong> purposes <strong>of</strong> this study we assume that <strong>the</strong><br />
mar<strong>in</strong>e technology sector comprises 20% <strong>of</strong> total<br />
high tech manufactur<strong>in</strong>g plus 5% <strong>of</strong> total high tech<br />
services, about 7-8% <strong>of</strong> <strong>the</strong> overall high tech sector.<br />
The manufactur<strong>in</strong>g share is higher s<strong>in</strong>ce <strong>the</strong>re<br />
are several large mar<strong>in</strong>e firms <strong>in</strong> <strong>the</strong> group e.g.,<br />
MacDonald, Dettwiler & Associates Ltd. <strong>in</strong> Vancouver.<br />
The estimated ocean shares <strong>of</strong> high tech are based on<br />
discussions with high tech <strong>in</strong>dustry representatives<br />
and pr<strong>of</strong>essional judgement.<br />
The mar<strong>in</strong>e technology sector has been grow<strong>in</strong>g<br />
rapidly and presently exceeds $1.1 billion annually <strong>in</strong><br />
revenues.<br />
data Adjustment & Assumptions. The non-mar<strong>in</strong>e<br />
component <strong>of</strong> <strong>the</strong> technology sector already has<br />
been netted out <strong>of</strong> <strong>the</strong> activity estimates as expla<strong>in</strong>ed<br />
above.
<strong>Economic</strong> <strong>Contribution</strong> <strong>of</strong> <strong>the</strong> <strong>Oceans</strong> <strong>Sector</strong> <strong>in</strong> <strong>British</strong> <strong>Columbia</strong> 19<br />
Table 7: B.C. Ocean High Tech Manufactur<strong>in</strong>g & Services <strong>Economic</strong> Impacts<br />
2002 2003 2004 2005<br />
A. GROSS OUTPUT<br />
Direct Sales Value $ millions<br />
Ocean High Tech Manufactur<strong>in</strong>g 425 450 465 500<br />
Ocean High Tech Services 500 545 585 625<br />
B. ECONOMIC IMPACTS<br />
Direct Impacts<br />
925 995 1,050 1,125<br />
GDP $ millions 465 500 530 565<br />
Labour Income $ millions 300 320 340 365<br />
Employment PYs 5,010 5,280 5,450 5,730<br />
Indirect Impacts<br />
GDP $ millions 220 240 255 275<br />
Labour Income $ millions 140 150 160 170<br />
Employment PYs 3,720 3,940 4,100 4,300<br />
Induced Impacts<br />
GDP $ millions 175 190 200 215<br />
Labour Income $ millions 105 110 120 130<br />
Employment PYs 2,870 3,010 3,140 3,290<br />
Total Impacts<br />
GDP $ millions 860 930 985 1,055<br />
Labour Income $ millions 545 580 620 665<br />
Employment PYs 11,600 12,230 12,690 13,320<br />
Source: Gross Output - 20% <strong>of</strong> total high tech manufactur<strong>in</strong>g + 5% <strong>of</strong> total high tech services (see Table F.1, Appendix F for total high tech).<br />
<strong>Economic</strong> Impacts - multipliers based on Table F.1 (see Appendix F and Appendix M).<br />
Regional Employment. The <strong>in</strong>dustry is concentrated<br />
<strong>in</strong> <strong>the</strong> Greater Vancouver area although a significant<br />
technology cluster exists <strong>in</strong> <strong>the</strong> Greater Victoria<br />
area. Our estimates <strong>of</strong> <strong>the</strong> regional distribution <strong>of</strong><br />
employment are: 1% North, 25% Vancouver Island,<br />
70% Vancouver, and 4% Interior (<strong>the</strong> regional<br />
distribution <strong>of</strong> employment from 2001 Census for<br />
NAICS 3345 – Navigational, Measur<strong>in</strong>g, Medical &<br />
Control Instruments Manufactur<strong>in</strong>g – is provided <strong>in</strong><br />
Appendix A).<br />
<strong>Economic</strong> Impacts. The ocean technology sector<br />
<strong>in</strong> 2005 had estimated revenue <strong>of</strong> $1,125 million,<br />
contributed $565 million to GDP and $365 million<br />
to Labour Income, and employed 5,730 people on a<br />
year round basis. Sp<strong>in</strong><strong>of</strong>f effects add to <strong>the</strong>se direct<br />
impacts.<br />
3.6 Ocean-Based leisure/Recreation<br />
def<strong>in</strong>ition. The ocean-based recreation sector is <strong>the</strong><br />
most difficult <strong>of</strong> <strong>the</strong> private sectors to analyze <strong>in</strong> that<br />
it does not fit <strong>in</strong>to a NAICS group<strong>in</strong>g <strong>of</strong> (supply side)<br />
<strong>in</strong>dustries - ra<strong>the</strong>r <strong>the</strong> recreation sector encompasses<br />
a variety <strong>of</strong> consumer (demand scale) activities/<br />
expenditures that are tied to <strong>the</strong> ocean environment.<br />
These activities <strong>in</strong>clude saltwater angl<strong>in</strong>g, whale<br />
watch<strong>in</strong>g, ocean boat<strong>in</strong>g and sail<strong>in</strong>g, scuba div<strong>in</strong>g,<br />
guided kayak trips, beach activities, mar<strong>in</strong>e park<br />
visitation and <strong>the</strong> like. There are def<strong>in</strong>itional<br />
challenges as many shore-based activities such as<br />
walk<strong>in</strong>g on beaches or bik<strong>in</strong>g on seaside trails are<br />
enhanced or driven by <strong>the</strong> presence <strong>of</strong> <strong>the</strong> nearby<br />
ocean.<br />
Ocean-based recreation should not be restricted only<br />
to tourists (traditionally def<strong>in</strong>ed as people, <strong>in</strong>clud<strong>in</strong>g<br />
bus<strong>in</strong>ess persons, travell<strong>in</strong>g 80 km or more from <strong>the</strong>ir<br />
normal residence). Non-tourists or locals comprise<br />
an important component <strong>of</strong> <strong>the</strong> overall ocean-based<br />
recreation sector.<br />
In short, one needs to develop a customized<br />
approach based on consumer motivations and<br />
activity <strong>in</strong> order to isolate <strong>the</strong> ocean-based<br />
component <strong>of</strong> overall recreation. For <strong>the</strong> purpose <strong>of</strong>
20<br />
<strong>Economic</strong> <strong>Contribution</strong> <strong>of</strong> <strong>the</strong> <strong>Oceans</strong> <strong>Sector</strong> <strong>in</strong> <strong>British</strong> <strong>Columbia</strong><br />
this study, we propose <strong>the</strong> follow<strong>in</strong>g four segments<br />
for ocean recreation:<br />
h saltwater angl<strong>in</strong>g (<strong>in</strong>clud<strong>in</strong>g fish<strong>in</strong>g lodges and<br />
charters, shellfish harvest<strong>in</strong>g)<br />
h cruise ship visitation<br />
h ferry travellers<br />
h ocean activities e.g., boat<strong>in</strong>g/sail<strong>in</strong>g, whale<br />
watch<strong>in</strong>g<br />
It is important to <strong>in</strong>clude both tourist and nontourist/local<br />
activity. Almost all cruise ship and ferry<br />
passengers would be tourists i.e., <strong>the</strong>y would travel<br />
80 km or more.<br />
We have chosen to <strong>in</strong>clude <strong>the</strong> category “Ferries” <strong>in</strong><br />
Ocean Recreation ra<strong>the</strong>r than <strong>the</strong> Ocean Transport<br />
section to follow as mar<strong>in</strong>e tourists are <strong>the</strong> f<strong>in</strong>al<br />
consumer (Pr<strong>in</strong>ciple #4, Section 2.2).<br />
Figure 2: B.C. Ocean Recreation <strong>Sector</strong> Pr<strong>of</strong>ile<br />
A. B.C. Saltwater Angl<strong>in</strong>g<br />
Expenditures<br />
B. B.C. Cruise Ship Passages<br />
C. B.C. Ferries Revenues<br />
$ millions<br />
$ millions<br />
800<br />
600<br />
400<br />
200<br />
'000<br />
0<br />
Appendix G provides background <strong>in</strong>formation on <strong>the</strong><br />
ocean recreation sector.<br />
Activities & Output. Figure 2 displays some trends<br />
for ocean recreation <strong>in</strong>dicators.<br />
B.C. saltwater angl<strong>in</strong>g started to decl<strong>in</strong>e <strong>in</strong> <strong>the</strong> mid<br />
1990s due to ch<strong>in</strong>ook and coho salmon resource<br />
concerns and due to regulatory uncerta<strong>in</strong>ty and/<br />
or changes <strong>in</strong> regulations. In recent years, ch<strong>in</strong>ook<br />
and coho stocks have rebounded, <strong>the</strong> regulatory<br />
environment has been stable and saltwater angl<strong>in</strong>g<br />
activity has <strong>in</strong>creased. In 2005, saltwater anglers<br />
purchased 316,500 fish<strong>in</strong>g licences and spent an<br />
estimated $642 million on 2.3 million saltwater<br />
angl<strong>in</strong>g days (DFO, prelim<strong>in</strong>ary data).<br />
1994 95 96 97 98 99 2000 01 02 03 04 05<br />
1,400<br />
1,200<br />
1,000<br />
800<br />
600<br />
400<br />
200<br />
0<br />
500<br />
400<br />
300<br />
200<br />
100<br />
0<br />
Year<br />
1994 95 96 97 98 99 2000 01 02 03 04 05<br />
Year<br />
Vancouver O<strong>the</strong>r Ports<br />
2001 2002 2003 2004 2005<br />
Year
<strong>Economic</strong> <strong>Contribution</strong> <strong>of</strong> <strong>the</strong> <strong>Oceans</strong> <strong>Sector</strong> <strong>in</strong> <strong>British</strong> <strong>Columbia</strong> 21<br />
D. B.C. Ocean Recreation<br />
Expenditures<br />
$ millions<br />
4,000<br />
3,000<br />
2,000<br />
1,000<br />
Source: A - GSGislason & Associates Ltd, “GSG” estimates.<br />
B - Transport Canada, “Transportation <strong>in</strong> Canada,” Annual Report and B.C. Cruise.<br />
C - B.C. Ferries Annual Report.<br />
D - Table G.5, Appendix G (angl<strong>in</strong>g, cruise, ferries, and o<strong>the</strong>r).<br />
The cruise ship subsector <strong>in</strong>volves both large<br />
<strong>in</strong>ternational vessels handl<strong>in</strong>g 1,500+ passengers<br />
that go to Alaska and back as well as much smaller<br />
“pocket cruise” vessels with under 100 passengers<br />
that cruise with<strong>in</strong> B.C. waters. Vancouver cruise ship<br />
passenger counts <strong>in</strong>creased every year through <strong>the</strong><br />
1990s and through 2002 but have decl<strong>in</strong>ed s<strong>in</strong>ce<br />
<strong>the</strong>n. Vancouver is primarily a port <strong>of</strong> departure and<br />
arrival for Alaska cruises. The Port <strong>of</strong> Vancouver is<br />
under <strong>in</strong>creas<strong>in</strong>g competition from <strong>the</strong> Port <strong>of</strong> Seattle<br />
for cruise ship traffic.<br />
Victoria is primarily a port <strong>of</strong> call for Alaska cruises<br />
that orig<strong>in</strong>ate <strong>in</strong> US ports (BREA 2004). Cruise<br />
passenger volumes at <strong>the</strong> Port <strong>of</strong> Victoria have more<br />
than tripled s<strong>in</strong>ce 2000. Cruise ships have visited<br />
Pr<strong>in</strong>ce Rupert and Nanaimo <strong>in</strong> recent years - and<br />
Campbell River and Port Alberni are plann<strong>in</strong>g to have<br />
cruise ship term<strong>in</strong>als. Total cruise passenger volume<br />
was 1.3 million passengers <strong>in</strong> 2005. Cruise passengers<br />
and crew spent an estimated $270 million <strong>in</strong> <strong>British</strong><br />
<strong>Columbia</strong> <strong>in</strong> 2005.<br />
In April 2003, B.C. Ferries was transformed from a<br />
prov<strong>in</strong>cial crown corporation to an <strong>in</strong>dependent<br />
operat<strong>in</strong>g entity. Today <strong>the</strong> corporation carries 22<br />
million passengers, over 8 million cars, <strong>in</strong> over 30<br />
vessels, over a variety <strong>of</strong> routes along coastal B.C.<br />
Revenue growth has been steady <strong>in</strong> recent years.<br />
There also are ferries not operated by B.C. Ferries<br />
that provide service between Greater Victoria and<br />
Wash<strong>in</strong>gton State.<br />
The “o<strong>the</strong>r” category is a diverse mix <strong>of</strong> boat<strong>in</strong>g/<br />
sail<strong>in</strong>g, nature observation, and o<strong>the</strong>r activities.<br />
Very little economic <strong>in</strong>formation is available on this<br />
sector and its separate components, and what little<br />
<strong>in</strong>formation is available usually addresses <strong>the</strong> guided<br />
fee-for-service component only e.g., whale watch<strong>in</strong>g<br />
tours, scuba div<strong>in</strong>g tours/lessons, sea kayak<strong>in</strong>g tours.<br />
0<br />
2001 2002 2003 2004 2005<br />
Year<br />
The much larger self-directed ocean recreation<br />
experience is not <strong>in</strong>cluded. We have estimated <strong>the</strong><br />
2005 sales revenues/expenditures by this “o<strong>the</strong>r”<br />
category to be $2.4 billion <strong>in</strong> total – see Table G.5,<br />
Appendix G.<br />
The ocean economic study for California estimated<br />
approximately 464 million ocean recreation days<br />
for <strong>the</strong> 34 million state residents <strong>in</strong> 2000 (Kildow<br />
and Colgan 2005 – see Table G.6 Appendix G). If<br />
B.C. had half <strong>the</strong> per capita participation rates as<br />
California, this still would amount to close to 30<br />
million ocean recreation days for <strong>the</strong> prov<strong>in</strong>ce’s 4.1<br />
million residents. Ocean activities are an important<br />
recreation choice for <strong>British</strong> <strong>Columbia</strong>ns.<br />
data Adjustments & Assumptions. The key<br />
assumptions underly<strong>in</strong>g <strong>the</strong> revenue estimates are<br />
given <strong>in</strong> Table G.5, Appendix G. We had to estimate<br />
<strong>the</strong> share <strong>of</strong> tourist expenditures, o<strong>the</strong>r than angl<strong>in</strong>g,<br />
cruis<strong>in</strong>g and ferries, that is ocean-related. B.C.<br />
Tourism only estimates overnight tourists and <strong>the</strong>ir<br />
expenditures.<br />
Ocean recreation spend<strong>in</strong>g <strong>in</strong> 2005 is an estimated<br />
$3.8 billion - $3.0 billion by tourists and $0.8 by<br />
non-tourists e.g., Vancouver residents boat<strong>in</strong>g,<br />
w<strong>in</strong>dsurf<strong>in</strong>g <strong>in</strong> English Bay (Appendix G). The $3.0<br />
billion mar<strong>in</strong>e spend<strong>in</strong>g by tourists represents 22%<br />
<strong>of</strong> <strong>the</strong> $13.8 total tourism spend<strong>in</strong>g. As a po<strong>in</strong>t <strong>of</strong><br />
comparison, we note <strong>the</strong> follow<strong>in</strong>g mar<strong>in</strong>e tourism<br />
shares <strong>of</strong> total tourism spend<strong>in</strong>g <strong>in</strong> o<strong>the</strong>r jurisdictions<br />
- 35% Australia (Allen Consult<strong>in</strong>g Group 2004), 28%<br />
California (Kildow & Colgan 2005), 25% UK (Pugh &<br />
Sk<strong>in</strong>ner 2002) and 18% Newfoundland (Government<br />
<strong>of</strong> Newfoundland & Labrador 2005). Our 22% share<br />
appears reasonable <strong>in</strong> comparison to <strong>the</strong>se figures.
22<br />
<strong>Economic</strong> <strong>Contribution</strong> <strong>of</strong> <strong>the</strong> <strong>Oceans</strong> <strong>Sector</strong> <strong>in</strong> <strong>British</strong> <strong>Columbia</strong><br />
Table 8: B.C. Ocean-Related Recreation <strong>Economic</strong> Impacts<br />
2002 2003 2004 2005<br />
A. GROSS OUTPUT<br />
Direct Sales Value $ millions<br />
Saltwater Angl<strong>in</strong>g 550 580 610 642<br />
Cruise Ship Spend<strong>in</strong>g 270 270 270 270<br />
Ferries 392 404 433 446<br />
O<strong>the</strong>r 2,139 2,143 2,297 2,433<br />
B. ECONOMIC IMPACTS<br />
Direct Impacts<br />
3,351 3,397 3,610 3,791<br />
GDP $ millions 1,610 1,630 1,740 1,820<br />
Labour Income $ millions 1,080 1,100 1,170 1,220<br />
Employment PYs 28,500 28,800 30,100 32,200<br />
Indirect Impacts<br />
GDP $ millions 920 930 980 1,030<br />
Labour Income $ millions 580 580 620 650<br />
Employment PYs 14,600 14,700 15,700 16,500<br />
Induced Impacts<br />
GDP $ millions 660 670 710 750<br />
Labour Income $ millions 400 400 430 450<br />
Employment PYs 10,800 10,800 11,200 11,500<br />
Total Impacts<br />
GDP $ millions 3,190 3,230 3,430 3,600<br />
Labour Income $ millions 2,060 2,080 2,220 2,320<br />
Employment PYs 53,900 54,300 57,000 60,200<br />
Source: Gross Output - Appendix G.<br />
Impact Multipliers - Appendix M.<br />
Regional Employment. The ocean recreation<br />
sector creates employment <strong>in</strong> a variety <strong>of</strong> coastal<br />
communities. We estimate <strong>the</strong> regional distribution<br />
<strong>of</strong> employment to be: 10% North, 50% Vancouver<br />
Island, and 40% Lower Ma<strong>in</strong>land.<br />
<strong>Economic</strong> Impacts. The mar<strong>in</strong>e recreation or leisure<br />
sector <strong>in</strong> B.C. had 2005 revenues <strong>of</strong> $3.8 billion,<br />
contributed $1.8 million to prov<strong>in</strong>cial GDP and $1.2<br />
billion to prov<strong>in</strong>cial Labour Income, and employed<br />
32,200 people on a person-year basis.<br />
3.7 Ocean Transport<br />
def<strong>in</strong>ition. The B.C. ocean transport <strong>in</strong>dustry <strong>in</strong>volves<br />
<strong>the</strong> shipp<strong>in</strong>g <strong>of</strong> freight plus <strong>the</strong> wide variety <strong>of</strong><br />
services required to support <strong>the</strong> shipp<strong>in</strong>g activities<br />
e.g., ports, tugboats, pilotage etc (but ferry services<br />
are treated as part <strong>of</strong> <strong>the</strong> ocean recreation sector).<br />
The ocean transport sector, for this study, also<br />
<strong>in</strong>cludes a wide variety <strong>of</strong> ancillary services such as<br />
import/export, freight forward<strong>in</strong>g, maritime law,<br />
bunker fuel sales, mar<strong>in</strong>e eng<strong>in</strong>eer<strong>in</strong>g and o<strong>the</strong>rs. We<br />
have also <strong>in</strong>cluded <strong>the</strong> important <strong>British</strong> <strong>Columbia</strong><br />
supplier role for cruise ships operat<strong>in</strong>g from B.C. ports<br />
(<strong>the</strong> Alaska cruise ships are foreign-flagged so that<br />
<strong>the</strong>ir direct employment, capital returns etc are not<br />
considered part <strong>of</strong> B.C. impacts).<br />
The ocean transport sector <strong>the</strong>n <strong>in</strong>cludes:<br />
h shipp<strong>in</strong>g and support activities to shipp<strong>in</strong>g e.g.,<br />
pilotage, tugs<br />
h cruise ship suppliers, and<br />
h o<strong>the</strong>r services e.g., ship chandlery, maritime law<br />
Activities & Outputs. Over 70 ports along <strong>the</strong> coast<br />
handle <strong>in</strong> excess <strong>of</strong> 120 million tonnes <strong>of</strong> domestic<br />
and <strong>in</strong>ternational mar<strong>in</strong>e cargo annually. The six port<br />
authorities - Vancouver, Fraser River, North Fraser,<br />
Pr<strong>in</strong>ce Rupert, Nanaimo and Port Alberni - handle <strong>in</strong><br />
excess <strong>of</strong> 75% <strong>of</strong> <strong>the</strong> total. The cargo traffic <strong>in</strong>cludes<br />
a wide variety <strong>of</strong> bulk, break bulk and conta<strong>in</strong>er
<strong>Economic</strong> <strong>Contribution</strong> <strong>of</strong> <strong>the</strong> <strong>Oceans</strong> <strong>Sector</strong> <strong>in</strong> <strong>British</strong> <strong>Columbia</strong> 23<br />
traffic e.g., gra<strong>in</strong>s, forest products, m<strong>in</strong>erals, coal,<br />
seafood, automobiles etc. The Vancouver Port<br />
is by far <strong>the</strong> largest with over half <strong>the</strong> prov<strong>in</strong>cial<br />
traffic total (Figure 3). The network <strong>of</strong> ports is also<br />
important for coastal deliveries <strong>of</strong> goods to a variety<br />
<strong>of</strong> communities.<br />
Tugboat and barge operations are critical to a wide<br />
variety <strong>of</strong> <strong>in</strong>dustries, <strong>in</strong> particular <strong>the</strong> forest <strong>in</strong>dustry.<br />
The vast majority <strong>of</strong> tugs <strong>in</strong>volved <strong>in</strong> forest operations<br />
are third party contractors and are <strong>the</strong>refore <strong>in</strong>cluded<br />
<strong>in</strong> <strong>the</strong> ocean transport sector.<br />
data Adjustment & Assumptions. There is very<br />
little data available from Statistics Canada as to <strong>the</strong><br />
revenue base <strong>of</strong> <strong>the</strong> ocean transport sector <strong>in</strong> B.C. -<br />
data are suppressed for prov<strong>in</strong>ces <strong>in</strong> publications due<br />
to confidentiality concerns.<br />
Figure 3: B.C. Ocean Transport Volumes and Revenues<br />
A. B.C. Port Cargo Traffic volumes<br />
million tonnes<br />
140<br />
120<br />
100<br />
80<br />
60<br />
40<br />
20<br />
0<br />
Source: Transport Canada and Appendix H.<br />
The LECG study (2004) did have a 2000 revenue<br />
estimate <strong>of</strong> shipp<strong>in</strong>g (<strong>in</strong>c. ferries) plus support<br />
services, essentially NAICS categories 483 and 4883<br />
- <strong>of</strong> $1,959 million. We subtracted a B.C. Ferries<br />
revenue figure <strong>of</strong> $365 to come to a 2000 revenue<br />
estimate exclud<strong>in</strong>g ferry operations <strong>of</strong> $1.6 billion -<br />
we <strong>the</strong>n escalated this figure to <strong>the</strong> year 2005 based<br />
on growth <strong>in</strong> <strong>the</strong> Canadian water transport sector.<br />
2000 2001 2002 2003 2004<br />
Year<br />
Vancouver Port Authority O<strong>the</strong>r Port Authority Non-Port Authorities
24<br />
<strong>Economic</strong> <strong>Contribution</strong> <strong>of</strong> <strong>the</strong> <strong>Oceans</strong> <strong>Sector</strong> <strong>in</strong> <strong>British</strong> <strong>Columbia</strong><br />
Table 9: B.C. Ocean Transport <strong>Economic</strong> Impacts<br />
2002 2003 2004 2005<br />
A. GROSS OUTPUT<br />
Direct Sales Value $ millions<br />
Shipp<strong>in</strong>g & Support Activities 1,800 1,900 2,000 2,100<br />
Cruise Ship Suppliers 410 390 390 390<br />
O<strong>the</strong>r Services 720 760 800 840<br />
2,930 3,050 3,190 3,330<br />
B. ECONOMIC IMPACTS<br />
Direct Impacts<br />
GDP $ millions 1,330 1,380 1,450 1,510<br />
Labour Income $ millions 1,040 1,080 1,130 1,180<br />
Employment PYs 19,400 19,800 20,200 20,700<br />
Indirect Impacts<br />
GDP $ millions 850 880 920 960<br />
Labour Income $ millions 590 610 640 670<br />
Employment PYs 14,100 14,400 14,700 15,100<br />
Induced Impacts<br />
GDP $ millions 650 680 710 740<br />
Labour Income $ millions 390 410 420 440<br />
Employment PYs 10,600 10,800 11,100 11,400<br />
Total Impacts<br />
GDP $ millions 2,830 2,940 3,080 3,210<br />
Labour Income $ millions 2,020 2,100 2,190 2,290<br />
Employment PYs 44,100 45,000 46,000 47,200<br />
Source: Gross Output - Shipp<strong>in</strong>g & Support: LECG (2004) escalated at rate <strong>of</strong> growth for CDN water transport output.<br />
- Cruise Ship Suppliers: BREA (2003) estimates adjusted for changes <strong>in</strong> passenger volume.<br />
Impact Multipliers - Appendix M.<br />
The Bus<strong>in</strong>ess Research & <strong>Economic</strong> Advisors (BREA)<br />
2004 study provided a figure <strong>of</strong> $390 million <strong>in</strong> 2003<br />
as expenditures <strong>in</strong> B.C. for outfitt<strong>in</strong>g cruise l<strong>in</strong>es<br />
with goods and services (cruise passenger and crew<br />
spend<strong>in</strong>g was <strong>in</strong>cluded under Ocean Recreation <strong>in</strong><br />
Section 3.6). We <strong>the</strong>n modified this for o<strong>the</strong>r years to<br />
reflect changes <strong>in</strong> passenger volumes (Table 9) and<br />
general <strong>in</strong>flation.<br />
The <strong>in</strong>itial InterVISTAS (2001) study outl<strong>in</strong>ed <strong>in</strong> detail<br />
<strong>the</strong> variety <strong>of</strong> related bus<strong>in</strong>esses tied to Vancouver<br />
Port operations e.g., bus<strong>in</strong>esses such as maritime law,<br />
import/export, shipp<strong>in</strong>g agents etc. InterVISTAS data<br />
suggest that <strong>the</strong>re are about 40 extra related personyears<br />
<strong>of</strong> employment for every 100 person-years <strong>in</strong><br />
shipp<strong>in</strong>g, pilotage, tug operations, etc. Ano<strong>the</strong>r 20<br />
extra person-years per hundred <strong>in</strong> truck<strong>in</strong>g (and still<br />
many more <strong>in</strong> rail operations) are also related to <strong>the</strong><br />
<strong>in</strong>itial 100 person-years - see Table H.5, Appendix H.<br />
For this study, we conservatively assign 40%<br />
additional activity over and above <strong>the</strong> base shipp<strong>in</strong>g<br />
and port operations to account for <strong>the</strong>se related,<br />
mar<strong>in</strong>e-dependent services (we do not <strong>in</strong>clude any<br />
truck<strong>in</strong>g or rail activity).<br />
Regional Employment. Greater Vancouver is <strong>the</strong><br />
hub <strong>of</strong> prov<strong>in</strong>cial shipp<strong>in</strong>g activity. The 2001 Census<br />
had <strong>the</strong> follow<strong>in</strong>g regional distribution <strong>of</strong> Deep Sea<br />
Transport plus Support Activities for Water Transport:<br />
4% North, 33% Vancouver Island and 63% Lower<br />
Ma<strong>in</strong>land.<br />
<strong>Economic</strong> Impacts. The direct economic impacts <strong>of</strong><br />
Ocean Transport, as def<strong>in</strong>ed for this study, are given<br />
<strong>in</strong> Table 9. These figures are substantially higher than<br />
previous estimates such as RASCL (2003) and LECG<br />
(2004) due to <strong>the</strong> <strong>in</strong>clusion <strong>of</strong> provision<strong>in</strong>g cruise<br />
ships outfitt<strong>in</strong>g and related ocean transport services.<br />
We note that Statistics Canada, <strong>in</strong> a pilot exercise,<br />
has developed a Canadian Transportation
<strong>Economic</strong> <strong>Contribution</strong> <strong>of</strong> <strong>the</strong> <strong>Oceans</strong> <strong>Sector</strong> <strong>in</strong> <strong>British</strong> <strong>Columbia</strong> 25<br />
Satellite Account (CTSA) – <strong>in</strong>volv<strong>in</strong>g both “forhire”<br />
transportation <strong>in</strong>dustries, such as Water<br />
Transport and Support Services, and “own account”<br />
transportation service commodities e.g., tugboat<br />
and water taxis operated by a forest, m<strong>in</strong><strong>in</strong>g or o<strong>the</strong>r<br />
company (Transport Canada, “Transportation <strong>in</strong><br />
Canada – Annual Report”, 2005 p. 13-14). Statistics<br />
Canada found that <strong>the</strong> “own account” activity, not<br />
traditionally considered part <strong>of</strong> Ocean Transport,<br />
exceeded <strong>the</strong> “for hire” component <strong>of</strong> Ocean<br />
Transport nationally. This implies that traditional<br />
approaches to measur<strong>in</strong>g Ocean Transport economic<br />
activity can result <strong>in</strong> severe underestimates.<br />
3.8 O<strong>the</strong>r Ocean <strong>Sector</strong>s<br />
There are many o<strong>the</strong>r sectors <strong>in</strong> <strong>the</strong> B.C. economy<br />
that are dependent on <strong>the</strong> ocean environment.<br />
However, most <strong>of</strong> <strong>the</strong>se sectors will be addressed<br />
implicitly <strong>in</strong> <strong>the</strong> analysis <strong>of</strong> <strong>in</strong>direct supplier impacts<br />
to follow <strong>in</strong> Section 5. For example, many sectors<br />
have active <strong>in</strong>dustry associations. These associations<br />
<strong>in</strong>clude: <strong>the</strong> B.C. Seafood Alliance, <strong>the</strong> B.C. Salmon<br />
Farmers Association, <strong>the</strong> B.C. Shellfish Growers<br />
Association, <strong>the</strong> Sport Fish<strong>in</strong>g Institute, <strong>the</strong> Chamber<br />
<strong>of</strong> Shipp<strong>in</strong>g, <strong>the</strong> Council <strong>of</strong> Mar<strong>in</strong>e Carriers, <strong>the</strong><br />
Northwest Cruise Ship Association, <strong>the</strong> Forest Council<br />
<strong>of</strong> B.C., <strong>the</strong> Council <strong>of</strong> Tourism Associations (COTA),<br />
<strong>the</strong> B.C. Yacht Build<strong>in</strong>g Association and a myriad <strong>of</strong><br />
o<strong>the</strong>rs.<br />
These associations receive fund<strong>in</strong>g from two ma<strong>in</strong><br />
sources: 1) levies on members, and 2) government<br />
grants. These two sources <strong>of</strong> funds <strong>in</strong> turn comprise<br />
expenditures by parent private and public sector<br />
entities - and <strong>the</strong> impacts <strong>of</strong> <strong>the</strong>se expenditures<br />
on <strong>the</strong> economy are <strong>in</strong>cluded <strong>in</strong> <strong>the</strong> forthcom<strong>in</strong>g<br />
analysis <strong>of</strong> <strong>in</strong>direct impacts (see Section 5).
26<br />
<strong>Economic</strong> <strong>Contribution</strong> <strong>of</strong> <strong>the</strong> <strong>Oceans</strong> <strong>Sector</strong> <strong>in</strong> <strong>British</strong> <strong>Columbia</strong><br />
4.0 The B.C. Ocean Economy –<br />
Public & non-Government <strong>Sector</strong>s<br />
Many public (government) and non-government<br />
sector activities are tied to <strong>the</strong> promotion and<br />
regulation <strong>of</strong> ocean-based bus<strong>in</strong>ess activities,<br />
ocean-related education and research, and ocean<br />
environmental stewardship. This <strong>in</strong>cludes <strong>the</strong> work<br />
<strong>of</strong> federal and prov<strong>in</strong>cial governments, academic<br />
and research <strong>in</strong>stitutions, and environmental nongovernment<br />
organizations (ENGOs).<br />
For this study, special surveys and/or <strong>in</strong>terviews<br />
were conducted with public sector representatives<br />
because data were not available from Statistics<br />
Canada or BC Stats at <strong>the</strong> level <strong>of</strong> detail required. A<br />
special effort was made to have <strong>the</strong>se representatives<br />
isolate <strong>the</strong> mar<strong>in</strong>e component <strong>of</strong> <strong>the</strong>ir expenditures<br />
ra<strong>the</strong>r than to arbitrarily allocate <strong>the</strong> total budgets <strong>of</strong><br />
<strong>the</strong>se organizations to <strong>the</strong> ocean.<br />
The surveys <strong>of</strong> federal and prov<strong>in</strong>cial agencies,<br />
universities and research <strong>in</strong>stitutions, and ENGOs<br />
represent a considerable improvement over past<br />
efforts to measure <strong>the</strong> public and non-government<br />
sector components <strong>of</strong> <strong>the</strong> ocean economy <strong>in</strong> Canada.<br />
4.1 federal Government<br />
Activities. The Department <strong>of</strong> Fisheries and <strong>Oceans</strong><br />
(DFO) has <strong>the</strong> lead oceans role and is responsible for<br />
co-ord<strong>in</strong>at<strong>in</strong>g federal policies and programs related<br />
to <strong>the</strong> oceans. DFO operates <strong>the</strong> Canadian Coast<br />
Guard, undertakes extensive mar<strong>in</strong>e science and<br />
fisheries management activities, conducts policy<br />
plann<strong>in</strong>g, and operates two major research <strong>in</strong>stitutes<br />
– <strong>the</strong> Pacific Biological Station <strong>in</strong> Nanaimo and <strong>the</strong><br />
Institute for Ocean Sciences <strong>in</strong> Sidney.<br />
The Department <strong>of</strong> National Defence (DND) operates<br />
<strong>the</strong> CFB Esquimalt naval facility. Facility staff<br />
undertake sovereignty patrols, security operations,<br />
search and rescue, and naval exercises as well as<br />
operat<strong>in</strong>g a major eng<strong>in</strong>eer<strong>in</strong>g/ma<strong>in</strong>tenance naval<br />
shipyard.<br />
Transport Canada’s direct <strong>in</strong>volvement <strong>in</strong> mar<strong>in</strong>e<br />
activities decreased substantially after <strong>the</strong> devolution<br />
<strong>of</strong> port operations to Port Authorities across Canada<br />
<strong>in</strong> <strong>the</strong> late 1990s. There are six such authorities <strong>in</strong> B.C.<br />
Never<strong>the</strong>less, <strong>the</strong> Department is still <strong>in</strong>volved <strong>in</strong> <strong>the</strong><br />
regulation, <strong>in</strong>spection, and certification <strong>of</strong> ships and<br />
boats for both Canadian and foreign-flagged vessels.<br />
It also subsidizes coastal ferry operations <strong>in</strong> B.C.<br />
through a direct grant.<br />
These three departments traditionally have<br />
comprised 85-90% <strong>of</strong> federal government mar<strong>in</strong>erelated<br />
expenditures <strong>in</strong> <strong>the</strong> prov<strong>in</strong>ce. O<strong>the</strong>r<br />
departments also play an ocean sector role,<br />
<strong>in</strong>clud<strong>in</strong>g:<br />
h Service Canada (formerly HRDC) – runs a special<br />
Employment Insurance program for commercial<br />
fishermen (<strong>in</strong> <strong>the</strong> 1998-2001 period <strong>the</strong><br />
Department spent significant monies on <strong>the</strong><br />
Pacific Fisheries Restructur<strong>in</strong>g and Adjustment<br />
Program, a program now lapsed)<br />
h Western <strong>Economic</strong> Diversification (WD) – provides<br />
grants for mar<strong>in</strong>e bus<strong>in</strong>esses and bus<strong>in</strong>ess<br />
assistance analyses e.g., cruise ship and port<br />
developments<br />
h Parks Canada – operates three national parks<br />
along <strong>the</strong> Pacific Coast <strong>in</strong> B.C. (Pacific Rim<br />
National Park, Gwaii Haanas National Park<br />
Reserve and Haida Heritage Site, Gulf Islands<br />
National Park Reserve) which have a direct or<br />
<strong>in</strong>direct connection with <strong>the</strong> adjacent ocean;<br />
Parks Canada reports to <strong>the</strong> M<strong>in</strong>ister <strong>of</strong> <strong>the</strong><br />
Environment<br />
h Environment Canada – delivers science and<br />
programm<strong>in</strong>g related to conservation and<br />
protection <strong>of</strong> ecosystems and species, mar<strong>in</strong>e<br />
pollution prevention and remediation,<br />
wea<strong>the</strong>r and environmental prediction, and<br />
environmental assessment
<strong>Economic</strong> <strong>Contribution</strong> <strong>of</strong> <strong>the</strong> <strong>Oceans</strong> <strong>Sector</strong> <strong>in</strong> <strong>British</strong> <strong>Columbia</strong> 27<br />
Table 10: Federal Government Ocean-Related Expenditures <strong>in</strong> B.C.<br />
$ millions<br />
2002 2003 2004 2005<br />
Federal Departments<br />
CDN Food Inspection Agency 2 3 3 3<br />
DFO 260 238 257 258<br />
DND 384 388 416 427<br />
Environment Canada 6 7 6 6<br />
NRCan 1 1 2 2<br />
Parks Canada 11 12 13 13<br />
Service Canada (formerly HRDC) 36 37 36 33<br />
Transport Canada 28 28 38 29<br />
WD 2 4 3 35<br />
NSERC & SCHRC Grants etc. 3 4 4 5<br />
O<strong>the</strong>r 39 38 41 43<br />
Total 772 760 819 854<br />
Source: Departmental representatives (see material <strong>in</strong> Appendix I for <strong>in</strong>dividual departments).<br />
Notes: 1. DFO expenditures exclude freshwater component & capture only 50% <strong>of</strong> SEP-related expenditures, DND expenditures exclude activity related<br />
to o<strong>the</strong>r branches <strong>of</strong> <strong>the</strong> Armed Forces e.g., airbase <strong>of</strong> CFB Comox.<br />
2. Service Canada expenditures are special Employment Insurance (EI) payments to fishermen.<br />
3. Transport Canada expenditures are primarily <strong>the</strong> federal subsidy to B.C. Ferries (a small share <strong>of</strong> total Canadian mar<strong>in</strong>e expenditures by<br />
Transport Canada have been <strong>in</strong>cluded as well).<br />
4. Excludes capital expenditures.<br />
5. Supplementary Labour Income or Benefits estimated as 20% <strong>of</strong> Wages & Salaries.<br />
6. “o<strong>the</strong>r” estimated as 5% <strong>of</strong> total.<br />
7. The $35 million WD expenditure <strong>in</strong> 2005/06 <strong>in</strong>cludes $30 million for <strong>the</strong> Pr<strong>in</strong>ce Rupert Conta<strong>in</strong>er Term<strong>in</strong>al Development.<br />
Table 11: Federal Government Ocean-Related <strong>Economic</strong> Impacts<br />
2002 2003 2004 2005<br />
A. GROSS OUTPUT<br />
Direct Expenditures $ millions<br />
Subsidies/Transfersa 60 61 60 58<br />
O<strong>the</strong>r 712 699 759 796<br />
772 760 819 854<br />
B. ECONOMIC IMPACTS<br />
Direct Impacts<br />
GDP $ millions 530 535 555 580<br />
Labour Income $ millions 530 535 555 580<br />
Employment person-years<br />
Indirect Impacts<br />
6,870 6,880 6,770 7,010<br />
GDP $ millions 85 84 91 96<br />
Labour Income $ millions 64 63 68 72<br />
Employment person-years<br />
Induced Impacts<br />
1,570 1,540 1,640 1,680<br />
GDP $ millions 240 240 250 260<br />
Labour Income $ millions 145 145 150 155<br />
Employment person-years<br />
Total Impacts<br />
3,880 3,830 3,910 4,010<br />
GDP $ millions 855 859 896 936<br />
Labour Income $ millions 739 743 773 807<br />
Employment person-years 12,320 12,250 12,320 12,700<br />
a B.C. Ferries subsidy plus special Employment Insurance payments to fishermen.<br />
Source: Expenditures - survey <strong>of</strong> federal government departments.<br />
Impact Multipliers - Appendix M.
28<br />
<strong>Economic</strong> <strong>Contribution</strong> <strong>of</strong> <strong>the</strong> <strong>Oceans</strong> <strong>Sector</strong> <strong>in</strong> <strong>British</strong> <strong>Columbia</strong><br />
h Agriculture and Agri-Food Canada (AAFC) –<br />
delivers a seafood <strong>in</strong>spection program under <strong>the</strong><br />
Canadian Food Inspection Agency<br />
h Natural Resources Canada (NRCan) – conducts<br />
scientific and economic analysis <strong>of</strong> potential<br />
<strong>of</strong>fshore energy and m<strong>in</strong>eral resources and<br />
operates Geomatics Canada<br />
In addition, <strong>the</strong> Natural Science and Eng<strong>in</strong>eer<strong>in</strong>g<br />
Research Council <strong>of</strong> Canada (NSERC) and <strong>the</strong> Social<br />
Sciences and Humanities Research Council <strong>of</strong> Canada<br />
(SSHRC) support scholarships, fellowships and prizes,<br />
research chairs, and targeted research at B.C. post<br />
secondary <strong>in</strong>stitutions.<br />
Expenditures. Table 10 displays estimated oceanrelated<br />
expenditures <strong>of</strong> various federal government<br />
departments (see Appendix 1 for fur<strong>the</strong>r details). The<br />
2005 ocean expenditures by all federal departments<br />
were an estimated $854 million.<br />
<strong>Economic</strong> Impacts. The federal government<br />
economic impacts are given <strong>in</strong> Table 11.<br />
4.2 Prov<strong>in</strong>cial Government<br />
Activities. The B.C. government contributes to<br />
<strong>the</strong> ocean sector economy through its primary<br />
jurisdiction over prov<strong>in</strong>cial resources and shared<br />
responsibilities for commercial fisheries and o<strong>the</strong>r<br />
mar<strong>in</strong>e resources. Areas <strong>of</strong> exclusive prov<strong>in</strong>cial<br />
jurisdiction <strong>in</strong>clude <strong>the</strong> seabed <strong>of</strong> <strong>the</strong> Strait <strong>of</strong><br />
Georgia, and <strong>the</strong> seabed with<strong>in</strong> <strong>the</strong> “jaws <strong>of</strong> land”.<br />
The Prov<strong>in</strong>ce has <strong>the</strong> authority to issue tenures for<br />
temporary and permanent uses on Crown foreshore<br />
and seabed, and it regulates discharges to <strong>the</strong> ocean,<br />
aquaculture operations, and designates protected<br />
areas.<br />
As <strong>the</strong> lead agency for aquaculture <strong>in</strong> B.C., <strong>the</strong><br />
M<strong>in</strong>istry <strong>of</strong> Agriculture and Lands (MAL) develops<br />
policy, issues aquaculture licences, conducts<br />
compliance reviews <strong>of</strong> site management plans,<br />
<strong>in</strong>spects exist<strong>in</strong>g and proposed sites, and collects<br />
facility report<strong>in</strong>g data, among o<strong>the</strong>r duties. MAL’s<br />
Integrated Land Management Bureau (ILMB) created<br />
<strong>in</strong> 2005 leads mar<strong>in</strong>e and coastal zone plann<strong>in</strong>g for<br />
<strong>the</strong> prov<strong>in</strong>ce.<br />
The M<strong>in</strong>istry <strong>of</strong> <strong>Economic</strong> Development (MED) supports<br />
some mar<strong>in</strong>e-related projects and policies through<br />
its <strong>Economic</strong> Competitiveness Division. Fund<strong>in</strong>g <strong>in</strong><br />
<strong>the</strong> last several years has gone to mar<strong>in</strong>e museum<br />
expansion, policy development and feasibility studies<br />
(e.g., for B.C. ports, term<strong>in</strong>al facilities), and various<br />
capital projects and assessments funded prov<strong>in</strong>cially<br />
or with <strong>the</strong> federal government (e.g., cruise ship<br />
term<strong>in</strong>als, public wharves).<br />
The M<strong>in</strong>istry <strong>of</strong> Energy, M<strong>in</strong>es and Petroleum<br />
Resource’s (MEMPR’s) Offshore Oil and Gas Branch<br />
was established <strong>in</strong> May 2003 to help develop B.C.’s<br />
<strong>of</strong>fshore resources <strong>in</strong> a scientifically sound and<br />
environmentally responsible manner. Recently,<br />
<strong>the</strong> M<strong>in</strong>istry’s Alternative Energy Policy Branch has<br />
turned its attention to ocean (wave, w<strong>in</strong>d, and tidal)<br />
energy, given <strong>the</strong> grow<strong>in</strong>g <strong>in</strong>terest <strong>in</strong> develop<strong>in</strong>g<br />
B.C.’s resource potential. In 2005/06, fund<strong>in</strong>g went<br />
to monitor<strong>in</strong>g equipment for <strong>the</strong> Race Rocks tidal<br />
energy demonstration and work cont<strong>in</strong>ues with<br />
ILMB on a Crown land tenure policy for ocean energy<br />
projects.<br />
The M<strong>in</strong>istry <strong>of</strong> Environment’s (MOE’s) Ocean and<br />
Mar<strong>in</strong>e Fisheries Division was created <strong>in</strong> June 2005.<br />
The new Division brought toge<strong>the</strong>r <strong>the</strong> commercial<br />
fisheries and seafood development responsibilities<br />
formerly under <strong>the</strong> M<strong>in</strong>istry <strong>of</strong> Agriculture, Food<br />
and Fisheries (now MAL) with a greater focus on<br />
coord<strong>in</strong>at<strong>in</strong>g B.C.’s diverse <strong>in</strong>terests <strong>in</strong> mar<strong>in</strong>e<br />
resources. Prov<strong>in</strong>cial work on mar<strong>in</strong>e fisheries and<br />
seafood development has <strong>in</strong>cluded support for <strong>the</strong><br />
Pacific Salmon Forum, a program to reduce discards<br />
<strong>in</strong> groundfish fisheries, market<strong>in</strong>g <strong>of</strong> B.C. seafood<br />
at <strong>in</strong>ternational trade fairs, and major reports on<br />
seafood traceability and susta<strong>in</strong>ability.<br />
Elsewhere <strong>in</strong> <strong>the</strong> M<strong>in</strong>istry, <strong>the</strong>re are ocean-related<br />
activities underway, <strong>in</strong>clud<strong>in</strong>g <strong>the</strong> regulation <strong>of</strong><br />
f<strong>in</strong>fish aquaculture waste, emergency preparedness<br />
for mar<strong>in</strong>e oil spills, <strong>the</strong> development and monitor<strong>in</strong>g<br />
<strong>of</strong> coastal environmental <strong>in</strong>dicators, and <strong>the</strong><br />
cont<strong>in</strong>u<strong>in</strong>g development and management <strong>of</strong><br />
a prov<strong>in</strong>cial mar<strong>in</strong>e protected area system. Key<br />
oceans programs <strong>in</strong>clude lead<strong>in</strong>g <strong>the</strong> development<br />
<strong>of</strong> prov<strong>in</strong>cial oceans <strong>in</strong>terests and objectives,<br />
creat<strong>in</strong>g collaborative prov<strong>in</strong>cial-federal resource<br />
management strategies, and develop<strong>in</strong>g shared<br />
governance frameworks.<br />
The M<strong>in</strong>istry <strong>of</strong> Tourism, Sport and <strong>the</strong> Arts (MTSA) is<br />
implement<strong>in</strong>g a program to double tourism revenues<br />
<strong>in</strong> B.C. Recent ocean-focused activities have <strong>in</strong>cluded<br />
development work on <strong>the</strong> cruise ship <strong>in</strong>dustry, <strong>the</strong><br />
facilitation <strong>of</strong> tenure applications for mar<strong>in</strong>e resorts<br />
and mar<strong>in</strong>e-based adventure tourism (e.g., guided<br />
sea kayak<strong>in</strong>g, bear view<strong>in</strong>g), a mar<strong>in</strong>e trail strategy, an<br />
angler market development plan, and research and<br />
data analysis on mar<strong>in</strong>e tourism and recreation.<br />
As <strong>the</strong> Crown agency responsible for tourism<br />
market<strong>in</strong>g, Tourism B.C. is <strong>in</strong>volved <strong>in</strong> a number <strong>of</strong><br />
mar<strong>in</strong>e-focused <strong>in</strong>itiatives, <strong>in</strong>clud<strong>in</strong>g <strong>the</strong> promotion
<strong>Economic</strong> <strong>Contribution</strong> <strong>of</strong> <strong>the</strong> <strong>Oceans</strong> <strong>Sector</strong> <strong>in</strong> <strong>British</strong> <strong>Columbia</strong> 29<br />
<strong>of</strong> tidal angl<strong>in</strong>g, coastal cruises, and mar<strong>in</strong>e adventure<br />
tourism, as well as research and track<strong>in</strong>g for key<br />
bus<strong>in</strong>ess sectors (e.g., sea kayak<strong>in</strong>g, scuba div<strong>in</strong>g,<br />
nature-based commercial tourism). Moreover, much<br />
<strong>of</strong> its general market<strong>in</strong>g and promotion <strong>of</strong> specific<br />
dest<strong>in</strong>ations, <strong>in</strong>clud<strong>in</strong>g Vancouver and Victoria,<br />
features <strong>the</strong> ocean environment – for example, whale<br />
view<strong>in</strong>g and storm watch<strong>in</strong>g – <strong>in</strong> its images and<br />
brand<strong>in</strong>g.<br />
The Mar<strong>in</strong>e Branch <strong>of</strong> <strong>the</strong> M<strong>in</strong>istry <strong>of</strong> Transportation<br />
(MOT) oversees <strong>the</strong> coastal ferry services contract<br />
between <strong>the</strong> Prov<strong>in</strong>ce and <strong>the</strong> now <strong>in</strong>dependently<br />
operated <strong>British</strong> <strong>Columbia</strong> Ferry Corporation (B.C.<br />
Ferries).<br />
BC Hydro spent $16 million over 1999 to 2003 on<br />
a variety <strong>of</strong> Water Use Plans (WUPs) associated<br />
with hydroelectric developments - WUPs are plans<br />
to <strong>in</strong>crease water flows to protect fish stocks e.g.,<br />
Cheakamus, Campbell River, Puntledge River. BC<br />
Hydro also spent $1-2 million annually on <strong>the</strong> fish<br />
components <strong>of</strong> <strong>the</strong> Bridge River Compensation<br />
Program (50% <strong>of</strong> WUP and compensation program<br />
dollars are allocated to <strong>the</strong> ocean sector).<br />
The B.C. Innovation Council is a Crown Corporation<br />
created <strong>in</strong> October 2004 (from a merger between<br />
<strong>the</strong> Innovation and Science Council <strong>of</strong> B.C.<br />
and <strong>the</strong> Advanced Systems Institute <strong>of</strong> B.C.) to<br />
accelerate science and technology-based economic<br />
development. Key ocean <strong>in</strong>itiatives <strong>in</strong>clude<br />
sector development activities <strong>in</strong> aquaculture and<br />
fisheries science, ocean energy (<strong>in</strong>clud<strong>in</strong>g <strong>the</strong><br />
Ocean Renewable Energy Group or OREG), ocean<br />
and maritime eng<strong>in</strong>eer<strong>in</strong>g, maritime and port<br />
security technologies and ocean observ<strong>in</strong>g systems<br />
technologies.<br />
Expenditures. Ocean-related expenditures for <strong>the</strong>se<br />
prov<strong>in</strong>cial m<strong>in</strong>istries and agencies are presented <strong>in</strong><br />
Table 12 (see details <strong>in</strong> Appendix J). Total prov<strong>in</strong>cial<br />
government expenditures were $153 million <strong>in</strong> 2005.<br />
<strong>Economic</strong> Impacts. The economic impacts for <strong>the</strong><br />
prov<strong>in</strong>cial government are shown <strong>in</strong> Table 13.<br />
The bulk <strong>of</strong> prov<strong>in</strong>cial expenditures is <strong>the</strong> B.C. Ferries<br />
subsidy, which does not create GDP, Wages, and<br />
Employment. That expla<strong>in</strong>s why <strong>the</strong> impacts are<br />
relatively modest. (The subsidy is <strong>in</strong>cluded, however,<br />
<strong>in</strong> <strong>the</strong> GDP calculation for B.C. Ferries operations as<br />
part <strong>of</strong> <strong>the</strong> Ocean Recreation sector – see Section 3.6).<br />
4.3 university and Research Institutions<br />
Several major universities, colleges, and research<br />
organizations were contacted to ga<strong>the</strong>r data for<br />
this study. Of <strong>the</strong>se, two (<strong>the</strong> University <strong>of</strong> Nor<strong>the</strong>rn<br />
<strong>British</strong> <strong>Columbia</strong> and Royal Roads University<br />
<strong>in</strong> Victoria) <strong>in</strong>dicated that <strong>the</strong>ir mar<strong>in</strong>e-related<br />
expenditures were not large.<br />
Table 12: B.C. Prov<strong>in</strong>cial Government Ocean <strong>Sector</strong> Expenditures<br />
$ millions<br />
2002/03 2003/04 2004/05 2005/06<br />
Prov<strong>in</strong>cial M<strong>in</strong>istries/Agencies<br />
M<strong>in</strong>istry <strong>of</strong> Agriculture and Lands 8 8 8 11<br />
M<strong>in</strong>istry <strong>of</strong> <strong>Economic</strong> Development
30<br />
<strong>Economic</strong> <strong>Contribution</strong> <strong>of</strong> <strong>the</strong> <strong>Oceans</strong> <strong>Sector</strong> <strong>in</strong> <strong>British</strong> <strong>Columbia</strong><br />
Table 13: Prov<strong>in</strong>cial Government Ocean-Related <strong>Economic</strong> Impacts<br />
2002 2003 2004 2005<br />
A. GROSS OUTPUT<br />
Direct Expenditures $ millions<br />
Subsidies/Transfersa 74 106 107 108<br />
O<strong>the</strong>r 29 35 44 45<br />
103 141 151 153<br />
B. ECONOMIC IMPACTS<br />
Direct Impacts<br />
GDP $ millions 20 25 31 32<br />
Labour Income $ millions 20 25 31 32<br />
Employment person-years<br />
Indirect Impacts<br />
300 350 430 430<br />
GDP $ millions 4 5 7 7<br />
Labour Income $ millions 3 4 4 5<br />
Employment person-years<br />
Induced Impacts<br />
75 90 110 110<br />
GDP $ millions 9 11 14 14<br />
Labour Income $ millions 6 7 8 9<br />
Employment person-years<br />
Total Impacts<br />
150 180 220 220<br />
GDP $ millions 33 41 52 53<br />
Labour Income $ millions 29 36 43 46<br />
Employment person-years<br />
a Prov<strong>in</strong>cial subsidy to B.C. Ferries.<br />
525 620 760 760<br />
Source: Expenditures - survey <strong>of</strong> prov<strong>in</strong>cial government departments.<br />
Impact Multipliers - Appendix M.<br />
Activities. The <strong>British</strong> <strong>Columbia</strong> Institute <strong>of</strong><br />
Technology’s School <strong>of</strong> Transportation provides<br />
tra<strong>in</strong><strong>in</strong>g <strong>in</strong> navigation, mar<strong>in</strong>e eng<strong>in</strong>eer<strong>in</strong>g, nautical<br />
sciences, seamanship, and maritime security. Its<br />
Pacific Mar<strong>in</strong>e Tra<strong>in</strong><strong>in</strong>g Campus <strong>in</strong> North Vancouver<br />
<strong>in</strong>cludes laboratories, tanks, and simulators to<br />
support this tra<strong>in</strong><strong>in</strong>g.<br />
Malasp<strong>in</strong>a University-College <strong>in</strong> Nanaimo<br />
<strong>of</strong>fers tra<strong>in</strong><strong>in</strong>g for fisheries, aquaculture, and<br />
resource management technicians and prepares<br />
undergraduate students for graduate degrees <strong>in</strong><br />
mar<strong>in</strong>e sciences. Recent research has been focused <strong>in</strong><br />
areas rang<strong>in</strong>g from <strong>the</strong> detection and quantification<br />
<strong>of</strong> shellfish tox<strong>in</strong>s to succession <strong>in</strong> kelp forest<br />
communities. There are three mar<strong>in</strong>e-related research<br />
<strong>in</strong>stitutions affiliated with Malasp<strong>in</strong>a and/or located<br />
on <strong>the</strong> campus:<br />
h Centre for Coastal Health – an <strong>in</strong>dependent, non-<br />
pr<strong>of</strong>it organization <strong>in</strong>vestigat<strong>in</strong>g <strong>the</strong> <strong>in</strong>teractions<br />
<strong>of</strong> human, animal, and environmental health<br />
h Centre for Shellfish Research – engaged <strong>in</strong><br />
research and development, tra<strong>in</strong><strong>in</strong>g, and<br />
technology transfer for <strong>the</strong> shelffish aquaculture<br />
<strong>in</strong>dustry<br />
h Institute for Coastal Research – an<br />
<strong>in</strong>terdiscipl<strong>in</strong>ary research organization explor<strong>in</strong>g<br />
<strong>the</strong> physical, ecological, and social dynamics <strong>of</strong><br />
<strong>the</strong> B.C. Coast<br />
Among <strong>the</strong>ir recent activities, <strong>the</strong>se research<br />
centres have been <strong>in</strong>volved <strong>in</strong> West Nile and avian<br />
flu surveillance, shellfish aquaculture research and<br />
tra<strong>in</strong><strong>in</strong>g for First Nations, and <strong>the</strong> development <strong>of</strong> an<br />
aquaculture web portal.<br />
Simon Fraser University takes part <strong>in</strong> mar<strong>in</strong>e education<br />
and research through its Biological Sciences<br />
Department. In 2005, <strong>the</strong> Tom Buell Chair <strong>in</strong> Aquatic<br />
Conservation was established, with an <strong>in</strong>itial focus on<br />
salmon species and <strong>the</strong>ir ecosystems. SFU’s School for<br />
Resource and Environmental Management (SREM),<br />
through <strong>the</strong> Fisheries Science and Management<br />
Research Group, conducts research on mar<strong>in</strong>e<br />
fisheries and related areas, such as mar<strong>in</strong>e mammals,<br />
<strong>in</strong>vertebrates, and <strong>the</strong>ir habitats. Recent expenditures<br />
have <strong>in</strong>cluded <strong>the</strong> purchase <strong>of</strong> a mar<strong>in</strong>e research<br />
vessel and a remotely operated underwater vehicle.<br />
The Cooperative Resource Management Institute on<br />
<strong>the</strong> SFU Burnaby Campus br<strong>in</strong>gs toge<strong>the</strong>r SFU faculty<br />
from various discipl<strong>in</strong>es with DFO staff to provide
<strong>Economic</strong> <strong>Contribution</strong> <strong>of</strong> <strong>the</strong> <strong>Oceans</strong> <strong>Sector</strong> <strong>in</strong> <strong>British</strong> <strong>Columbia</strong> 31<br />
research and policy advice on fisheries management<br />
issues. The Centre for Coastal Studies is coord<strong>in</strong>at<strong>in</strong>g<br />
<strong>the</strong> L<strong>in</strong>k<strong>in</strong>g Science and Local Knowledge node<br />
<strong>of</strong> <strong>the</strong> national Ocean Management Research<br />
Network funded by DFO and <strong>the</strong> Social Sciences and<br />
Humanities Research Council.<br />
The University <strong>of</strong> <strong>British</strong> <strong>Columbia</strong>’s ocean-related<br />
education and research is focused <strong>in</strong> several<br />
key areas. The Department <strong>of</strong> Earth and Ocean<br />
Sciences <strong>of</strong>fers degrees <strong>in</strong> oceanography and carries<br />
out research <strong>in</strong> ocean physics, oceanographic<br />
measurement, and measur<strong>in</strong>g biological activity <strong>in</strong><br />
mar<strong>in</strong>e waters. The Civil Eng<strong>in</strong>eer<strong>in</strong>g Department’s<br />
Coastal and Ocean Eng<strong>in</strong>eer<strong>in</strong>g Program is concerned<br />
with <strong>the</strong> design <strong>of</strong> <strong>of</strong>fshore structures and <strong>the</strong><br />
conduct <strong>of</strong> oil recovery and o<strong>the</strong>r <strong>of</strong>fshore activities.<br />
The Zoology Department’s Fisheries and Mar<strong>in</strong>e<br />
Biology Program has research <strong>in</strong>terests rang<strong>in</strong>g from<br />
<strong>the</strong> social <strong>in</strong>teractions among mar<strong>in</strong>e mammals to<br />
<strong>the</strong> impact <strong>of</strong> human development and harvest<strong>in</strong>g<br />
on mar<strong>in</strong>e ecosystems.<br />
U.B.C.’s Fisheries Centre conducts research on <strong>the</strong><br />
restoration <strong>of</strong> fisheries, conservation <strong>of</strong> aquatic life,<br />
and <strong>the</strong> rebuild<strong>in</strong>g <strong>of</strong> mar<strong>in</strong>e ecosystems.<br />
Table 14: B.C. University & Research Institution Ocean <strong>Sector</strong> Expenditures<br />
$ millions<br />
2002/03 2003/04 2004/05 2005/06<br />
University/College/Research Centre<br />
<strong>British</strong> <strong>Columbia</strong> Institute <strong>of</strong> Technology (B.C.IT) 2 2 2 2<br />
Malasp<strong>in</strong>a University College 1 6 3 4<br />
Simon Fraser University (SFU) 2 2 2 3<br />
University <strong>of</strong> <strong>British</strong> <strong>Columbia</strong> (U.B.C.) 26 27 27 25<br />
University <strong>of</strong> Victoria (UVic) 6 7 13 21<br />
Bamfield Mar<strong>in</strong>e Sciences Centre 4 4 4 5<br />
B.C. Centre for Aquatic Health Sciences 0 0 1 1<br />
Total 41 48 52 60<br />
Source: Survey/<strong>in</strong>terviews with academic and research organization representatives.<br />
Notes: 1. Supplementary Labour Income or Benefits estimated as 20% <strong>of</strong> Wages & Salaries.<br />
2. The <strong>in</strong>crease <strong>in</strong> 2003/04 for Malasp<strong>in</strong>a College was tied to construction <strong>of</strong> a new build<strong>in</strong>g.<br />
Table 15: B.C. University & Research Ocean-Related <strong>Economic</strong> Impacts<br />
2002 2003 2004 2005<br />
A. GROSS OUTPUT<br />
Direct Expenditures $ millions 41 48 52 60<br />
B. ECONOMIC IMPACTS<br />
Direct Impacts<br />
GDP $ millions 27 31 34 39<br />
Labour Income $ millions 27 31 34 39<br />
Employment person-years<br />
Indirect Impacts<br />
275 310 330 370<br />
GDP $ millions 6 7 8 9<br />
Labour Income $ millions 3 4 4 5<br />
Employment person-years<br />
Induced Impacts<br />
85 95 100 115<br />
GDP $ millions 12 14 15 17<br />
Labour Income $ millions 7 8 9 10<br />
Employment person-years<br />
Total Impacts<br />
190 220 235 270<br />
GDP $ millions 45 52 57 65<br />
Labour Income $ millions 37 43 47 54<br />
Employment person-years<br />
Source: Expenditures - survey <strong>of</strong> educational <strong>in</strong>stitutions.<br />
Impact Multipliers - Appendix M.<br />
550 625 665 755
32<br />
<strong>Economic</strong> <strong>Contribution</strong> <strong>of</strong> <strong>the</strong> <strong>Oceans</strong> <strong>Sector</strong> <strong>in</strong> <strong>British</strong> <strong>Columbia</strong><br />
The University <strong>of</strong> Victoria has assembled one <strong>of</strong> <strong>the</strong><br />
most extensive programs <strong>in</strong> ocean sciences and<br />
mar<strong>in</strong>e technologies. Mar<strong>in</strong>e education and research<br />
is distributed over various faculties and departments,<br />
with expertise <strong>in</strong> areas such as mar<strong>in</strong>e biology<br />
and microbiology, ocean physics, remote sens<strong>in</strong>g,<br />
underwater acoustics, ocean and climate dynamics,<br />
earthquake studies, clean energy technologies, and<br />
mar<strong>in</strong>e protected areas. UVic has several mar<strong>in</strong>erelated<br />
research <strong>in</strong>stitutions <strong>in</strong>clud<strong>in</strong>g:<br />
h B.C. Centre for Applied Remote Sens<strong>in</strong>g,<br />
Modell<strong>in</strong>g, and Simulation<br />
h Canadian Centre for Climate Modell<strong>in</strong>g and<br />
Analysis<br />
h Canadian Institute for Climate Studies<br />
h Canadian Mar<strong>in</strong>e Acoustic Remote Sens<strong>in</strong>g<br />
Facility<br />
h Centre for Earth and Ocean Research<br />
h Institute for Integrated Energy Systems<br />
h Mar<strong>in</strong>e Protected Areas Research Group<br />
h Whale Research Laboratory<br />
h Aquatic Research Group<br />
h Boundary Layer Airflow and Sediment Transport<br />
Research Unit<br />
Major programs <strong>in</strong> <strong>the</strong> last several years have<br />
<strong>in</strong>cluded <strong>the</strong> NEPTUNE (North-East Pacific Timeseries<br />
Undersea Networked Experiment) and<br />
VENUS (Victoria Experimental Network Under Sea)<br />
projects, global climate modell<strong>in</strong>g, and technology<br />
development on <strong>the</strong> ROPOS (Remotely Operated<br />
Platform for Ocean Science) submersible. UVic is<br />
Canada’s leader on <strong>the</strong> $300-million <strong>in</strong>ternational<br />
NEPTUNE project to establish a high-tech underwater<br />
laboratory for monitor<strong>in</strong>g ocean floor conditions<br />
from Vancouver Island to Oregon. The Centre for<br />
Earth and Ocean Research was also <strong>in</strong>volved <strong>in</strong><br />
<strong>the</strong> Coasts Under Stress program to exam<strong>in</strong>e <strong>the</strong><br />
impacts <strong>of</strong> socio-economic restructur<strong>in</strong>g on coastal<br />
communities and ecosystems.<br />
The Bamfield Mar<strong>in</strong>e Sciences Centre <strong>in</strong> Barkley Sound<br />
is a non-pr<strong>of</strong>it educational and research organization<br />
funded by Western Canadian universities. Its major<br />
activities are university-level teach<strong>in</strong>g, school and<br />
public education programs <strong>in</strong> <strong>the</strong> field, mar<strong>in</strong>e and<br />
coastal scientific research, and applied research and<br />
technology commercialization.<br />
The new B.C. Centre for Aquatic Health Sciences <strong>in</strong><br />
Campbell River conducts research <strong>in</strong>to aquatic animal<br />
health, food safety, and environmental and welfare<br />
issues. Current projects <strong>in</strong>clude vacc<strong>in</strong>e development,<br />
fish health assessments, and First Nations tra<strong>in</strong><strong>in</strong>g <strong>in</strong><br />
sea lice and environmental monitor<strong>in</strong>g.<br />
Expenditures. Mar<strong>in</strong>e-related expenditures for<br />
academic and research <strong>in</strong>stitutions are shown <strong>in</strong><br />
Table 14. The estimated total <strong>in</strong> 2005 was $60 million.<br />
<strong>Economic</strong> Impacts. The estimated economic direct<br />
impacts for <strong>the</strong>se <strong>in</strong>stitutions are given <strong>in</strong> Table 15.<br />
4.4 Environmental Organizations<br />
There are numerous Environmental Non-Government<br />
Organizations (ENGOs) <strong>in</strong>volved <strong>in</strong> mar<strong>in</strong>erelated<br />
environmental education, research, and<br />
stewardship <strong>in</strong> B.C. These <strong>in</strong>clude larger ENGOs<br />
that are ei<strong>the</strong>r completely focused on <strong>the</strong> ocean<br />
or have significant mar<strong>in</strong>e programs underway. In<br />
addition, many smaller organizations along <strong>the</strong> Coast<br />
deliver important “on-<strong>the</strong>-ground” environmental<br />
services for <strong>the</strong>ir local areas, <strong>of</strong>ten primarily through<br />
volunteers.
<strong>Economic</strong> <strong>Contribution</strong> <strong>of</strong> <strong>the</strong> <strong>Oceans</strong> <strong>Sector</strong> <strong>in</strong> <strong>British</strong> <strong>Columbia</strong> 33<br />
Table 16: ENGO Ocean-Related Expenditures & Activities <strong>in</strong> B.C.<br />
2002 2003 2004 2005<br />
ENGO Budgets (14 organizations) $ millions<br />
Ocean-Related 20 24 26 27<br />
Non-Ocean 7 10 10 12<br />
Total 27 34 36 39<br />
ENGO Ocean Activities<br />
1. CDN Parks & Wilderness Society education & communication on mar<strong>in</strong>e conservation<br />
2. David Suzuki Foundation susta<strong>in</strong>able aquaculture & mar<strong>in</strong>e fisheries, wild salmon conservation, mar<strong>in</strong>e use plann<strong>in</strong>g & MPAs<br />
3. Ducks Unlimited Crown foreshore habitat protection, database <strong>of</strong> estuaries, waterfowl surveys & research, land acquisition, policy development<br />
4. Ecotrust Canada aquaculture & mar<strong>in</strong>e fisheries, fisheries licence bank<br />
5. Galiano Conservation Society coastal & mar<strong>in</strong>e education, MPA development<br />
6. Georgia Strait Alliance mar<strong>in</strong>e water pollution, wildlife & habitat protection, green boat<strong>in</strong>g, susta<strong>in</strong>able salmon aquaculture, mar<strong>in</strong>e stewardship<br />
7. Liv<strong>in</strong>g <strong>Oceans</strong> Society<br />
mar<strong>in</strong>e plann<strong>in</strong>g & MPA development, mar<strong>in</strong>e mapp<strong>in</strong>g & analysis, opposition to <strong>of</strong>fshore oil and gas & tanker traffic, susta<strong>in</strong>able aquaculture<br />
& fisheries<br />
8. Sea Change Mar<strong>in</strong>e Conservation mar<strong>in</strong>e education, conservation & restoration<br />
9. Sierra Club <strong>of</strong> Canada susta<strong>in</strong>able fisheries & seafood<br />
10. Straitwatch vessel monitor<strong>in</strong>g <strong>in</strong> mar<strong>in</strong>e mammal areas<br />
11. TBuck Suzuki Foundation education on <strong>the</strong> environmental impacts on fish & fish habitat<br />
12. Vancouver Aquarium aquarium, education & mar<strong>in</strong>e mammal rescues<br />
13. Ve<strong>in</strong>s <strong>of</strong> Life mar<strong>in</strong>e mammal monitor<strong>in</strong>g & beach cleanups<br />
14. World Fisheries Trust susta<strong>in</strong>able fisheries & co-management, conservation <strong>of</strong> mar<strong>in</strong>e biodiversity & equitable use<br />
Source: Survey <strong>of</strong> Environmental Non-Government Organizations (ENGOs).<br />
Note: Covers only those ENGOS contacted that were able to provide expenditure <strong>in</strong>formation.<br />
Table 17: B.C. ENGO Ocean-Related <strong>Economic</strong> Impacts<br />
2002 2003 2004 2005<br />
A. GROSS OUTPUT<br />
Direct Expenditures $ millions 20 24 26 27<br />
B. ECONOMIC IMPACTS<br />
Direct Impacts<br />
GDP $ millions 11 13 15 15<br />
Labour Income $ millions 11 13 15 15<br />
Employment person-years<br />
Indirect Impacts<br />
290 340 360 360<br />
GDP $ millions 6 7 8 8<br />
Labour Income $ millions 4 5 5 5<br />
Employment person-years<br />
Induced Impacts<br />
100 120 125 130<br />
GDP $ millions 6 7 8 8<br />
Labour Income $ millions 4 4 5 5<br />
Employment person-years<br />
Total Impacts<br />
100 120 130 120<br />
GDP $ millions 23 27 31 31<br />
Labour Income $ millions 19 22 25 25<br />
Employment person-years<br />
Source: Expenditures - survey <strong>of</strong> ENGOs.<br />
Impact Multipliers - Appendix M.<br />
490 580 615 610
34<br />
<strong>Economic</strong> <strong>Contribution</strong> <strong>of</strong> <strong>the</strong> <strong>Oceans</strong> <strong>Sector</strong> <strong>in</strong> <strong>British</strong> <strong>Columbia</strong><br />
ENGOs are an <strong>of</strong>f-neglected group - but <strong>the</strong>y should<br />
be considered part <strong>of</strong> <strong>the</strong> oceans sector and, for<br />
this reason, we launched a special <strong>in</strong>terview/survey<br />
program to pr<strong>of</strong>ile <strong>the</strong>ir activities and economic<br />
contribution.<br />
It was not possible to conduct a thorough ENGO<br />
survey for this study. Approximately 40 organizations<br />
were contacted. Of <strong>the</strong>se, some were no longer<br />
active or were just escalat<strong>in</strong>g mar<strong>in</strong>e-related work<br />
(e.g., Greenpeace Canada). O<strong>the</strong>rs had difficulty<br />
isolat<strong>in</strong>g <strong>the</strong> ocean component <strong>of</strong> <strong>the</strong>ir expenditures<br />
or <strong>in</strong>dicated that <strong>the</strong> majority <strong>of</strong> <strong>the</strong>ir relevant<br />
efforts were be<strong>in</strong>g done by volunteers whose<br />
contribution was not captured <strong>in</strong> f<strong>in</strong>ancial records<br />
(e.g., <strong>the</strong> Federation <strong>of</strong> B.C. Naturalists). And many<br />
o<strong>the</strong>r groups contacted did not respond or refused<br />
participation <strong>in</strong> <strong>the</strong> survey.<br />
Fourteen (14) organizations were <strong>in</strong>terviewed<br />
and provided <strong>in</strong>formation on <strong>the</strong>ir ocean-related<br />
spend<strong>in</strong>g and employment.<br />
Early on, several respondents noted that <strong>the</strong> narrow<br />
focus on ocean environmental work overlooked <strong>the</strong><br />
importance <strong>of</strong> <strong>in</strong>land activities, such as ensur<strong>in</strong>g<br />
freshwater quality and protect<strong>in</strong>g fish and wildlife<br />
habitat, on <strong>the</strong> mar<strong>in</strong>e environment. For this reason,<br />
<strong>the</strong> survey was extended to <strong>in</strong>clude some <strong>of</strong> <strong>the</strong><br />
major organizations engaged <strong>in</strong> streamkeep<strong>in</strong>g and<br />
land and estuary conservation (but also with a strong<br />
mar<strong>in</strong>e element).<br />
Activities. The ENGOs surveyed for this study<br />
are active <strong>in</strong> a number <strong>of</strong> areas <strong>of</strong> ocean-related<br />
education, lobby<strong>in</strong>g, research, and conservation,<br />
<strong>in</strong>clud<strong>in</strong>g (Table 16):<br />
h susta<strong>in</strong>able mar<strong>in</strong>e fisheries<br />
h susta<strong>in</strong>able aquaculture<br />
h <strong>the</strong> protection and restoration <strong>of</strong> fish and wildlife<br />
habitat and mar<strong>in</strong>e biodiversity<br />
h mar<strong>in</strong>e use plann<strong>in</strong>g, <strong>in</strong>clud<strong>in</strong>g Mar<strong>in</strong>e Protected<br />
Areas (MPAs)<br />
h mapp<strong>in</strong>g, survey<strong>in</strong>g, monitor<strong>in</strong>g, and biological<br />
research (e.g., mar<strong>in</strong>e and estuary habitat, fish<br />
populations, mar<strong>in</strong>e mammals, waterfowl)<br />
h opposition to <strong>of</strong>fshore oil and gas development<br />
and coastal tanker traffic<br />
h mar<strong>in</strong>e pollution from sewage, urban run<strong>of</strong>f,<br />
<strong>in</strong>dustrial effluents, and o<strong>the</strong>r sources<br />
h mar<strong>in</strong>e-related public environmental education<br />
and school programs<br />
The locally based groups surveyed were engaged<br />
<strong>in</strong> various activities rang<strong>in</strong>g from ocean habitat<br />
tours to beach cleanups to habitat mapp<strong>in</strong>g and<br />
restoration (e.g., salt marshes, eelgrass beds). On<br />
some <strong>of</strong> <strong>the</strong> issues noted above, ENGOs have jo<strong>in</strong>ed<br />
forces <strong>in</strong> an alliance to better pursue <strong>the</strong>ir goals (e.g.,<br />
<strong>the</strong> Coastal Alliance for Aquaculture Reform, Mar<strong>in</strong>e<br />
Conservation Caucus, Oil Free Coast Alliance).<br />
The Vancouver Aquarium’s Mar<strong>in</strong>e Science Centre<br />
is a self-support<strong>in</strong>g, non-pr<strong>of</strong>it organization that<br />
provides mar<strong>in</strong>e education and research. Ongo<strong>in</strong>g<br />
activities are its exhibits and displays <strong>of</strong> B.C. ocean<br />
life, research and conservation <strong>in</strong>itiatives for coastal<br />
species (<strong>in</strong>clud<strong>in</strong>g mar<strong>in</strong>e mammal rescue and<br />
rehabilitation), and education programs targeted at<br />
school children. We recognize that <strong>the</strong> Aquarium is<br />
not strictly an ENGO – it has been <strong>in</strong>cluded here as<br />
this category, <strong>of</strong> those considered <strong>in</strong> this study, is <strong>the</strong><br />
most closely aligned.<br />
Expenditures. The 2005 total for mar<strong>in</strong>e-related<br />
spend<strong>in</strong>g was about $27 million. The figures have<br />
been aggregated across all <strong>the</strong> organizations shown<br />
for confidentiality reasons (Table 16).<br />
<strong>Economic</strong> Impacts. The economic impacts for <strong>the</strong> 14<br />
ENGOS provid<strong>in</strong>g data are given <strong>in</strong> Table 17.<br />
The above figures underestimate <strong>the</strong> role <strong>of</strong><br />
environmental organizations <strong>in</strong> mar<strong>in</strong>e matters.<br />
For example, <strong>the</strong>re are thousands <strong>of</strong> volunteers<br />
who spend tens <strong>of</strong> thousands <strong>of</strong> hours annually on<br />
beached bird programs, estuary cleanups, and <strong>the</strong><br />
like. In addition, many volunteers with pr<strong>of</strong>essional<br />
backgrounds write letters, analyze issues, etc. This<br />
valuable work is not reflected <strong>in</strong> <strong>the</strong> market-based<br />
economic impact estimates above.
<strong>Economic</strong> <strong>Contribution</strong> <strong>of</strong> <strong>the</strong> <strong>Oceans</strong> <strong>Sector</strong> <strong>in</strong> <strong>British</strong> <strong>Columbia</strong> 35<br />
5.0 Total Ocean <strong>Sector</strong> Impacts Today and <strong>in</strong> <strong>the</strong> future<br />
This section syn<strong>the</strong>sizes and positions <strong>the</strong><br />
economic analysis <strong>of</strong> private sector, public sector,<br />
and non-government sector components <strong>of</strong> <strong>the</strong><br />
ocean economy from previous sections. Figure 4<br />
summarizes <strong>the</strong> results. Table 18 at <strong>the</strong> end <strong>of</strong> <strong>the</strong><br />
section presents <strong>the</strong> results for <strong>in</strong>dividual subsectors.<br />
5.1 direct and Total Ocean <strong>Sector</strong> Impacts<br />
The direct impacts <strong>of</strong> <strong>the</strong> ocean sector <strong>in</strong> 2005 were:<br />
$11.6 billion <strong>in</strong> Gross Output, $5.7 billion <strong>in</strong> Gross<br />
Domestic Product (GDP), $4.2 billion <strong>in</strong> Labour<br />
Income, and 84,400 person-years <strong>of</strong> employment<br />
(Figure 4). Note that <strong>the</strong> direct GDP <strong>of</strong> $5.7 billion<br />
is $11.6 billion <strong>of</strong> Gross Output less $5.9 billion <strong>in</strong><br />
Intermediate Inputs.<br />
Figure 4 also displays <strong>the</strong> total economic impacts<br />
from ocean sector activities - <strong>the</strong> direct <strong>in</strong>dustry<br />
impacts above plus <strong>the</strong> sp<strong>in</strong><strong>of</strong>f or “multiplier”<br />
<strong>in</strong>direct supplier impacts and <strong>the</strong> <strong>in</strong>duced consumer<br />
respend<strong>in</strong>g impacts. These backward l<strong>in</strong>kages to<br />
suppliers and wage respend<strong>in</strong>g impacts essentially<br />
double <strong>the</strong> direct impact measures for 2005 – total<br />
impacts <strong>of</strong> $11.1 billion GDP, $7.6 billion Labour<br />
Income and 167,800 person-years <strong>of</strong> employment.<br />
There are significant differences among subsectors<br />
not only <strong>in</strong> <strong>the</strong> size <strong>of</strong> each sector but <strong>in</strong> <strong>the</strong> labour<br />
<strong>in</strong>tensity and <strong>the</strong> importance <strong>of</strong> sp<strong>in</strong><strong>of</strong>f effects (see<br />
Table 18). We note <strong>the</strong> follow<strong>in</strong>g:<br />
h <strong>the</strong> public sector, <strong>in</strong> total, has direct Labour<br />
Income compris<strong>in</strong>g over half <strong>of</strong> sector revenues<br />
whereas <strong>the</strong> bus<strong>in</strong>ess sector has direct Labour<br />
Income at one-third <strong>of</strong> revenues overall<br />
Figure 4: B.C. Ocean <strong>Sector</strong> and <strong>the</strong> B.C. Economy<br />
A. B.C. Ocean <strong>Sector</strong> Impact Summary 2005<br />
2005 Impacts<br />
h public sector direct wages per person-year (PY)<br />
are higher than bus<strong>in</strong>ess sector direct wages per<br />
person-year - <strong>the</strong> seafood and ocean recreation<br />
sectors have <strong>the</strong> lowest wages <strong>of</strong> all bus<strong>in</strong>ess<br />
sectors considered<br />
h forestry and construction have relatively low<br />
direct impacts but higher <strong>in</strong>direct and <strong>in</strong>duced<br />
impacts i.e., higher multiplier impacts<br />
h <strong>in</strong>direct and <strong>in</strong>duced employment generally<br />
is lower pay<strong>in</strong>g than direct ocean <strong>in</strong>dustry<br />
employment<br />
Ocean-related economic activity is concentrated<br />
<strong>in</strong> <strong>the</strong> four private sectors – seafood, ocean high<br />
tech, ocean recreation and ports & shipp<strong>in</strong>g – and<br />
<strong>the</strong> federal government public sector. These five<br />
sectors comprise over 90% <strong>of</strong> <strong>the</strong> ocean sector total<br />
(Figure 4). Never<strong>the</strong>less, all ocean-related sectors<br />
are important as <strong>the</strong>y contribute to a diversified<br />
economy throughout Coastal B.C.<br />
Our analysis suggests that <strong>the</strong> ocean economy -<br />
direct plus sp<strong>in</strong><strong>of</strong>f effects - comprises 7-8% <strong>of</strong> <strong>the</strong><br />
total B.C. economy (see Figure 4).<br />
F<strong>in</strong>ally we note that <strong>the</strong> economic contribution <strong>of</strong><br />
<strong>the</strong> ocean to <strong>the</strong> B.C. economy <strong>in</strong> 2005 is more than<br />
double <strong>the</strong> previous estimate for <strong>the</strong> year 2000<br />
e.g., direct GDP estimate <strong>of</strong> $5.7 billion <strong>in</strong> this study<br />
versus $2.8 billion <strong>in</strong> <strong>the</strong> previous study (Table 1,<br />
Section 2). About 25 to 30% <strong>of</strong> <strong>the</strong> difference may be<br />
attributable to overall growth <strong>in</strong> <strong>the</strong> economy over<br />
<strong>the</strong> <strong>in</strong>terven<strong>in</strong>g five years – but <strong>the</strong> vast majority <strong>of</strong><br />
<strong>the</strong> difference reflects enhanced sector coverage and<br />
procedures implemented for this study.<br />
Direct Indirect Induced Total<br />
Output $ millions 11,617 NA NA NA<br />
GDP $ millions 5,727 2,896 2,434 11,057<br />
Labour Income $ millions 4,174 1,915 1,461 7,550<br />
Employment PYs 84,430 45,875 37,500 167,805
36<br />
<strong>Economic</strong> <strong>Contribution</strong> <strong>of</strong> <strong>the</strong> <strong>Oceans</strong> <strong>Sector</strong> <strong>in</strong> <strong>British</strong> <strong>Columbia</strong><br />
B. Ocean Subsector Shares <strong>of</strong> Total B.C. Impacts 2005<br />
2005 Industry Shares <strong>of</strong> Total Impacts<br />
GDP Labour Income Employment<br />
Private <strong>Sector</strong> - Seafood .12 .11 .13<br />
- Forestry .02 .02 .02<br />
- Ship & Boat Build<strong>in</strong>g .03 .03 .03<br />
- Ocean Construction .02 .02 .02<br />
- Ocean High Tech .09 .09 .08<br />
- Ocean Recreation .33 .31 .36<br />
- Ocean Transport .29 .30 .28<br />
Public <strong>Sector</strong> - Federal Government .08 .10 .07<br />
- Prov<strong>in</strong>cial Government .01 .01 .01<br />
Non-Government <strong>Sector</strong> - Universities & Research .01 .01
<strong>Economic</strong> <strong>Contribution</strong> <strong>of</strong> <strong>the</strong> <strong>Oceans</strong> <strong>Sector</strong> <strong>in</strong> <strong>British</strong> <strong>Columbia</strong> 37<br />
Table 18: B.C. Ocean <strong>Sector</strong> Impact Summary<br />
2002 2003 2004 2005<br />
Output GDP LI EM Output GDP LI EM Output GDP LI EM Output GDP LI EM<br />
DIRECT IMPACTS<br />
Private <strong>Sector</strong><br />
Seafood 1,310 750 450 12,970 1,300 745 445 12,600 1,290 740 445 12,300 1,380 790 475 12,900<br />
Forestry 269 100 60 960 256 90 58 930 308 118 59 910 283 108 60 910<br />
Ship & Boat Bldg 378 165 131 2,520 422 186 148 2,740 380 168 134 2,410 398 175 139 2,490<br />
Mar<strong>in</strong>e Construction 110 47 35 720 117 50 37 750 161 69 52 990 216 93 69 1,330<br />
Ocean High Tech 925 465 300 5,010 995 500 320 5,280 1,050 530 340 5,450 1,125 565 365 5,730<br />
Ocean Recreation 3,351 1,610 1,080 28,500 3,397 1,630 1,100 28,800 3,610 1,740 1,170 30,100 3,791 1,820 1,220 32,200<br />
Ocean Transport 2,930 1,330 1,040 19,400 3,050 1,380 1,080 19,800 3,190 1,450 1,130 20,200 3,330 1,510 1,180 20,700<br />
Subtotal<br />
Public <strong>Sector</strong><br />
9,273 4,467 3,096 70,080 9,537 4,581 3,188 70,900 9,989 4,815 3,330 72,360 10,523 5,061 3,508 76,260<br />
Federal Gov’t 772 530 530 6,870 760 535 535 6,880 819 555 555 6,770 854 580 580 7,010<br />
Prov<strong>in</strong>cial Gov’t 103 20 20 300 141 25 25 350 151 31 31 430 153 32 32 430<br />
Subtotal<br />
Non-Government <strong>Sector</strong><br />
875 550 550 7,170 901 560 560 7,230 970 586 586 7,200 1,007 612 612 7,440<br />
Universities & Research 41 27 27 275 48 31 31 310 52 34 34 330 60 39 39 370<br />
ENGOs 20 11 11 290 24 13 13 340 26 15 15 360 27 15 15 360<br />
Subtotal 61 38 38 565 72 44 44 650 78 49 49 690 87 54 54 730<br />
TOTAL 10,209 5,055 3,684 77,815 10,510 5,185 3,792 78,780 11,037 5,450 3,965 80,250 11,617 5,727 4,174 84,430<br />
2002 2003 2004 2005<br />
GDP LI EM GDP LI EM GDP LI EM GDP LI EM<br />
INDIRECT IMPACTS<br />
Private <strong>Sector</strong><br />
Seafood 240 170 4,680 230 170 4,550 230 170 4,430 250 180 4,640<br />
Forestry 97 67 1,290 92 64 1,200 111 77 1,420 102 71 1,280<br />
Ship & Boat Bldg 85 41 970 98 47 1,080 89 42 960 92 44 980<br />
Mar<strong>in</strong>e Construction 34 22 560 36 23 590 50 32 790 67 43 1,040<br />
Ocean High Tech 220 140 3,720 240 150 3,940 255 160 4,100 275 170 4,300<br />
Ocean Recreation 920 580 14,600 930 580 14,700 980 620 15,700 1,030 650 16,500<br />
Ocean Transport 850 590 14,100 880 610 14,400 920 640 14,700 960 670 15,100<br />
Subtotal<br />
Public <strong>Sector</strong><br />
2,446 1,610 39,920 2,506 1,644 40,460 2,635 1,741 42,100 2,776 1,828 43,840<br />
Federal Gov’t 85 64 1,570 84 63 1,540 91 68 1,640 96 72 1,680<br />
Prov<strong>in</strong>cial Gov’t 4 3 75 5 4 90 7 4 110 7 5 110<br />
Subtotal<br />
Non-Government <strong>Sector</strong><br />
89 67 1,645 89 67 1,630 98 72 1,750 103 77 1,790<br />
Universities & Research 6 3 85 7 4 95 8 4 100 9 5 115<br />
ENGOs 6 4 100 7 5 120 8 5 125 8 5 130<br />
Subtotal 12 7 185 14 9 215 16 9 225 17 10 245<br />
TOTAL 2,547 1,684 41,750 2,609 1,720 42,305 2,749 1,822 44,075 2,896 1,915 45,875
38<br />
<strong>Economic</strong> <strong>Contribution</strong> <strong>of</strong> <strong>the</strong> <strong>Oceans</strong> <strong>Sector</strong> <strong>in</strong> <strong>British</strong> <strong>Columbia</strong><br />
Table 18: B.C. Ocean <strong>Sector</strong> Impact Summary (cont<strong>in</strong>ued)<br />
2002 2003 2004 2005<br />
GDP LI EM GDP LI EM GDP LI EM GDP LI EM<br />
INDUCED IMPACTS<br />
Private <strong>Sector</strong><br />
Seafood 250 150 4,050 250 150 3,940 250 150 3,860 260 160 4,030<br />
Forestry 51 30 810 49 29 780 54 33 850 52 31 840<br />
Ship & Boat Bldg 69 41 1,120 78 47 1,250 70 42 1,100 73 44 1,130<br />
Mar<strong>in</strong>e Construction 23 14 370 24 14 380 34 20 530 45 27 690<br />
Ocean High Tech 175 105 2,870 190 110 3,010 200 120 3,140 215 130 3,290<br />
Ocean Recreation 660 400 10,800 670 400 10,800 710 430 11,200 750 450 11,500<br />
Ocean Transport 650 390 10,600 680 410 10,800 710 420 11,100 740 440 11,400<br />
Subtotal<br />
Public <strong>Sector</strong><br />
1,878 1,130 30,620 1,941 1,160 30,960 2,028 1,215 31,780 2,135 1,282 32,880<br />
Federal Gov’t 240 145 3,880 240 145 3,830 250 150 3,910 260 155 4,010<br />
Prov<strong>in</strong>cial Gov’t 9 6 150 11 7 180 14 8 220 14 9 220<br />
Subtotal<br />
Non-Government <strong>Sector</strong><br />
249 151 4,030 251 152 4,010 264 158 4,130 274 164 4,230<br />
Universities & Research 12 7 190 14 8 220 15 9 235 17 10 270<br />
ENGOs 6 4 100 7 4 120 8 5 130 8 5 120<br />
Subtotal 18 11 290 21 12 340 23 14 365 25 15 390<br />
TOTAL 2,145 1,292 34,940 2,213 1,324 35,310 2,315 1,387 36,275 2,434 1,461 37,500<br />
2002 2003 2004 2005<br />
GDP LI EM GDP LI EM GDP LI EM GDP LI EM<br />
TOTAL IMPACTS<br />
Private <strong>Sector</strong><br />
Seafood 1,240 770 21,700 1,225 765 21,090 1,220 765 20,590 1,300 815 21,570<br />
Forestry 248 157 3,060 231 151 2,910 283 169 3,180 262 162 3,030<br />
Ship & Boat Bldg 319 213 4,610 362 242 5,070 327 218 4,470 340 227 4,600<br />
Mar<strong>in</strong>e Construction 104 71 1,650 110 74 1,720 153 104 2,310 205 139 3,060<br />
Ocean High Tech 860 545 11,600 930 580 12,230 985 620 12,690 1,055 665 13,320<br />
Ocean Recreation 3,190 2,060 53,900 3,230 2,080 54,300 3,430 2,220 57,000 3,600 2,320 60,200<br />
Ocean Transport 2,830 2,020 44,100 2,940 2,100 45,000 3,080 2,190 46,000 3,210 2,290 47,200<br />
Subtotal<br />
Public <strong>Sector</strong><br />
8,791 5,836 140,620 9,028 5,992 142,320 9,478 6,286 146,240 9,972 6,618 152,980<br />
Federal Gov’t 855 739 12,320 859 743 12,250 896 773 12,320 936 807 12,700<br />
Prov<strong>in</strong>cial Gov’t 33 29 525 41 36 620 52 43 760 53 46 760<br />
Subtotal<br />
Non-Government <strong>Sector</strong><br />
888 768 12,845 900 779 12,870 948 816 13,080 989 853 13,460<br />
Universities & Research 45 37 550 52 43 625 57 47 665 65 54 755<br />
ENGOs 23 19 490 27 22 580 31 25 615 31 25 610<br />
Subtotal 68 56 1,040 79 65 1,205 88 72 1,280 96 79 1,365<br />
TOTAL<br />
Source: Sections 3 and 4.<br />
9,747 6,660 154,505 10,007 6,836 156,395 10,514 7,174 160,600 11,057 7,550 167,805<br />
Legend: Output - Gross Output/Revenues/Expenditures ($ millions). LI- Labour Income ($ millions).<br />
GDP - Gross Domestic Product ($ millions). EM - Employment (Person-Years).
<strong>Economic</strong> <strong>Contribution</strong> <strong>of</strong> <strong>the</strong> <strong>Oceans</strong> <strong>Sector</strong> <strong>in</strong> <strong>British</strong> <strong>Columbia</strong> 39<br />
6.0 Potential Energy <strong>Sector</strong>s & Their Estimated Impacts<br />
There are a variety <strong>of</strong> potential ocean sector activities<br />
that could contribute to <strong>the</strong> prov<strong>in</strong>cial economy <strong>in</strong><br />
<strong>the</strong> future. These <strong>in</strong>clude ocean energy (<strong>of</strong>fshore oil<br />
& gas, <strong>of</strong>fshore w<strong>in</strong>d, tidal and wave), mar<strong>in</strong>e plant<br />
harvest<strong>in</strong>g and neutracuticals, and o<strong>the</strong>rs.<br />
In this section we exam<strong>in</strong>e three potential energy<br />
sectors: i) <strong>of</strong>fshore oil & gas, ii) <strong>of</strong>fshore w<strong>in</strong>d farms,<br />
and iii) tidal and wave energy. A quantitative<br />
assessment is provided for <strong>of</strong>fshore oil & gas and<br />
<strong>of</strong>fshore w<strong>in</strong>d farms as <strong>the</strong>re is some <strong>in</strong>formation<br />
available on <strong>the</strong>ir resource potential and economics.<br />
Never<strong>the</strong>less, <strong>the</strong> follow<strong>in</strong>g analysis should be<br />
considered illustrative and not a prediction. There<br />
are significant technical, economic, and regulatory<br />
uncerta<strong>in</strong>ties associated with <strong>the</strong>se prospective<br />
developments.<br />
The <strong>in</strong>tent is to identify <strong>the</strong> broad magnitude <strong>of</strong><br />
activity and economic benefits associated with <strong>the</strong>se<br />
potential energy projects. All f<strong>in</strong>ancial figures are<br />
expressed <strong>in</strong> constant undiscounted dollars.<br />
As <strong>the</strong>re is limited <strong>in</strong>formation available perta<strong>in</strong><strong>in</strong>g<br />
to wave and tidal energy, this potential sector is<br />
addressed <strong>in</strong> qualitative terms only.<br />
6.1 Offshore Oil & Gas<br />
Background. The Geological Survey <strong>of</strong> Canada<br />
suggests that <strong>the</strong>re are substantial amounts <strong>of</strong> oil<br />
and gas <strong>in</strong> <strong>the</strong> Queen Charlotte Bas<strong>in</strong> <strong>in</strong> <strong>the</strong> waters <strong>of</strong>f<br />
Nor<strong>the</strong>rn B.C. (Hannigan 2001). The Queen Charlotte<br />
Bas<strong>in</strong> (QCB) is one <strong>of</strong> several bas<strong>in</strong>s <strong>of</strong>fshore that<br />
have oil and gas potential (<strong>the</strong> o<strong>the</strong>r bas<strong>in</strong>s are <strong>the</strong><br />
W<strong>in</strong>ona, <strong>the</strong> T<strong>of</strong><strong>in</strong>o, and <strong>the</strong> Georgia). The QC Bas<strong>in</strong><br />
appears to be <strong>the</strong> most promis<strong>in</strong>g and has had some<br />
exploration work. The QCB may conta<strong>in</strong> 9.8 billion<br />
barrels (bbls) <strong>of</strong> oil and 26 trillion cubic feet (tcf) <strong>of</strong><br />
gas. Therefore our analysis focuses on this bas<strong>in</strong>.<br />
S<strong>in</strong>ce 1972 <strong>the</strong>re have been federal and prov<strong>in</strong>cial<br />
policy moratoria <strong>in</strong> place that effectively prohibit<br />
<strong>of</strong>fshore oil and gas exploration and development.<br />
Any energy development <strong>in</strong> <strong>the</strong> B.C. <strong>of</strong>fshore needs<br />
to consider and protect environmental sensitivity and<br />
mar<strong>in</strong>e productivity <strong>of</strong> <strong>the</strong> region.<br />
There are substantial uncerta<strong>in</strong>ties <strong>in</strong> analyz<strong>in</strong>g oil &<br />
gas potential. The most recent seismic survey <strong>in</strong> QC<br />
Bas<strong>in</strong> was conducted <strong>in</strong> 1988 when <strong>the</strong> Geological<br />
Survey <strong>of</strong> Canada recorded 1,000 km <strong>of</strong> mar<strong>in</strong>e<br />
seismic data. Exist<strong>in</strong>g exploratory work is dated and<br />
does not reflect current technological advances. It is<br />
thus unknown as to how much oil & gas is potentially<br />
<strong>in</strong> place. The feasibility <strong>of</strong> extract<strong>in</strong>g <strong>the</strong> resources,<br />
<strong>the</strong> potential time frame, <strong>the</strong> technology that may be<br />
used (<strong>in</strong>clud<strong>in</strong>g transportation) and <strong>the</strong> requirements<br />
that could be <strong>in</strong> place for environmental review, First<br />
Nations and community consultations, and o<strong>the</strong>r<br />
regulatory requirements are also significant sources<br />
<strong>of</strong> uncerta<strong>in</strong>ty. Moreover, uncerta<strong>in</strong>ty exists as to<br />
future prices for oil & gas which <strong>in</strong> turn depend on<br />
future energy supply and demand worldwide and on<br />
<strong>the</strong> availability and prices <strong>of</strong> energy substitutes.<br />
Potential Production. A number <strong>of</strong> recent reports<br />
have addressed some aspects <strong>of</strong> <strong>the</strong> economics <strong>of</strong><br />
potential oil & gas development and <strong>the</strong>ir impacts<br />
to <strong>the</strong> prov<strong>in</strong>ce (Scarfe 2003, Simon Fraser University<br />
2004, GE Bridges 2004 a,b,c,d, Sch<strong>of</strong>ield and Sandhu<br />
2005, Locke 2006). We have drawn on this work <strong>in</strong><br />
develop<strong>in</strong>g an economic pr<strong>of</strong>ile <strong>of</strong> potential <strong>of</strong>fshore<br />
petroleum resource exploration, development and<br />
production and <strong>the</strong>ir potential impacts to B.C.<br />
Table 19: B.C. Illustrative Offshore Oil & Gas <strong>Economic</strong> Impacts<br />
A. Oil Scenario - 1,615 million bbls worth $76.72 billion US lifetime<br />
- construction cost <strong>of</strong> $9.4 billion US<br />
- lifetime operat<strong>in</strong>g costs <strong>of</strong> $7.28 billion US, transport costs <strong>of</strong> $2.42 billion US<br />
Construction Phase Operations Phase Total Project<br />
Lifetime Impacts Direct Indirect Induced Total Direct Indirect Induced Total Direct Indirect Induced Total<br />
GDP $ millions CDN 3,539 1,769 973 6,281 80,985 5,706 1,861 88,552 84,524 7,475 2,834 94,833<br />
Labour Income $ millions CDN 1,327 1,106 584 3,017 2,141 2,511 1,116 5,768 3,468 3,617 1,700 8,785<br />
Employment PYs 16,590 22,120 14,600 53,310 35,685 50,220 27,900 113,805 52,275 72,340 42,500 167,115
40<br />
<strong>Economic</strong> <strong>Contribution</strong> <strong>of</strong> <strong>the</strong> <strong>Oceans</strong> <strong>Sector</strong> <strong>in</strong> <strong>British</strong> <strong>Columbia</strong><br />
B. Gas Scenario - 6,060 bcf worth $32.72 billion US lifetime<br />
- construction cost <strong>of</strong> $6.0 billion US<br />
- lifetime operat<strong>in</strong>g costs <strong>of</strong> $5.1 billion US<br />
Construction Phase Operations Phase Total Project<br />
Lifetime Impacts Direct Indirect Induced Total Direct Indirect Induced Total Direct Indirect Induced Total<br />
GDP $ millions CDN 2,259 1,129 621 4,009 33,999 3,000 1,128 38,127 36,258 4,129 1,749 42,136<br />
Labour Income $ millions CDN 847 706 373 1,926 1,500 1,320 677 3,497 2,347 2,026 1,050 5,423<br />
Employment PYs 10,590 14,120 9,320 34,030 25,000 26,400 16,920 68,320 35,590 40,520 26,240 102,350<br />
C. Both Oil & Gas - 1,615 million bbls oil & 6,060 bcf gas worth $109.44 billion US lifetime<br />
- construction costs <strong>of</strong> $15.4 billion US<br />
- lifetime operat<strong>in</strong>g & transportation costs <strong>of</strong> $14.8 billion US<br />
Construction Phase Operations Phase Total Project<br />
Lifetime Impacts Direct Indirect Induced Total Direct Indirect Induced Total Direct Indirect Induced Total<br />
GDP $ millions CDN 5,798 2,898 1,594 10,290 114,984 8,706 2,989 126,679 120,782 11,604 4,583 136,969<br />
Labour Income $ millions CDN 2,174 1,812 957 4,943 3,641 3,831 1,793 9,265 5,815 5,643 2,750 14,208<br />
Employment PYs 27,180 36,240 23,920 87,340 60,685 76,620 44,820 182,125 87,865 112,860 68,740 269,465<br />
Source: Oil & gas scenarios - Wade Locke 2006 and Appendix K<br />
Impact estimates - direct: Appendix K<br />
- <strong>in</strong>direct & <strong>in</strong>duced: impact coefficients derived from G.E. Bridges 2004 c and Statistics Canada<br />
Exchange rate - assumed $1 CDN = $0.85 US Dollars - all f<strong>in</strong>ancial figures <strong>in</strong> 2006 undiscounted constant dollars<br />
In particular, we rely on <strong>the</strong> Locke report for potential<br />
production levels, revenues and costs as it is <strong>the</strong> most<br />
recent and comprehensive <strong>in</strong> terms <strong>of</strong> oil and gas<br />
economics, and <strong>in</strong> fact is <strong>the</strong> benchmark reference<br />
used by B.C. Energy M<strong>in</strong>es & Petroleum Resources.<br />
The Locke report also is <strong>the</strong> only one <strong>of</strong> those listed<br />
above that estimates <strong>the</strong> amount <strong>of</strong> resources that<br />
are economic to extract, so-called “reserves”, based<br />
on specific price, cost and target rate <strong>of</strong> return<br />
parameters.<br />
The Locke analysis presents illustrative economic<br />
parameters and identifies reserves - at ten different<br />
price po<strong>in</strong>ts and two different recovery factors - for<br />
each <strong>of</strong> oil and gas that yield an after-tax real rate <strong>of</strong><br />
return <strong>of</strong> at least 12%. A general rule <strong>in</strong> <strong>the</strong> <strong>in</strong>dustry<br />
used to be that one third <strong>of</strong> <strong>the</strong> oil and two thirds<br />
<strong>of</strong> <strong>the</strong> gas was recoverable. Recent eng<strong>in</strong>eer<strong>in</strong>g<br />
advances such as horizontal drill<strong>in</strong>g and re-<strong>in</strong>jection<br />
<strong>of</strong> produced gas and water has led to improved<br />
recoveries.<br />
In our analysis we have used <strong>the</strong> Locke results<br />
correspond<strong>in</strong>g to:<br />
h oil - $50 US/bbl price, 25% recovery factor, Terra<br />
Nova <strong>of</strong>fshore Newfoundland technology/cost<br />
structure (24 years construction and operations)<br />
h gas - $6 US/mcf price, 60% recovery factor, Sable<br />
Island <strong>of</strong>fshore Nova Scotia technology/ cost<br />
structure (31 years construction and operations)<br />
The analysis corresponds to <strong>the</strong> lower recovery<br />
rate scenarios for each <strong>of</strong> oil and gas. The prices<br />
selected lie <strong>in</strong> <strong>the</strong> range <strong>of</strong> long term post 2010 prices<br />
suggested by Locke, namely $40-$50 US/bbl for oil<br />
and $6-$7 US/mcf for gas. The $50 US price for oil is<br />
broadly consistent with a recent long term oil price<br />
forecast (GLG 2007).<br />
These assumptions result <strong>in</strong> lifetime economic<br />
production <strong>of</strong> (see Locke 2006):<br />
h oil - 1,615 millions bbls worth $77 billion US<br />
h gas - 6,060 bcf worth $33 billion US<br />
These amounts are about 25% <strong>of</strong> <strong>the</strong> <strong>in</strong>-place<br />
volumes suggested by <strong>the</strong> Geological Survey <strong>of</strong><br />
Canada. The costs associated with construction and<br />
production are given <strong>in</strong> Appendix K.<br />
<strong>Economic</strong> Impacts. The direct <strong>in</strong>dustry, <strong>in</strong>direct<br />
supplier, and <strong>in</strong>duced consumer respend<strong>in</strong>g<br />
impacts <strong>of</strong> <strong>the</strong> illustrative oil and gas scenarios<br />
are summarized <strong>in</strong> Table 19. Development <strong>of</strong> <strong>the</strong><br />
<strong>of</strong>fshore oil and gas reserves, at <strong>the</strong> production levels<br />
postulated, confer lifetime economic impacts to <strong>the</strong><br />
Prov<strong>in</strong>ce <strong>of</strong> $137 billion <strong>in</strong> prov<strong>in</strong>cial GDP, $14 billion<br />
<strong>in</strong> Wages & Benefits, and 269,500 person-years <strong>of</strong><br />
employment over <strong>the</strong> construction and operations<br />
phases.<br />
The bulk <strong>of</strong> <strong>the</strong> potential benefits occur dur<strong>in</strong>g<br />
<strong>the</strong> on-go<strong>in</strong>g production phase ra<strong>the</strong>r than <strong>the</strong><br />
construction phase. Additionally, <strong>the</strong> bulk <strong>of</strong> wage<br />
and employment impacts result from <strong>the</strong> <strong>in</strong>direct<br />
supplier and <strong>in</strong>duced consumer/retail spend<strong>in</strong>g<br />
activity ra<strong>the</strong>r than directly <strong>in</strong> construction or
<strong>Economic</strong> <strong>Contribution</strong> <strong>of</strong> <strong>the</strong> <strong>Oceans</strong> <strong>Sector</strong> <strong>in</strong> <strong>British</strong> <strong>Columbia</strong> 41<br />
operations. In contrast, over 85% <strong>of</strong> <strong>the</strong> contribution<br />
to prov<strong>in</strong>cial GDP is derived from direct <strong>in</strong>dustry<br />
activity, ma<strong>in</strong>ly <strong>the</strong> operation phase. These attributes<br />
reflect <strong>the</strong> capital <strong>in</strong>tensity and <strong>the</strong> high <strong>in</strong>comeearn<strong>in</strong>g<br />
potential <strong>of</strong> oil & gas sector developments.<br />
The distribution <strong>of</strong> earn<strong>in</strong>gs between <strong>the</strong> proponent<br />
and various levels <strong>of</strong> government is a matter <strong>of</strong><br />
negotiation as to <strong>the</strong> royalty/tax regime.<br />
Table 20: Illustrative Lifetime and Annual Impacts for Oil & Gas Development<br />
A. lifetime Oil & Gas development Impacts to B.C. from development <strong>of</strong> a S<strong>in</strong>gle Oil and a S<strong>in</strong>gle Gas<br />
field<br />
Lifetime Oil Lifetime Gas<br />
Lifetime Impacts Direct Indirect Induced Total Direct Indirect Induced Total<br />
GDP $ millions CDN 84,524 7,475 2,834 94,833 36,258 4,129 1,749 42,136<br />
Labour Income $ millions CDN 3,468 3,617 1,700 8,785 2,347 2,026 1,050 5,423<br />
Employment PYs 52,275 72,340 42,500 167,115 35,590 40,520 26,240 102,350<br />
B. Annual Oil & Gas development Impacts to B.C. from a S<strong>in</strong>gle Oil and a S<strong>in</strong>gle Gas field *<br />
Annual Oil Annual Gas<br />
Annual Impacts Direct Indirect Induced Total Direct Indirect Induced Total<br />
GDP $ millions CDN 3,522 311 118 3,951 1,170 133 56 1,359<br />
Labour Income $ millions CDN 145 151 71 367 76 65 34 175<br />
Employment PYs 2,180 3,015 1,770 6,965 1,150 1,305 845 3,300<br />
* Lifetime impacts divided by 24 year for oil and 31 years for gas.<br />
Source: Derived from Table 19.<br />
It is not appropriate to compare <strong>the</strong> potential lifetime<br />
impacts for <strong>of</strong>fshore oil & gas development, such as<br />
Table 19, to <strong>the</strong> annual ongo<strong>in</strong>g impacts <strong>of</strong> exist<strong>in</strong>g<br />
ocean sectors presented <strong>in</strong> Section 6. One could<br />
project exist<strong>in</strong>g ocean sector impacts <strong>in</strong>to <strong>the</strong> future<br />
and compare <strong>the</strong>se exist<strong>in</strong>g lump sum impacts to<br />
<strong>the</strong> aggregate impacts <strong>of</strong> Table 19. Alternately, one<br />
could convert <strong>the</strong> lifetime oil & gas developments to<br />
an annual stream. We chose <strong>the</strong> latter approach as<br />
it is simpler and 30 year forecasts <strong>of</strong> seafood, ocean<br />
transport and o<strong>the</strong>r ocean sector activities do not<br />
exist.<br />
Table 20 presents such annual benefit stream from<br />
a s<strong>in</strong>gle oil field and a s<strong>in</strong>gle gas field and based on<br />
construction plus operation time l<strong>in</strong>es <strong>of</strong> 24 years<br />
for oil and 31 years for gas - see Tables K.1 and K.2<br />
respectively <strong>in</strong> Appendix F for timel<strong>in</strong>es. It should be<br />
noted that Cook Inlet <strong>in</strong> Alaska, which is generally<br />
viewed as an analogue for QC Bas<strong>in</strong>, has been <strong>in</strong><br />
production s<strong>in</strong>ce 1959 - today Cook Inlet has 7<br />
produc<strong>in</strong>g oil fields and 17 produc<strong>in</strong>g gas fields with<br />
<strong>the</strong> most recent field placed <strong>in</strong> production <strong>in</strong> 2000<br />
(Hite, 2005).<br />
The estimated impacts on an annual basis are:<br />
h oil - annual total impacts <strong>of</strong> $3,951 million GDP,<br />
$367 million Wages & Benefits, and 6,965 personyears<br />
<strong>of</strong> employment<br />
h gas - annual total impacts <strong>of</strong> $1,359 million GDP,<br />
$175 million Wages & Benefits, and 3,300 personyears<br />
<strong>of</strong> employment<br />
However, <strong>the</strong> annualized impacts for <strong>the</strong> oil & gas<br />
<strong>of</strong>fshore sector are speculative hav<strong>in</strong>g been derived<br />
from estimated revenue streams occurr<strong>in</strong>g <strong>in</strong> <strong>the</strong><br />
distant future, which <strong>in</strong> turn are based on projections<br />
<strong>of</strong> production and prices. In contrast, <strong>the</strong> impacts<br />
for exist<strong>in</strong>g ocean sectors reflect current activity<br />
and revenues realized over <strong>the</strong> recent past. That is,<br />
potential oil & gas impacts, even after conversion<br />
to an annual basis, are not strictly comparable to<br />
exist<strong>in</strong>g ocean sector annual impacts for recent years.<br />
As noted earlier, <strong>the</strong>re are great uncerta<strong>in</strong>ties with<br />
development <strong>of</strong> <strong>the</strong> <strong>of</strong>fshore oil & gas resources <strong>in</strong><br />
B.C. The assumptions, projections, and results should<br />
be viewed as illustrative <strong>of</strong> <strong>the</strong> economic potential<br />
ra<strong>the</strong>r than a prediction <strong>of</strong> that potential.
42<br />
<strong>Economic</strong> <strong>Contribution</strong> <strong>of</strong> <strong>the</strong> <strong>Oceans</strong> <strong>Sector</strong> <strong>in</strong> <strong>British</strong> <strong>Columbia</strong><br />
6.2 Offshore W<strong>in</strong>d Energy<br />
Background. There is significant potential for w<strong>in</strong>d<br />
farms <strong>in</strong> <strong>of</strong>fshore areas <strong>in</strong> <strong>the</strong> Hecate Strait <strong>of</strong>f <strong>the</strong><br />
coasts <strong>of</strong> <strong>the</strong> Queen Charlotte Islands and Stephens<br />
and Porcher Islands (Garrad Hassan 2005). Mean<br />
annual w<strong>in</strong>d speeds are <strong>in</strong> <strong>the</strong> range <strong>of</strong> 8.0 metres/<br />
second to 9.5 metres/second.<br />
Offshore w<strong>in</strong>d energy technology has achieved<br />
full commercial status <strong>in</strong> Europe (IEA 2005). Several<br />
projects are be<strong>in</strong>g proposed for <strong>the</strong> B.C. <strong>of</strong>fshore.<br />
The 700 MW NaiKun W<strong>in</strong>d Project <strong>of</strong>fshore <strong>in</strong> Hecate<br />
Strait is one <strong>of</strong> <strong>the</strong> most advanced <strong>in</strong> plann<strong>in</strong>g. BC<br />
Hydro held a two day w<strong>in</strong>d energy workshop <strong>in</strong> 2005<br />
Table 21: B.C. Illustrative W<strong>in</strong>d Energy <strong>Economic</strong> Impacts<br />
at which time technical, price, transmission and o<strong>the</strong>r<br />
topics were addressed (BC Hydro 2005). The Prov<strong>in</strong>ce<br />
recently announced <strong>the</strong> formation <strong>of</strong> an “Innovative<br />
Clean Energy Fund” to help promis<strong>in</strong>g clean power<br />
technology projects succeed (EMPR 2007).<br />
Potential Production. Potential capacity <strong>of</strong> 15,000<br />
MW <strong>of</strong>fshore has been identified (Garrad Hassan<br />
2005). We assume, for illustrative purposes, that 10%<br />
<strong>of</strong> <strong>the</strong> above or 1,500 MW would be realized (this is<br />
<strong>the</strong> same assumption that Garrad Hassan made). We<br />
also assume a 40% capacity factor which is consistent<br />
with <strong>the</strong> IEA project review (IEA 2005).<br />
A. W<strong>in</strong>d Scenario (Project lifetime) - 1,500 MW (5-300 MW projects), 40% capacity factor, $100/Mwh CDN price<br />
- 1 year construction cost <strong>of</strong> $4.17 billion CDN (5 projects x $834 million)<br />
- lifetime operat<strong>in</strong>g costs <strong>of</strong> $2.2 billion CDN over 20 years<br />
Construction Phase Operations Phase Total Project<br />
Lifetime Project Impacts Direct Indirect Induced Total Direct Indirect Induced Total Direct Indirect Induced Total<br />
GDP $ millions CDN 1,334 667 367 2,368 8,752 1,100 370 10,222 10,086 1,767 737 12,590<br />
Labour Income $ millions CDN 500 417 220 1,137 440 484 222 1,146 940 901 442 2,283<br />
Employment PYs 6,250 8,340 5,500 20,090 7,335 9,680 5,540 22,555 13,585 18,020 11,040 42,645<br />
B. Annual W<strong>in</strong>d Energy development Impacts to B.C. * - const n plus operations<br />
Annual W<strong>in</strong>d *<br />
Lifetime Impacts Direct Indirect Induced Total<br />
GDP $ millions CDN 481 84 35 600<br />
Labour Income $ millions CDN 45 43 21 109<br />
Employment PYs 650 860 520 2,030<br />
* Project lifetime impacts above divided by 21 years<br />
Source: W<strong>in</strong>d scenarios - Garrad Hassan and Appendix L<br />
Impact estimates - direct: Appendix K<br />
- <strong>in</strong>direct & <strong>in</strong>duced: impact coefficients derived from B.C. sourc<strong>in</strong>g share similar to oil & gas<br />
Dollars - all f<strong>in</strong>ancial figures <strong>in</strong> 2006 undiscounted constant dollars<br />
To make <strong>the</strong>se assumptions, we drew on <strong>the</strong> work<br />
<strong>of</strong> Garrad Hassan <strong>in</strong> develop<strong>in</strong>g an economic pr<strong>of</strong>ile<br />
<strong>of</strong> <strong>of</strong>fshore w<strong>in</strong>d energy project construction and<br />
production – see Appendix L. The viability <strong>of</strong> w<strong>in</strong>d<br />
energy depends on prices, costs, technology and<br />
o<strong>the</strong>r factors. There are substantial constra<strong>in</strong>ts/<br />
issues related to: f<strong>in</strong>ancial feasibility <strong>of</strong> projects,<br />
transmission, environmental plann<strong>in</strong>g and energy<br />
demand/prices.<br />
The Garrad Hassan analysis presents economic<br />
parameters and identifies a threshold price<br />
necessary to yield an after tax real rate <strong>of</strong> return <strong>of</strong><br />
20% (<strong>the</strong> “hurdle rate” is high due to <strong>the</strong> substantial<br />
uncerta<strong>in</strong>ties associated with w<strong>in</strong>d energy) – <strong>the</strong><br />
price determ<strong>in</strong>ed was approximately $100/MWH. We<br />
scaled up <strong>the</strong> Garrad Hassan standard 300 MW facility<br />
to 1,500 MW.<br />
<strong>Economic</strong> Impacts. The direct <strong>in</strong>dustry, <strong>in</strong>direct<br />
supplier and <strong>in</strong>duced consumer respend<strong>in</strong>g impacts<br />
<strong>of</strong> <strong>the</strong> illustrative <strong>of</strong>fshore w<strong>in</strong>d energy scenario is<br />
summarized <strong>in</strong> <strong>the</strong> top part <strong>of</strong> Table 21. The projects<br />
totall<strong>in</strong>g 1,500 MW <strong>in</strong> <strong>in</strong>stalled capacity confer large<br />
project lifetime economic impacts to <strong>the</strong> Prov<strong>in</strong>ce<br />
over <strong>the</strong> construction and operation phases - $12.6<br />
billion <strong>in</strong> prov<strong>in</strong>cial GDP, $2.3 billion <strong>in</strong> Wages &<br />
Benefits, and 42,600 person-years <strong>of</strong> employment.<br />
The bulk <strong>of</strong> <strong>the</strong> benefits occur dur<strong>in</strong>g <strong>the</strong> on-go<strong>in</strong>g<br />
operations phase ra<strong>the</strong>r than <strong>the</strong> construction phase.
<strong>Economic</strong> <strong>Contribution</strong> <strong>of</strong> <strong>the</strong> <strong>Oceans</strong> <strong>Sector</strong> <strong>in</strong> <strong>British</strong> <strong>Columbia</strong> 43<br />
It is not appropriate to compare <strong>the</strong> potential project<br />
lifetime impacts for <strong>of</strong>fshore w<strong>in</strong>d development, such<br />
as <strong>the</strong> top part <strong>of</strong> Table 21, to <strong>the</strong> annual ongo<strong>in</strong>g<br />
impacts <strong>of</strong> exist<strong>in</strong>g ocean sectors presented <strong>in</strong><br />
Section 5. As with <strong>the</strong> oil & gas scenarios analysis,<br />
we converted <strong>the</strong> project lifetime developments to<br />
an annual stream (see bottom part <strong>of</strong> Table 21). The<br />
impacts are significant.<br />
This analysis notwithstand<strong>in</strong>g, <strong>the</strong>re are great<br />
uncerta<strong>in</strong>ties with development <strong>of</strong> <strong>the</strong> <strong>of</strong>fshore<br />
w<strong>in</strong>d resources <strong>in</strong> B.C. The assumptions, projections,<br />
and results should be viewed as illustrative <strong>of</strong> <strong>the</strong><br />
economic potential ra<strong>the</strong>r than a prediction <strong>of</strong> that<br />
potential.<br />
6.3 Tidal and Wave Energy<br />
There is potential to harness <strong>the</strong> immense energy<br />
embodied <strong>in</strong> <strong>the</strong> ocean’s waves, tides and currents.<br />
Energy potential <strong>in</strong>cludes: 1) tidal energy – extract<strong>in</strong>g<br />
<strong>the</strong> k<strong>in</strong>etic energy us<strong>in</strong>g undersea equipment similar<br />
to w<strong>in</strong>d turb<strong>in</strong>es, and 2) wave energy – extract<strong>in</strong>g <strong>the</strong><br />
wave crest to trough energy.<br />
The B.C. government has <strong>in</strong>dicated that <strong>the</strong> prov<strong>in</strong>ce<br />
has significant ocean energy potential, <strong>in</strong>clud<strong>in</strong>g over<br />
6,000 MW <strong>of</strong> wave energy potential and 2,000 MW<br />
<strong>of</strong> tidal energy potential. Worldwide ocean energy<br />
potential from wave, tidal, mar<strong>in</strong>e currents, <strong>the</strong>rmal<br />
and sal<strong>in</strong>ity gradients is estimated at 10-20 terawatts<br />
which is two to four times <strong>the</strong> exist<strong>in</strong>g electricity<br />
consumption <strong>in</strong> <strong>the</strong> world (EMPR, “Ocean Energy -<br />
New Ocean Energy Project Application Directive”,<br />
2007).<br />
There currently are two large scale tidal power<br />
projects <strong>in</strong> operation <strong>in</strong> <strong>the</strong> world - <strong>the</strong> 240 MW<br />
experimental La Rance tidal project <strong>in</strong> Brittany France<br />
that was commissioned <strong>in</strong> 1966, and <strong>the</strong> 20 MW pilot<br />
tidal power project at Annapolis Royal, Nova Scotia<br />
<strong>in</strong> Canada’s Bay <strong>of</strong> Fundy that was launched <strong>in</strong> 1984.<br />
There is a small demonstration tidal power project<br />
near Race Rocks just outside Victoria (Pemb<strong>in</strong>a<br />
Institute 2006).<br />
However, as <strong>the</strong> development <strong>of</strong> tidal and wave<br />
energy technology is not well established, a<br />
quantitative assessment <strong>of</strong> its potential for <strong>British</strong><br />
<strong>Columbia</strong> is not possible at this time.
44<br />
<strong>Economic</strong> <strong>Contribution</strong> <strong>of</strong> <strong>the</strong> <strong>Oceans</strong> <strong>Sector</strong> <strong>in</strong> <strong>British</strong> <strong>Columbia</strong><br />
7.0 Conclusions<br />
The Importance. Through a variety <strong>of</strong> bus<strong>in</strong>ess<br />
and non-bus<strong>in</strong>ess sector activities, <strong>the</strong> ocean<br />
sector makes a very important contribution to <strong>the</strong><br />
economy <strong>of</strong> <strong>British</strong> <strong>Columbia</strong>. In 2005 ocean sector<br />
total impacts – direct <strong>in</strong>dustry, <strong>in</strong>duced supplier plus<br />
<strong>in</strong>duced consumer spend<strong>in</strong>g – from $11.6 <strong>in</strong> Gross<br />
Output were $11.1 billion <strong>in</strong> Gross Domestic Product,<br />
$7.6 billion <strong>in</strong> Labour Income and 167,800 personyears<br />
employment. These economic contributions<br />
represent 7-8% <strong>of</strong> <strong>the</strong> total B.C. economy.<br />
This study has demonstrated that <strong>the</strong> economic<br />
contribution <strong>of</strong> <strong>the</strong> ocean to <strong>the</strong> B.C. economy is<br />
larger and is more broad-based than previously<br />
estimated. Never<strong>the</strong>less, <strong>the</strong> ocean-related economy<br />
has not been well-understood and, <strong>in</strong> large measure,<br />
is “under <strong>the</strong> radar”. It <strong>of</strong>ten is not realized that<br />
several knowledge-based components to <strong>the</strong> ocean<br />
sector exist, and that improvements <strong>in</strong> technology<br />
processes and <strong>in</strong>frastructure are transform<strong>in</strong>g many<br />
<strong>of</strong> <strong>the</strong> traditional goods and service components<br />
such as seafood and ocean transport.<br />
The <strong>in</strong>fluence <strong>of</strong> <strong>the</strong> ocean on <strong>the</strong> lives and<br />
livelihoods <strong>of</strong> <strong>British</strong> <strong>Columbia</strong>ns is more pervasive<br />
than <strong>in</strong>dicated by <strong>the</strong>se market-based economic<br />
contributions. The ocean is <strong>in</strong>tegral not just to <strong>the</strong><br />
economy, but also to our culture, way <strong>of</strong> life, and<br />
collective identity. The ocean also provides key<br />
ecosystem services that underp<strong>in</strong> many <strong>of</strong> <strong>the</strong><br />
identified <strong>in</strong>dustries and make coastal life as we<br />
know it possible. These o<strong>the</strong>r contributions may be<br />
analyzed through non-market studies. The <strong>Oceans</strong><br />
Coord<strong>in</strong>at<strong>in</strong>g Committee has sponsored a review <strong>of</strong><br />
appropriate techniques for measur<strong>in</strong>g non-market<br />
benefits <strong>of</strong> <strong>the</strong> ocean. <strong>British</strong> <strong>Columbia</strong>ns and<br />
Canadians have <strong>the</strong> expectation that each ocean<br />
sector will allow o<strong>the</strong>r users and society at large to<br />
cont<strong>in</strong>ue to enjoy <strong>the</strong> benefits, market and nonmarket<br />
alike, that flow from <strong>the</strong> ocean environment.<br />
Offshore oil & gas and w<strong>in</strong>d farm activity may have<br />
<strong>the</strong> potential to expand <strong>the</strong> economic contribution<br />
<strong>of</strong> <strong>the</strong> ocean environment. But activities such as<br />
ocean high technology, ocean recreation and ocean<br />
transport also may have substantial potential for<br />
growth.<br />
future Research. This study has <strong>in</strong>corporated<br />
significant improvements <strong>in</strong> sector coverage and<br />
improved procedures for analyz<strong>in</strong>g <strong>in</strong>dividual sectors.<br />
Fur<strong>the</strong>r methodological advances are still possible.<br />
The three high growth private sectors – ocean high<br />
tech, ocean recreation, and ports & shipp<strong>in</strong>g – are<br />
prime candidates for such improvements. For<br />
example, <strong>the</strong> measurement <strong>of</strong> <strong>the</strong> ocean recreation/<br />
leisure-based economy would benefit immensely<br />
from targeted research. The research arm <strong>of</strong> <strong>the</strong><br />
Canadian Tourism Commission (CTC), admittedly<br />
hav<strong>in</strong>g a market demand focus, recently has<br />
relocated to Vancouver. A federal-prov<strong>in</strong>cial jo<strong>in</strong>t<br />
venture could be launched.<br />
next Steps. F<strong>in</strong>ally, we note that several federal,<br />
prov<strong>in</strong>cial and <strong>in</strong>dustry agencies/or organizations<br />
have expressed <strong>in</strong>terest <strong>in</strong> our work as <strong>the</strong> study is<br />
closely aligned with <strong>the</strong>ir core activities. It would<br />
be useful to distribute <strong>the</strong> F<strong>in</strong>al Report to <strong>the</strong>se<br />
<strong>in</strong>terests and solicit feedback with a view to ref<strong>in</strong><strong>in</strong>g<br />
<strong>the</strong> approach and data for future work. This first<br />
assessment should be considered a pilot upon<br />
which to build support for a regular report<strong>in</strong>g <strong>of</strong> <strong>the</strong><br />
economic contribution <strong>of</strong> <strong>the</strong> B.C. ocean sector.
<strong>Economic</strong> <strong>Contribution</strong> <strong>of</strong> <strong>the</strong> <strong>Oceans</strong> <strong>Sector</strong> <strong>in</strong> <strong>British</strong> <strong>Columbia</strong> 45<br />
Bibliography<br />
Acton White & Associates, “<strong>Economic</strong> Study <strong>of</strong><br />
Canada’s Mar<strong>in</strong>e and Ocean Industries”, Prepared for<br />
Industry Canada & National Research Council Canada,<br />
Ottawa, March 2001.<br />
Allen Consult<strong>in</strong>g Group, “The <strong>Economic</strong> <strong>Contribution</strong><br />
<strong>of</strong> Australia’s Mar<strong>in</strong>e Industries”, Report to <strong>the</strong><br />
National <strong>Oceans</strong> Office, June 2004.<br />
APEC Integrated & Coastal Management Project,<br />
“Round Table Discussion on <strong>the</strong> <strong>Economic</strong> Valuation<br />
<strong>of</strong> Mar<strong>in</strong>e <strong>Sector</strong> Activities Across APEC Economies:<br />
Summary Record”, Easter Island Chile, 18 October<br />
2004.<br />
ARA Consult<strong>in</strong>g Group, “The Mar<strong>in</strong>e Tourism Industry<br />
<strong>in</strong> B.C.: Opportunity Analysis”, 1991.<br />
BC Hydro, “W<strong>in</strong>d Energy Workshop January 25-26,<br />
2005: Presentations and Meet<strong>in</strong>g Notes”, Vancouver<br />
B.C. M<strong>in</strong>istry <strong>of</strong> Energy, M<strong>in</strong>es and Petroleum<br />
Resources, “The B.C. Energy Plan: A Vision for Clean<br />
Energy Leadership”, 2007.<br />
B.C. M<strong>in</strong>istry <strong>of</strong> Energy, M<strong>in</strong>es and Petroleum<br />
Resources, “Ocean Energy - New Ocean Energy<br />
Project Application Directive”, 2007.<br />
B.C. M<strong>in</strong>istry <strong>of</strong> Environment, “Seafood Year <strong>in</strong><br />
Review”, Annual.<br />
BC Stats, “<strong>British</strong> <strong>Columbia</strong>’s Fisheries & Aquaculture<br />
<strong>Sector</strong> (4 <strong>Sector</strong> Report)”, September 2002.<br />
BC Stats, “<strong>British</strong> <strong>Columbia</strong> <strong>Economic</strong> Multipliers and<br />
How to Use Them”, October 2005<br />
BC Stats & Lead<strong>in</strong>g Edge BC, “Pr<strong>of</strong>ile <strong>of</strong> <strong>the</strong> <strong>British</strong><br />
<strong>Columbia</strong> High Technology <strong>Sector</strong>”, 2005.<br />
Brimar Consultants, “Queen Charlotte/Hecate Bas<strong>in</strong><br />
Oil and Gas Potential”, Prepared for Coast Information<br />
Team, February 2003.<br />
Bus<strong>in</strong>ess Research and <strong>Economic</strong> Advisors (BREA),<br />
“The <strong>Contribution</strong> <strong>of</strong> <strong>the</strong> International Cruise Industry<br />
to <strong>the</strong> Canadian Economy <strong>in</strong> 2003”, Prepared for<br />
North West Cruiseship Association, Vancouver Port<br />
Authority & St. Lawrence Cruise Association, October<br />
2004.<br />
Canada Fisheries and <strong>Oceans</strong>, “Canada’s Oceanic<br />
Manufactur<strong>in</strong>g and Services <strong>Sector</strong> – A Report to <strong>the</strong><br />
National Mar<strong>in</strong>e Council and DFO”, 1990.<br />
Canada Fisheries and <strong>Oceans</strong>, “Snapshot Federal<br />
Mar<strong>in</strong>e Activities <strong>in</strong> Pacific Canada: The Role <strong>of</strong> <strong>the</strong><br />
Federal Government <strong>in</strong> Pacific Canada”, Draft, April<br />
2003.<br />
Canada Fisheries and <strong>Oceans</strong>, “Survey <strong>of</strong> Recreational<br />
Fish<strong>in</strong>g <strong>in</strong> Canada 2000”.<br />
Canada Fisheries and <strong>Oceans</strong>, “Sea Kayak<strong>in</strong>g <strong>in</strong> Pacific<br />
Canada: Fact Sheet”, 2002.<br />
Canada Fisheries and <strong>Oceans</strong>, “Recreational Scuba<br />
Div<strong>in</strong>g <strong>in</strong> Pacific Canada: Fact Sheet”, 2002.<br />
Canada Fisheries and <strong>Oceans</strong>, “Tidal Recreational<br />
Fish<strong>in</strong>g <strong>in</strong> Pacific Canada: Fact Sheet”, 2002.<br />
Canada Fisheries and <strong>Oceans</strong>, “Recreational Boat<strong>in</strong>g<br />
<strong>in</strong> Pacific Canada: Fact Sheet”, 2002.<br />
Canada Fisheries and <strong>Oceans</strong>, “Whale Watch<strong>in</strong>g <strong>in</strong><br />
Pacific Canada: Fact Sheet”, 2002.<br />
Canada Fisheries and <strong>Oceans</strong>, “Canada’s <strong>Oceans</strong><br />
Strategy”, Cat. No. FS77-2/2002E, Ottawa, 2002.<br />
Canada Fisheries and <strong>Oceans</strong>, “Develop<strong>in</strong>g a<br />
Common Methodology and Approach for Future<br />
Ocean Industries Studies: Workshop Report”, Halifax,<br />
May 6-7, 2002.<br />
Canada Fisheries & <strong>Oceans</strong> and B.C. M<strong>in</strong>istry <strong>of</strong><br />
Agriculture, Food & Fisheries, “Memorandum <strong>of</strong><br />
Understand<strong>in</strong>g Respect<strong>in</strong>g <strong>the</strong> Implementation <strong>of</strong><br />
Canada’s <strong>Oceans</strong> Strategy on <strong>the</strong> Pacific Coast <strong>of</strong><br />
Canada”, March 2, 2004.<br />
Canadian Fisheries and <strong>Oceans</strong>, “The Role <strong>of</strong><br />
<strong>the</strong> Federal Government <strong>in</strong> <strong>the</strong> <strong>Oceans</strong> <strong>Sector</strong>”,<br />
DFO/5265, 1997.<br />
Canadian Fisheries and <strong>Oceans</strong>, “The Role <strong>of</strong> <strong>the</strong><br />
Prov<strong>in</strong>cial and Territorial Government <strong>in</strong> <strong>the</strong> <strong>Oceans</strong><br />
<strong>Sector</strong>”, DFO/5512, 1997.<br />
Canada Ports Corporation, “Annual Report”, Annual.<br />
Colgan, Charles S., “Measurement <strong>of</strong> <strong>the</strong> Ocean and<br />
Coastal Economy: Theory and Methods”, Prepared for<br />
National <strong>Oceans</strong> <strong>Economic</strong> Project, December 2003.<br />
Canmac <strong>Economic</strong>s Ltd., Scott Wood, Enterprise<br />
Management Consultants, Michael J.A. Butler and<br />
Claudette LeBlanc, “The Value <strong>of</strong> <strong>the</strong> Ocean <strong>Sector</strong><br />
to <strong>the</strong> Economy <strong>of</strong> Pr<strong>in</strong>ce Edward Island”, Prepared<br />
for Government <strong>of</strong> Pr<strong>in</strong>ce Edward Island and<br />
Government <strong>of</strong> Canada, March 2002.<br />
COIN Pacific, “The Emerg<strong>in</strong>g Opportunity for <strong>the</strong><br />
<strong>British</strong> <strong>Columbia</strong> Maritime Economy as a Driver for<br />
Innovation and <strong>Economic</strong> Diversification”, March<br />
2006.<br />
Douglas-Westwood, “Global Markets for Ocean<br />
Observation Systems”, November 2006.
46<br />
<strong>Economic</strong> <strong>Contribution</strong> <strong>of</strong> <strong>the</strong> <strong>Oceans</strong> <strong>Sector</strong> <strong>in</strong> <strong>British</strong> <strong>Columbia</strong><br />
Dumont, Bill and Don Wright, “Generat<strong>in</strong>g More<br />
Wealth from <strong>British</strong> <strong>Columbia</strong>’s Timber – A Review <strong>of</strong><br />
<strong>British</strong> <strong>Columbia</strong>’s Log Export Policies”, Report to B.C.<br />
M<strong>in</strong>ister <strong>of</strong> Forests and Range, December 2005<br />
<strong>Economic</strong> Plann<strong>in</strong>g Group <strong>in</strong> Association with Juan<br />
de Fuca Environmental Consultants, “<strong>Economic</strong><br />
Impact Analysis <strong>of</strong> Outdoor Recreation <strong>in</strong> <strong>British</strong><br />
<strong>Columbia</strong>’s Central Coast, North Coast and Queen<br />
Charlotte Islands/Haida Gwaii”, Prepared for Outdoor<br />
Recreation Council <strong>of</strong> <strong>British</strong> <strong>Columbia</strong>, December<br />
2003.<br />
Ference Weicker & Company, “WD Approach to Ocean<br />
Development - Review and Recommendations:<br />
F<strong>in</strong>al Report”, Prepared for Western <strong>Economic</strong><br />
Diversification, January 2002.<br />
Gajda, Anna, “Gwaii Haanas User Statistics 2004”,<br />
Gwaii Haanas National Park Reserve and Haida<br />
Heritage Site, March 2005.<br />
Gardner P<strong>in</strong>fold Consult<strong>in</strong>g Economists Ltd., and<br />
MariNova Consult<strong>in</strong>g Ltd., “<strong>Economic</strong> Value <strong>of</strong> <strong>the</strong><br />
Nova Scotia Ocean <strong>Sector</strong>”, Prepared for Government<br />
<strong>of</strong> Canada and Nova Scotia Government, January<br />
2005.<br />
Garrad Hassan, “Assessment <strong>of</strong> <strong>the</strong> Energy Potential<br />
and Estimated Costs <strong>of</strong> W<strong>in</strong>d Energy <strong>in</strong> <strong>British</strong><br />
<strong>Columbia</strong>”, Prepared for BC Hydro, May 2005.<br />
G.E. Bridges & Associates Inc., a “<strong>British</strong> <strong>Columbia</strong><br />
Offshore Oil and Gas Socio-<strong>Economic</strong> Issues Papers<br />
- Illustrative Development Scenarios”, Prepared for<br />
Royal Roads University, May 2004.<br />
G.E. Bridges & Associates Inc., b “<strong>British</strong> <strong>Columbia</strong><br />
Offshore Oil and Gas Socio-<strong>Economic</strong> Issue Papers -<br />
Resource Revenues Report”, Prepared for Royal Roads<br />
University, May 2004.<br />
G.E. Bridges & Associates Inc., c “<strong>British</strong> <strong>Columbia</strong><br />
Offshore Oil and Gas Socio-<strong>Economic</strong> Issue Papers -<br />
Socio-<strong>Economic</strong> Impacts Report”, Prepared for Royal<br />
Roads University, May 2004.<br />
G.E. Bridges & Associates Inc., d “<strong>British</strong> <strong>Columbia</strong><br />
Offshore Oil and Gas Socio-<strong>Economic</strong> Issue Papers -<br />
Human Resources Report”, Prepared for Royal Roads<br />
University, May 2004.<br />
GLJ Petroleum Consultants, “Product Price and<br />
Market Forecasts for <strong>the</strong> Canadian Oil & Gas Industry”,<br />
Quarterly Update, January 2007.<br />
Global Insight, “Impact Analysis <strong>of</strong> <strong>the</strong> Cape W<strong>in</strong>d<br />
Off-Shore Renewable Energy Project on Local, State<br />
and Regional Economies”, Prepared for Cape W<strong>in</strong>d<br />
Associates, September 2003.<br />
Goss, Gilroy Inc., “<strong>Economic</strong> Impact Analysis <strong>of</strong><br />
Recreational Boat<strong>in</strong>g <strong>in</strong> Canada: 2001”, Prepared for<br />
Discover Boat<strong>in</strong>g, August 18, 2003.<br />
Government <strong>of</strong> Newfoundland and Labrador,<br />
Department <strong>of</strong> F<strong>in</strong>ance, <strong>Economic</strong>s and Statistics<br />
Branch, “Estimat<strong>in</strong>g <strong>the</strong> Value <strong>of</strong> <strong>the</strong> Mar<strong>in</strong>e, Coastal<br />
and Ocean Resources <strong>of</strong> Newfoundland and<br />
Labrador”, Prepared for Government <strong>of</strong> Canada and<br />
Government <strong>of</strong> Newfoundland and Labrador, March<br />
2002.<br />
Government <strong>of</strong> Newfoundland, “Estimat<strong>in</strong>g <strong>the</strong><br />
Value <strong>of</strong> <strong>the</strong> Mar<strong>in</strong>e, Coastal and Ocean Resources<br />
<strong>of</strong> Newfoundland and Labrador”, Updated for <strong>the</strong><br />
2001-2004 Period, September 2005.<br />
Grant Thornton, “<strong>Economic</strong> Impacts <strong>of</strong> Aquarium<br />
Operations and Activities”, Prepared for Vancouver<br />
Aquarium Mar<strong>in</strong>e Science Centre, April 2004.<br />
GSGislason & Associates Ltd., and Outcrop Ltd., “The<br />
Mar<strong>in</strong>e-Related Economy <strong>of</strong> NWT and Nunavut”,<br />
Prepared for Fisheries and <strong>Oceans</strong> Canada, W<strong>in</strong>nipeg,<br />
January 2003.<br />
GSGislason & Associates Ltd., “<strong>British</strong> <strong>Columbia</strong><br />
Seafood <strong>Sector</strong> and Tidal Water Recreational Fish<strong>in</strong>g:<br />
A Strengths, Weaknesses, Opportunities and Threats<br />
(SWOT) Assessment”, Prepared for B.C. M<strong>in</strong>istry <strong>of</strong><br />
Agriculture, Food & Fisheries, February 2004.<br />
GSGislason & Associates Ltd., “A Mar<strong>in</strong>e <strong>Sector</strong><br />
National Report Card for Canada: Methodology<br />
Report”, Prepared for Canada Fisheries & <strong>Oceans</strong>,<br />
February 2007.<br />
Hannigan, P.K., J.R. Dietrich, D.J. Lee and K.G. Osadetz,<br />
“Petroleum Resource Potential <strong>of</strong> Sedimentary Bas<strong>in</strong>s<br />
on <strong>the</strong> Pacific Marg<strong>in</strong> <strong>of</strong> Canada”, Geological Survey <strong>of</strong><br />
Canada Bullet<strong>in</strong> No. 564, 2001.<br />
Hite, D., Thomas, C., Faulder, D., Doughty, T., “Natural<br />
Gas - Supply and Demand <strong>in</strong> South-Central Alaska”,<br />
Jo<strong>in</strong>t Meet<strong>in</strong>g Pacific Section, AAPG & Cordilleran<br />
Section GSA, April 29 - May 1, 2005, San Jose,<br />
California, 2005.<br />
Hoyt, Erich, International Fund for Animal Welfare,<br />
“Whale Watch<strong>in</strong>g 2000: Worldwide Tourism Numbers,<br />
Expenditures and Expand<strong>in</strong>g Socioeconomic<br />
Benefits”, August 22, 2000.<br />
Innovation and Science Council <strong>of</strong> <strong>British</strong> <strong>Columbia</strong>,<br />
“Canada’s Pacific Ocean Technology Cluster -<br />
Development Action Plan”, Prepared by Chris<br />
Campbell, January 2004.<br />
International Energy Agency (IEA), “Offshore W<strong>in</strong>d<br />
Experiences”, 2005.
<strong>Economic</strong> <strong>Contribution</strong> <strong>of</strong> <strong>the</strong> <strong>Oceans</strong> <strong>Sector</strong> <strong>in</strong> <strong>British</strong> <strong>Columbia</strong> 47<br />
InterVISTAS Consult<strong>in</strong>g Inc., “Port <strong>of</strong> Vancouver<br />
<strong>Economic</strong> Impact Study”, August 2001.<br />
InterVISTAS Consult<strong>in</strong>g Inc., “Port <strong>of</strong> Vancouver<br />
<strong>Economic</strong> Impact Update”, Prepared for Port <strong>of</strong><br />
Vancouver, May 2005.<br />
Ivanova, Iglika, Dive Industry Association <strong>of</strong> <strong>British</strong><br />
<strong>Columbia</strong> (DIAB.C.), “Recreational Scuba Div<strong>in</strong>g <strong>in</strong><br />
<strong>British</strong> <strong>Columbia</strong>: Survey Report”, July 2004.<br />
Jungwirth, Monika, Simon Fraser University, “The<br />
Backgrounder: The Mar<strong>in</strong>e Tourism Industry <strong>in</strong> Pacific<br />
Canada”, Prepared for Fisheries and <strong>Oceans</strong> Canada,<br />
August 29, 2001.<br />
Kildow, Judith and Charles S. Colgan, “California’s<br />
Ocean Economy”, Prepared Under National Ocean<br />
<strong>Economic</strong>s Program, July 2005.<br />
Kildow, Judith, “Phase I Florida’s Ocean and Coastal<br />
Economies Report”, National Ocean <strong>Economic</strong>s<br />
Program (NOEP), June 2006.<br />
LECG, “Mar<strong>in</strong>e Industry Benefits Study: <strong>Economic</strong><br />
Impact <strong>of</strong> <strong>the</strong> Canadian Mar<strong>in</strong>e Transport Industry”,<br />
September 30, 2004.<br />
Mandale Consult<strong>in</strong>g, Canmac <strong>Economic</strong>s Ltd., and<br />
Janice Plumstead, “Estimat<strong>in</strong>g <strong>the</strong> <strong>Economic</strong> Value<br />
<strong>of</strong> Coastal and Ocean Resources: The Case <strong>of</strong> Nova<br />
Scotia”, Prepared for Government <strong>of</strong> Canada and<br />
Government <strong>of</strong> Nova Scotia, February 1998.<br />
Mandale Consult<strong>in</strong>g, Canmac <strong>Economic</strong>s Ltd., and<br />
P.Y. Chiasson & Associates, “The <strong>Economic</strong> Value<br />
<strong>of</strong> Mar<strong>in</strong>e-Related Resources <strong>in</strong> New Brunswick”,<br />
Prepared for New Brunswick Department <strong>of</strong> Fisheries<br />
and Aquaculture and Department <strong>of</strong> Fisheries and<br />
<strong>Oceans</strong>, May 2000.<br />
Michaud, Jean-Claude et al, “ Estimation de la Valeur<br />
Économique des Industries Associées au Doma<strong>in</strong>e<br />
Maritime au Québec”, Universitée du Québec à<br />
Rimouski, April 2002.<br />
Ocean Renewable Energy Group (OREG), “The<br />
Path Forward: A Plan for Canada <strong>in</strong> <strong>the</strong> World <strong>of</strong><br />
Renewable Ocean Energy”, March 2006.<br />
Parks Canada, “Visitor Information Program: National<br />
Summary Report, 2005.<br />
Pemb<strong>in</strong>a Institute, “Maximiz<strong>in</strong>g Energy Efficiency and<br />
Renewable Energy <strong>in</strong> <strong>British</strong> <strong>Columbia</strong>”, October 2006<br />
Philcox, Neil, “Literature Review and Framework<br />
Analysis <strong>of</strong> Non-Market Goods and Services Provided<br />
by <strong>British</strong> <strong>Columbia</strong>’s Ocean and Mar<strong>in</strong>e Coastal<br />
Resources”, Prepared for Canada/<strong>British</strong> <strong>Columbia</strong><br />
<strong>Oceans</strong> Coord<strong>in</strong>at<strong>in</strong>g Committee, March 2007.<br />
Pugh, David and Leonard Sk<strong>in</strong>ner, “A New Analysis<br />
<strong>of</strong> Mar<strong>in</strong>e-Related Activities <strong>in</strong> <strong>the</strong> UK Economy<br />
with Support<strong>in</strong>g Science and Technology”, IACMST<br />
Information Document No. 10, August 2002.<br />
Research Resolutions & Consult<strong>in</strong>g Ltd.,<br />
“Opportunities for <strong>British</strong> <strong>Columbia</strong>: Activity Based<br />
Tourism <strong>in</strong> Canada”, Prepared for Tourism <strong>British</strong><br />
<strong>Columbia</strong>, August 2004.<br />
Roger A. Stacey Consultants Ltd. (RASCL), “Canada’s<br />
Ocean Industries: <strong>Contribution</strong> to <strong>the</strong> Economy<br />
1988-1996”, Prepared for Fisheries & <strong>Oceans</strong> Canada,<br />
1998.<br />
Roger A. Stacey Consultants Ltd. (RASCL), “Canada’s<br />
Ocean Industries: <strong>Contribution</strong> to <strong>the</strong> Economy<br />
1988-2000”, Prepared for Fisheries & <strong>Oceans</strong> Canada,<br />
Ottawa, September 2003.<br />
Roslyn Kun<strong>in</strong> and Associates Inc., “Occupational<br />
Pr<strong>of</strong>iles <strong>of</strong> Selected Occupational Groups <strong>in</strong> <strong>the</strong><br />
Mar<strong>in</strong>e <strong>Sector</strong> <strong>of</strong> B.C.”, Draft F<strong>in</strong>al Report Presented to<br />
Maritime <strong>Sector</strong> Human Resources Strategic Plann<strong>in</strong>g<br />
Committee <strong>of</strong> <strong>the</strong> Western Mar<strong>in</strong>e Community,<br />
October 2005.<br />
Royal Roads University, “<strong>British</strong> <strong>Columbia</strong> Offshore Oil<br />
and Gas Socio-<strong>Economic</strong> Issue Papers - Introduction<br />
and Overview”, May 2004.<br />
Science Council <strong>of</strong> B.C., “Ocean Opportunities for <strong>the</strong><br />
West Coast <strong>of</strong> Canada: Strategic Framework Overview<br />
Report”, Strategic Plann<strong>in</strong>g for Applied Research and<br />
Knowledge (SPARK), April 1993.<br />
Sc<strong>of</strong>ield, John A. and Gurmit S. Sandhu, “Regional<br />
Expenditure Benefits <strong>of</strong> Offshore Oil and Gas Activity<br />
<strong>in</strong> <strong>the</strong> Queen Charlotte Bas<strong>in</strong> <strong>of</strong> <strong>British</strong> <strong>Columbia</strong>: A<br />
Basel<strong>in</strong>e Analysis”, Coasts Under Stress Work<strong>in</strong>g Paper,<br />
December 2005.<br />
Simon Fraser University, “A Review <strong>of</strong> Offshore Oil<br />
and Gas Development <strong>in</strong> <strong>British</strong> <strong>Columbia</strong>”, Study<br />
Prepared for <strong>the</strong> Coastal First Nations by <strong>the</strong> School<br />
<strong>of</strong> Resource and Environmental Management, May<br />
2004.<br />
Statistics Canada, “Aquaculture Statistics 2005”, Cat<br />
No. 23-222-XIE, Annual.<br />
Statistics Canada, “Census <strong>of</strong> Manufactures”, Cat No.<br />
31-203, Annual.<br />
Statistics Canada, “Prov<strong>in</strong>cial GDP by Industry”, Cat<br />
No. 15-203-XPB, Annual.<br />
Statistics Canada, “Shipp<strong>in</strong>g <strong>in</strong> Canada”, Cat. No.<br />
54-205, Annual.<br />
Statistics Canada, “Capital Expenditures by Type <strong>of</strong><br />
Asset”, Cat. No. 61-233, Annual.
48<br />
<strong>Economic</strong> <strong>Contribution</strong> <strong>of</strong> <strong>the</strong> <strong>Oceans</strong> <strong>Sector</strong> <strong>in</strong> <strong>British</strong> <strong>Columbia</strong><br />
Statistics Canada, “Private and Public Investment <strong>in</strong><br />
Canada, Intentions”, Cat. No. 61-205-XIE, Annual.<br />
Statistics Canada, “Gross Domestic Product by<br />
Industry: Sources and Methods, Cat. No. 65-547-XIE,<br />
2002.<br />
Statistics Canada, “Oil and Gas Extraction”, Cat. No.<br />
26-213-XIE, Annual.<br />
Statistics Canada, “National Tourism Indicators:<br />
Historical Estimates 1986-2000”, Cat. No. 13-220-XIB.<br />
Statistics Canada, “2003 Prov<strong>in</strong>cial Input-Output<br />
Multipliers – <strong>British</strong> <strong>Columbia</strong>”, Cat. No. 15F0042XDB,<br />
2006.<br />
Statistics Canada, “Prov<strong>in</strong>cial Gross Output by<br />
Industry and <strong>Sector</strong>”, Cat No. 15-210-XIE, Annual.<br />
Statistics Canada, “Prov<strong>in</strong>cial Gross Domestic Product<br />
(GDP) by Industry and <strong>Sector</strong> at Basic Price”, Cat. No.<br />
15-209-XCB, Annual.<br />
Statistics Canada, “Information and Communications<br />
Technologies <strong>in</strong> Canada”, Cat. No. 56-506-XCB,<br />
December 2001.<br />
Statistics Canada, “Census <strong>of</strong> Canada 2001”.<br />
Statistics New Zealand, “New Zealand’s Mar<strong>in</strong>e<br />
Economy”, 1997-2002.<br />
Stuart Gale & Associates and Pierce Lefebvre<br />
Consult<strong>in</strong>g, “Mar<strong>in</strong>e Ecotourism: Sea Kayak<strong>in</strong>g Tour<br />
Operators”, Prepared for B.C. Susta<strong>in</strong>able Resource<br />
Management, January 2003.<br />
Stuart Gale & Associates and Pierce Lefebvre<br />
Consult<strong>in</strong>g, “Mar<strong>in</strong>e Ecotourism – Overview”,<br />
Prepared for B.C. Susta<strong>in</strong>able Resource Management,<br />
January 2003.<br />
Stuart Gale & Associates and Pierce Lefebvre<br />
Consult<strong>in</strong>g, “Mar<strong>in</strong>e Ecotourism: Mar<strong>in</strong>e Cruis<strong>in</strong>g<br />
Operators”, B.C. Susta<strong>in</strong>able Resource Management,<br />
January 2003.<br />
The Royal Society <strong>of</strong> Canada, “Report <strong>of</strong> <strong>the</strong> Expert<br />
Panel on Science Issues Related to Oil & Gas Activities,<br />
Offshore <strong>British</strong> <strong>Columbia</strong>”, February 2004.<br />
Tourism <strong>British</strong> <strong>Columbia</strong>, “<strong>Economic</strong> Value <strong>of</strong> <strong>the</strong><br />
Commercial Nature-Based Tourism Industry <strong>in</strong> <strong>British</strong><br />
<strong>Columbia</strong>”, September 2004.<br />
Tourism <strong>British</strong> <strong>Columbia</strong>, “Characteristics <strong>of</strong> <strong>the</strong><br />
Commercial Nature-Based Tourism Industry <strong>in</strong> <strong>British</strong><br />
<strong>Columbia</strong>”, January 2005.<br />
Transport Canada, “Cruise Industry Statistics”.<br />
Transport Canada, “Transportation <strong>in</strong> Canada”,<br />
Annual.<br />
US Commissioner on Ocean Policy, “Our <strong>Oceans</strong>: A<br />
Natural Asset”.<br />
Wade Locke <strong>Economic</strong> Consult<strong>in</strong>g, Strategic Concepts<br />
Inc. and Jacques Whitford, “<strong>Economic</strong> Overview <strong>of</strong><br />
Oil and Gas Resources Found <strong>in</strong> <strong>the</strong> Queen Charlotte<br />
Bas<strong>in</strong>, Prepared for NRCan, April 15, 2006.<br />
White, Ken and Ian Bro<strong>the</strong>rson, “B.C. North Coast<br />
Ocean Observation System <strong>Economic</strong> Analysis Study”,<br />
March 31, 2006.
<strong>Economic</strong> <strong>Contribution</strong> <strong>of</strong> <strong>the</strong> <strong>Oceans</strong> <strong>Sector</strong> <strong>in</strong> <strong>British</strong> <strong>Columbia</strong> 49<br />
Appendix A: 2001 Census Employment <strong>in</strong> B.C.<br />
Table A.1: 2001 B.C. Census Employment <strong>in</strong> Mar<strong>in</strong>e-Related Private Industries -<br />
<strong>British</strong> <strong>Columbia</strong> Total<br />
Employment Category<br />
NAICS/<strong>Sector</strong> Employed Unemployed Labour Force<br />
A. Mar<strong>in</strong>e-Related <strong>Sector</strong>s<br />
1. Seafood<br />
1141 Fish<strong>in</strong>g 3,335 1,690 5,025<br />
1125 Aquaculture NA NA NA<br />
3117 Seafood Process<strong>in</strong>g 4,390 1,065 5,460<br />
Subtotal NA NA NA<br />
2. Forestry & Related Manufactur<strong>in</strong>g<br />
113 Forestry & Logg<strong>in</strong>g 16,960 6,850 23,815<br />
321 Wood Product Mfg 41,815 4,215 46,025<br />
322 Paper Mfg 15,660 675 16,335<br />
Subtotal 74,435 11,740 86,175<br />
3. O<strong>the</strong>r Manufactur<strong>in</strong>g<br />
3345 Navigational Measur<strong>in</strong>g etc Mfg 1,650 110 1,765<br />
3366 Ship & Boat Build<strong>in</strong>g 4,385 340 4,720<br />
Subtotal 6,035 450 6,485<br />
4. Mar<strong>in</strong>e Transport<br />
4831 Deep Sea Transport (<strong>in</strong>c Ferries) 5,415 345 5,755<br />
4883 Support Activities - Water Transport 4,510 230 4,755<br />
Subtotal 9,925 575 10,510<br />
B. O<strong>the</strong>r <strong>Sector</strong>s 1,785,855 160,450 1,946,285<br />
C. Total Prov<strong>in</strong>ce - All <strong>Sector</strong>s 1,883,975 175,970 2,059,940<br />
Source: 2001 Census <strong>of</strong> Canada<br />
Note: 1. Labour Force = Employed + Unemployed
50<br />
<strong>Economic</strong> <strong>Contribution</strong> <strong>of</strong> <strong>the</strong> <strong>Oceans</strong> <strong>Sector</strong> <strong>in</strong> <strong>British</strong> <strong>Columbia</strong><br />
Table A.2: 2001 B.C. Census Employment <strong>in</strong> Mar<strong>in</strong>e-Related Private Industries -<br />
North Coast<br />
Employment Category<br />
NAICS/<strong>Sector</strong> Employed Unemployed Labour Force<br />
A. Mar<strong>in</strong>e-Related <strong>Sector</strong>s<br />
1. Seafood<br />
1141 Fish<strong>in</strong>g 360 315 670<br />
1125 Aquaculture NA NA NA<br />
3117 Seafood Process<strong>in</strong>g 400 360 760<br />
Subtotal NA NA NA<br />
2. Forestry & Related Manufactur<strong>in</strong>g<br />
113 Forestry & Logg<strong>in</strong>g 1,240 590 1,830<br />
321 Wood Product Mfg 1,945 340 2,285<br />
322 Paper Mfg 1,375 85 1,465<br />
Subtotal 4,560 1,015 5,580<br />
3. O<strong>the</strong>r Manufactur<strong>in</strong>g<br />
3345 Navigational Measur<strong>in</strong>g etc Mfg 10 0 10<br />
3366 Ship & Boat Build<strong>in</strong>g 55 15 70<br />
Subtotal 65 15 80<br />
4. Mar<strong>in</strong>e Transport<br />
4831 Deep Sea Transport (<strong>in</strong>c Ferries) 200 55 260<br />
4883 Support Activities - Water Transport 145 20 165<br />
Subtotal 345 75 425<br />
B. O<strong>the</strong>r <strong>Sector</strong>s 31,035 4,935 35,960<br />
C. Total Region - All <strong>Sector</strong>s 36,765 6,715 43,475<br />
Source: 2001 Census <strong>of</strong> Canada<br />
Note: 1. Labour Force = Employed + Unemployed<br />
Table A.3: 2001 B.C. Census Employment <strong>in</strong> Mar<strong>in</strong>e-Related Private Industries -<br />
Vancouver Island<br />
NAICS/<strong>Sector</strong><br />
A. Mar<strong>in</strong>e-Related <strong>Sector</strong>s<br />
Employed<br />
Employment Category<br />
Unemployed Labour Force<br />
1. Seafood<br />
1141 Fish<strong>in</strong>g 1,640 835 2,470<br />
1125 Aquaculture NA NA NA<br />
3117 Seafood Process<strong>in</strong>g 1,355 160 1,510<br />
Subtotal NA NA NA<br />
2. Forestry & Related Manufactur<strong>in</strong>g<br />
113 Forestry & Logg<strong>in</strong>g 6,390 1,175 7,560<br />
321 Wood Product Mfg 4,495 1,005 5,505<br />
322 Paper Mfg 5,085 190 5,280<br />
Subtotal 15,970 2,370 18,345<br />
3. O<strong>the</strong>r Manufactur<strong>in</strong>g<br />
3345 Navigational Measur<strong>in</strong>g etc Mfg 425 0 435<br />
3366 Ship & Boat Build<strong>in</strong>g 1,345 100 1,435<br />
Subtotal 1,770 100 1,870<br />
4. Mar<strong>in</strong>e Transport<br />
4831 Deep Sea Transport (<strong>in</strong>c Ferries) 2,560 145 2,710<br />
4883 Support Activities - Water Transport 640 45 690<br />
Subtotal 3,200 190 3,400<br />
B. O<strong>the</strong>r <strong>Sector</strong>s 295,180 27,705 322,875<br />
C. Total Region - All <strong>Sector</strong>s<br />
Source: 2001 Census <strong>of</strong> Canada<br />
Note: 1. Labour Force = Employed + Unemployed<br />
319,115 31,360 350,470
<strong>Economic</strong> <strong>Contribution</strong> <strong>of</strong> <strong>the</strong> <strong>Oceans</strong> <strong>Sector</strong> <strong>in</strong> <strong>British</strong> <strong>Columbia</strong> 51<br />
Table A.4: 2001 B.C. Census Employment <strong>in</strong> Mar<strong>in</strong>e-Related Private<br />
Industries - Lower Ma<strong>in</strong>land<br />
NAICS/<strong>Sector</strong><br />
A. Mar<strong>in</strong>e-Related <strong>Sector</strong>s<br />
Employed<br />
Employment Category<br />
Unemployed Labour Force<br />
1. Seafood<br />
1141 Fish<strong>in</strong>g 1,240 460 1,720<br />
1125 Aquaculture NA NA NA<br />
3117 Seafood Process<strong>in</strong>g 2,615 520 3,140<br />
Subtotal NA NA NA<br />
2. Forestry & Related Manufactur<strong>in</strong>g<br />
113 Forestry & Logg<strong>in</strong>g 2,625 390 3,035<br />
321 Wood Product Mfg 13,395 1,445 14,825<br />
322 Paper Mfg 4,900 115 5,010<br />
Subtotal 20,920 1,950 22,870<br />
3. O<strong>the</strong>r Manufactur<strong>in</strong>g<br />
3345 Navigational Measur<strong>in</strong>g etc Mfg 1,035 100 1,135<br />
3366 Ship & Boat Build<strong>in</strong>g 2,505 175 2,700<br />
Subtotal 3,540 275 3,835<br />
4. Mar<strong>in</strong>e Transport<br />
4831 Deep Sea Transport (<strong>in</strong>c Ferries) 2,550 125 2,650<br />
4883 Support Activities - Water Transport 3,645 150 3,795<br />
Subtotal 6,195 275 6,445<br />
B. O<strong>the</strong>r <strong>Sector</strong>s 1,097,215 86,545 1,183,745<br />
C. Total Region - All <strong>Sector</strong>s<br />
Source: 2001 Census <strong>of</strong> Canada<br />
1,131,725 90,025 1,221,755<br />
Note: 1. Labour Force = Employed + Unemployed<br />
Table A.5: 2001 B.C. Census Employment <strong>in</strong> Mar<strong>in</strong>e-Related Private<br />
Industries - O<strong>the</strong>r B.C.<br />
NAICS/<strong>Sector</strong><br />
A. Mar<strong>in</strong>e-Related <strong>Sector</strong>s<br />
Employed<br />
Employment Category<br />
Unemployed Labour Force<br />
1. Seafood<br />
1141 Fish<strong>in</strong>g 95 80 165<br />
1125 Aquaculture NA NA NA<br />
3117 Seafood Process<strong>in</strong>g 20 25 50<br />
Subtotal NA NA NA<br />
2. Forestry & Related Manufactur<strong>in</strong>g<br />
113 Forestry & Logg<strong>in</strong>g 6,705 4,695 11,390<br />
321 Wood Product Mfg 21,980 1,425 23,410<br />
322 Paper Mfg 4,300 285 4,580<br />
Subtotal 32,985 6,405 39,380<br />
3. O<strong>the</strong>r Manufactur<strong>in</strong>g<br />
3345 Navigational Measur<strong>in</strong>g etc Mfg 180 10 185<br />
3366 Ship & Boat Build<strong>in</strong>g 480 50 515<br />
Subtotal 660 60 700<br />
4. Mar<strong>in</strong>e Transport<br />
4831 Deep Sea Transport (<strong>in</strong>c Ferries) 105 20 135<br />
4883 Support Activities - Water Transport 80 15 105<br />
Subtotal 185 35 240<br />
B. O<strong>the</strong>r <strong>Sector</strong>s 362,425 41,265 403,705<br />
C. Total Region - All <strong>Sector</strong>s<br />
Source: 2001 Census <strong>of</strong> Canada<br />
396,370 47,870 444,240<br />
Note: 1. Labour Force = Employed + Unemployed
52<br />
<strong>Economic</strong> <strong>Contribution</strong> <strong>of</strong> <strong>the</strong> <strong>Oceans</strong> <strong>Sector</strong> <strong>in</strong> <strong>British</strong> <strong>Columbia</strong><br />
Appendix B: Background - Seafood<br />
Table B.1: B.C. Seafood Production and Values<br />
1997 1998 1999 2000 2001 2002 2003 2004 2005<br />
Production ‘000 tonnes<br />
Capture - salmon 49 30 17 19 25 33 39 26 26<br />
- herr<strong>in</strong>g 32 34 27 28 24 27 30 25 30<br />
- shellfish 19 20 17 18 20 19 20 22 18<br />
- groundfish 143 139 140 75 116 115 128 181 168<br />
- o<strong>the</strong>r 2 2 5 6 7 6 9 15 11<br />
Subtotal 245 225 206 146 192 200 226 269 253<br />
Aquaculture - salmon 36 42 50 50 68 84 73 62 71<br />
- shellfish 6 6 6 6 9 9 10 9 10<br />
Subtotal 42 48 56 56 77 93 83 71 81<br />
Total 287 273 262 202 269 293 309 340 334<br />
Landed/Farm Value $ millions<br />
Capture - salmon 109 54 26 50 37 57 49 53 33<br />
- herr<strong>in</strong>g 67 37 49 50 46 49 45 34 31<br />
- shellfish 112 94 94 118 130 109 124 128 122<br />
- groundfish 128 122 131 137 125 131 137 149 157<br />
- o<strong>the</strong>r 3 1 11 17 21 13 16 31 21<br />
Subtotal 419 308 311 372 359 359 371 395 364<br />
Aquaculture - salmon 176 229 291 282 271 289 256 225 319<br />
- shellfish 9 9 11 12 17 15 18 16 17<br />
Subtotal 185 238 302 294 288 304 274 241 336<br />
Total 604 546 613 666 647 663 645 636 700<br />
Wholesale Value $ millions<br />
Capture - salmon 306 208 171 200 162 199 188 219 212<br />
- herr<strong>in</strong>g 117 108 122 129 113 130 109 91 86<br />
- shellfish 147 137 140 169 182 181 193 193 178<br />
- groundfish 199 219 209 195 224 236 280 260 286<br />
- o<strong>the</strong>r 9 8 15 24 26 23 27 44 37<br />
Subtotal 778 680 657 717 707 769 797 807 799<br />
Aquaculture - salmon 229 264 334 326 323 339 302 288 371<br />
- shellfish 11 16 18 23 26 28 31 27 32<br />
Subtotal 240 280 352 349 349 367 333 315 403<br />
Total 1,018 960 1,009 1,066 1,056 1,136 1,130 1,122 1,202<br />
Source: B.C. M<strong>in</strong>istry <strong>of</strong> Environment<br />
Notes: 1. Wholesale value <strong>in</strong>cludes processed value <strong>of</strong> raw fish imported from outside <strong>the</strong> prov<strong>in</strong>ce.<br />
2. Production is round (whole) weight.
<strong>Economic</strong> <strong>Contribution</strong> <strong>of</strong> <strong>the</strong> <strong>Oceans</strong> <strong>Sector</strong> <strong>in</strong> <strong>British</strong> <strong>Columbia</strong> 53<br />
Table B.2: Exports <strong>of</strong> B.C. Fish and Seafood Products<br />
Wild Salmon Farmed Salmon Herr<strong>in</strong>g<br />
$ millions<br />
O<strong>the</strong>r F<strong>in</strong>fish Shellfish O<strong>the</strong>r NES All<br />
1990 457 12 155 87 50 15 776<br />
1991 353 45 127 110 56 12 703<br />
1992 312 93 118 114 77 14 728<br />
1993 299 112 151 134 91 13 800<br />
1994 346 140 127 158 117 12 900<br />
1995 187 176 152 170 147 16 848<br />
1996 191 149 194 148 149 14 845<br />
1997 190 208 98 172 147 14 829<br />
1998 144 241 89 206 120 13 813<br />
1999 104 255 94 269 118 13 853<br />
2000 117 227 127 278 139 15 903<br />
2001 135 360 96 221 141 18 974<br />
2002 156 385 91 256 118 23 1,029<br />
2003 157 311 81 268 153 26 996<br />
2004 181 236 84 285 179 19 984<br />
2005 154 302 82 273 164 19 994<br />
Source: Statistics Canada as reported by BC Stats, “<strong>British</strong> <strong>Columbia</strong>’s Fisheries and Aquaculture <strong>Sector</strong>, 2006 Edition”, Draft, 2006.<br />
Notes: 1. The term “export value” is not <strong>the</strong> same as “wholesale value” i.e., “export value” can <strong>in</strong>clude freight and <strong>in</strong>surance charges.<br />
2. “Farmed salmon” refers to fresh farmed salmon (whole and fillets) - all o<strong>the</strong>r salmon exports are deemed to be “wild salmon”.<br />
3. “NES” means Not Elsewhere Specified.
54<br />
<strong>Economic</strong> <strong>Contribution</strong> <strong>of</strong> <strong>the</strong> <strong>Oceans</strong> <strong>Sector</strong> <strong>in</strong> <strong>British</strong> <strong>Columbia</strong><br />
Appendix C: Background - forestry<br />
Table C.1: B.C. Forest <strong>Sector</strong> Pr<strong>of</strong>ile<br />
A. B.C. log Production 1997 to 2005<br />
1997 1998 1999 2000 2001 2002 2003 2004 2005 10 Year Average<br />
Log Production million m3<br />
Coast 22 19 24 23 22 22 17 28 22 22 (30%)<br />
Interior 46 46 52 50 50 51 51 64 61 52 (70%)<br />
68 65 76 73 72 73 68 92 83 74<br />
Source: Coast Forest Products Association and BC Stats<br />
B. B.C. log Exports<br />
Coast<br />
B.C. Log Exports as % <strong>of</strong> Log Production<br />
Interior All<br />
Selected Years<br />
1996 NA NA 0.6%<br />
2001 NA NA 3.9%<br />
2005 21.0% 0.7% 6.1%<br />
Source: Bill Dumont & Don Wright, “Generat<strong>in</strong>g More Wealth from <strong>British</strong> <strong>Columbia</strong>’s Timber: A Review <strong>of</strong> <strong>British</strong> <strong>Columbia</strong>’s Log Export Policies”, Report to<br />
<strong>British</strong> <strong>Columbia</strong> M<strong>in</strong>ister <strong>of</strong> Forests and Range, December 2006<br />
C. B.C. forest <strong>Sector</strong> Commodity data<br />
1997 1998 1999 2000 2001 2002 2003 2004 2005<br />
Lumber Production million m3 31.6 30.2 32.4 34.3 32.6 36.6 36.0 39.9 41.0<br />
Market Pulp Shipments ‘000 tonnes 4,530 4,460 5,000 5,150 4,710 4,480 4,760 4,720 4,930<br />
Newspr<strong>in</strong>t, O<strong>the</strong>r Paper & Paperboard ‘000 tonnes 2,650 2,570 3,020 3,130 2,880 2,900 2,920 2,980 2,980<br />
Source: BC Stats
<strong>Economic</strong> <strong>Contribution</strong> <strong>of</strong> <strong>the</strong> <strong>Oceans</strong> <strong>Sector</strong> <strong>in</strong> <strong>British</strong> <strong>Columbia</strong> 55<br />
Table C.2: Direct Impacts <strong>of</strong> Forest <strong>Sector</strong> <strong>in</strong> B.C.<br />
2002 2003 2004 2005<br />
A. Total Forest <strong>Sector</strong><br />
Forestry & Logg<strong>in</strong>g NAICS 113<br />
Gross Output $ millions 5,740 5,609 7,800a 6,800a GDP $ millions 2,713 2,566 3,670a 3,200a Labour Income $ millions 1,714 1,645a 1,755a,b 1,780a,b Employment PYs 26,630 25,020 26,140 26,000a,b Wood Products NAICS 321<br />
Gross Output $ millions 11,777 10,728 13,400 a 12,100 a<br />
GDP $ millions 3,979 3,464 4,560 a 4,110 a<br />
Labour Income $ millions 2,200 2,250 a 2,335 2,325<br />
Employment PYs 37,590 37,650 38,290 37,400<br />
Paper Manufactur<strong>in</strong>g NAICS 322<br />
Gross Output $ millions 5,592 5,739 6,300 a 6,000 a<br />
GDP $ millions 1,453 1,240 1,700 a 1,620 a<br />
Labour Income $ millions 1,060 1,060 a,b 1,090 a,b 1,085 a,b<br />
Employment PYs 16,260 16,000 16,060 15,680<br />
B. Ocean-Related Forest <strong>Sector</strong><br />
Gross Output $ millionsc 269 256 308 283<br />
GDP $ millions 100 90 118 108<br />
Labour Income $ millions 60 58 59 60<br />
Employment PYs 960 930 910 910<br />
Source: Gross Output & GDP - Statistics Canada Input Output Division<br />
Labour Income & Employment - Statistics Canada Labour Division<br />
a estimates<br />
b assumed wage rates <strong>in</strong>crease 2% per year, <strong>the</strong> <strong>in</strong>crease <strong>in</strong> <strong>the</strong> Consumer Price Index (CPI)<br />
c ocean-related output = .015 wood products & paper output (30% coastal share x 5% ocean share <strong>of</strong> coastal) plus logg<strong>in</strong>g output x .02 ocean share <strong>of</strong><br />
coastal logg<strong>in</strong>g x share <strong>of</strong> prov<strong>in</strong>cial logg<strong>in</strong>g output exported from <strong>the</strong> coast (4.5% <strong>in</strong> 2002, 5% <strong>in</strong> 2003, 5.5% <strong>in</strong> 2004, 6% <strong>in</strong> 2005 i.e., 6% = 30% coastal share x<br />
20% export share <strong>in</strong> 2005) plus $3 million spent annually <strong>in</strong> log boom tenures.
56<br />
<strong>Economic</strong> <strong>Contribution</strong> <strong>of</strong> <strong>the</strong> <strong>Oceans</strong> <strong>Sector</strong> <strong>in</strong> <strong>British</strong> <strong>Columbia</strong><br />
Appendix d: Background - Ship & Boat Build<strong>in</strong>g<br />
Table D.1: Direct Impacts <strong>of</strong> Ship & Boat Build<strong>in</strong>g <strong>in</strong> B.C.<br />
2002 2003 2004 2005<br />
A. Total Ship Build<strong>in</strong>g & Boat Build<strong>in</strong>g<br />
Ship Build<strong>in</strong>g & Repair<strong>in</strong>g NAICS 33661<br />
Gross Output $ millions 175 217 200b 200b GDP $ millions 83 105 96b 96b Labour Income $ millions 70 87 80 80<br />
Employment PYs 1,070 1,300 1,180 1,150<br />
Boat Build<strong>in</strong>g NAICS 33662<br />
Gross Output $ millions 225 228 200 b 220 b<br />
GDP $ millions 88 92 80 b 88 b<br />
Labour Income $ millions 68 68 60 66<br />
Employment PYs 1,610 1,600 1,370 1,480<br />
B. Ocean-Related Ship & Boat Build<strong>in</strong>ga<br />
Gross Output $ millionsc 378 422 380 398<br />
GDP $ millions 162 188 168 175<br />
Labour Income $ millions 131 148 134 139<br />
Employment PYs 2,520 2,740 2,410 2,480<br />
Source: Gross Output & GDP - Statistics Canada Input Output Division<br />
Labour Income & Employment - 40% <strong>of</strong> Gross Output for Ship Build<strong>in</strong>g/30% <strong>of</strong> Gross Output for Boat Build<strong>in</strong>g (based on Stats Can “2003<br />
Prov<strong>in</strong>cial Input-Output Multipliers – <strong>British</strong> <strong>Columbia</strong>”, Cat. No. 15-210-XIE)<br />
Employment - 6 per $1 million Gross Output for Ship Build<strong>in</strong>g/7 per $1 million Gross Output for Boat Build<strong>in</strong>g (2003 ratios from above Stats Can<br />
multipliers)<br />
- ratios for o<strong>the</strong>r years adjusted based on 2% <strong>in</strong>flation rate<br />
a ocean-related - 100% <strong>of</strong> Ship Build<strong>in</strong>g + 90% Boat Build<strong>in</strong>g (10% estimate for freshwater boat construction)<br />
b estimate<br />
Table D.2: Exports <strong>of</strong> Ships and Boats from B.C.<br />
$ millions<br />
Fish<strong>in</strong>g Vessels & Factory Ships Pleasure Boats & Motors<br />
Subtotal<br />
1997 4 50 54<br />
1998 4 93 97<br />
1999 5 109 114<br />
2000 6 86 92<br />
2001 8 173 181<br />
2002 10 177 187<br />
2003 9 155 164<br />
2004 10 98 198<br />
2005 11 97 108<br />
Source: Statistics Canada as reported by BC Stats, “<strong>British</strong> <strong>Columbia</strong>’s Fisheries and Aquaculture <strong>Sector</strong>, 2006 Edition, Draft 2006.
<strong>Economic</strong> <strong>Contribution</strong> <strong>of</strong> <strong>the</strong> <strong>Oceans</strong> <strong>Sector</strong> <strong>in</strong> <strong>British</strong> <strong>Columbia</strong> 57<br />
Appendix E: Background - Mar<strong>in</strong>e Construction<br />
Table E.1: Capital Investments by B.C. Port Authorities<br />
$ millions<br />
Port Authority 2004 2005<br />
Vancouver 33.8 21.9<br />
Fraser River 5.3 5.0 *<br />
North Fraser 0.3 0.1<br />
Pr<strong>in</strong>ce Rupert 2.3 5.0<br />
Nanaimo 1.0 0.9<br />
Port Alberni 0.5 0.3<br />
43.2 33.2<br />
Source: Port Authority F<strong>in</strong>ancial Statements (excludes land purchases/sales).<br />
* Estimate (Apr/06 year-end f<strong>in</strong>ancials for Fraser River Port Authority will not be released until June/07).
58<br />
<strong>Economic</strong> <strong>Contribution</strong> <strong>of</strong> <strong>the</strong> <strong>Oceans</strong> <strong>Sector</strong> <strong>in</strong> <strong>British</strong> <strong>Columbia</strong><br />
Appendix f: Background - Ocean high Tech<br />
Table F.1: The B.C. High Technology <strong>Sector</strong><br />
Revenues $ millions GDP $ millions<br />
Mfg Services Total Mfg Services Total<br />
1997 1,763 7,226 8,988 743 4,354 5,096<br />
1998 1,845 7,920 9,764 734 4,689 5,423<br />
1999 2,267 8,494 10,761 920 4,590 5,509<br />
2000 2,819 8,870 11,689 1,254 4,944 6,198<br />
2001 2,524 8,900 11,424 1,096 5,156 6,252<br />
2002 2,122 9,961 12,082 871 5,715 6,586<br />
2003 2,241 10,860 13,101 939 6,233 7,172<br />
2004 2,333 11,662 13,996 1,010 6,627 7,637<br />
2005e 2,500 12,500 15,000 1,075 7,150 8,225<br />
Employment person-years Wages & Salaries $ millions<br />
Mfg Services Total Mfg Services Total<br />
1997 10,790 43,950 54,730 386 2,296 2,682<br />
1998 11,230 42,730 53,970 448 2,121 2,569<br />
1999 13,620 45,880 59,500 506 2,217 2,723<br />
2000 15,050 49,260 64,310 555 2,526 3,081<br />
2001 15,200 52,720 67,920 633 2,752 3,385<br />
2002 14,080 51,310 65,380 712 2,691 3,403<br />
2003 12,940 53,290 66,230 697 2,901 3,598<br />
2004 12,270 52,390 64,660 680 2,928 3,608<br />
2005e 13,150 55,750 68,900 750 3,200 3,950<br />
Source: BC Stats & Lead<strong>in</strong>g Edge <strong>British</strong> <strong>Columbia</strong>, “Pr<strong>of</strong>ile <strong>of</strong> <strong>the</strong> <strong>British</strong> <strong>Columbia</strong> High Technology <strong>Sector</strong> - 2005 Edition”,<br />
January 2006.<br />
Notes: 1. See Table F.3 for <strong>in</strong>dustries compris<strong>in</strong>g <strong>the</strong> High Tech sector:<br />
2. “e” denotes estimate.<br />
3. Wages & Salaries do not <strong>in</strong>clude SLI <strong>of</strong> about 15%.<br />
Table F.2: The B.C. High Technology <strong>Sector</strong> - Exports<br />
Exports $ millions<br />
Goods Services All<br />
1997 581<br />
1998 769 1,650 2,419<br />
1999 840 1,640 2,480<br />
2000 823 2,090 3,013<br />
2001 748 1,885 2,633<br />
2002 685 2,063 2,748<br />
2003 629 2,203 2,832<br />
2004 673 2,086 2,759<br />
Source: BC Stats & Lead<strong>in</strong>g Edge <strong>British</strong> <strong>Columbia</strong>, “Pr<strong>of</strong>ile <strong>of</strong> <strong>the</strong> <strong>British</strong> <strong>Columbia</strong> High Technology <strong>Sector</strong> - 2005 Edition”,<br />
January 2006.
<strong>Economic</strong> <strong>Contribution</strong> <strong>of</strong> <strong>the</strong> <strong>Oceans</strong> <strong>Sector</strong> <strong>in</strong> <strong>British</strong> <strong>Columbia</strong> 59<br />
Table F.3: Industries <strong>in</strong> <strong>the</strong> High Technology <strong>Sector</strong><br />
NAICS Industry<br />
Manufactur<strong>in</strong>g<br />
325189 O<strong>the</strong>r Inorganic Chemicals<br />
325410 Pharmaceutical and Medic<strong>in</strong>e<br />
333310 Commercial and Service Industry<br />
334110 Computer and Peripheral<br />
334210 Telephone Apparatus<br />
334220 Radio, Television Broadcast<strong>in</strong>g & Wireless Communications Equipment<br />
334290 O<strong>the</strong>r Communications Equipment<br />
334310 Audio and Video Equipment<br />
334410 Semiconductor and O<strong>the</strong>r Electronic Components<br />
334511 Navigational and Guidance Instruments<br />
334512 Measur<strong>in</strong>g, Medical and Controll<strong>in</strong>g Devices<br />
334610 Manufactur<strong>in</strong>g and Reproduc<strong>in</strong>g Magnetic and Optical Media<br />
335315 Switchgear and Switchboard, and Relay and Industrial Control Apparatus<br />
335920 Communication and Energy Wire and Cable<br />
335990 All O<strong>the</strong>r Electrical Equipment and Component<br />
336410 Aerospace Products and Parts<br />
339110 Medical Equipment and Supplies<br />
Service<br />
511210 S<strong>of</strong>tware Publishers<br />
512110 Motion Picture and Video Production<br />
512190 Post-Production and O<strong>the</strong>r Motion Picture and Video Industries<br />
515210 Pay and Specialty Television<br />
516110 Internet Publish<strong>in</strong>g and Broadcast<strong>in</strong>g<br />
517110 Wired Telecommunications Carriers<br />
517210 Wireless Telecommunications Carriers (Except Satellite)<br />
517310 Telecommunications Resellers<br />
517410 Satellite Telecommunications<br />
517510 Cable and O<strong>the</strong>r Program Distribution<br />
518111 Internet Service Providers<br />
518112 Web Search Portals<br />
518210 Data Process<strong>in</strong>g, Host<strong>in</strong>g and Related<br />
541330 Eng<strong>in</strong>eer<strong>in</strong>g<br />
541360 Geophysical Survey<strong>in</strong>g and Mapp<strong>in</strong>g Services<br />
541370 Survey<strong>in</strong>g and Mapp<strong>in</strong>g (Except Geophysical) Service<br />
541380 Test<strong>in</strong>g Laboratories<br />
541510 Computer Systems Design and Related<br />
541620 Environmental Consult<strong>in</strong>g<br />
541690 O<strong>the</strong>r Scientific and Technical Consult<strong>in</strong>g<br />
541710 Research and Development <strong>in</strong> Physical, Eng<strong>in</strong>eer<strong>in</strong>g and Life Sciences<br />
Source: BC Stats & Lead<strong>in</strong>g Edge <strong>British</strong> <strong>Columbia</strong>, “Pr<strong>of</strong>ile <strong>of</strong> <strong>the</strong> <strong>British</strong> <strong>Columbia</strong> High Technology <strong>Sector</strong> - 2005 Edition”,<br />
January 2006.
60<br />
<strong>Economic</strong> <strong>Contribution</strong> <strong>of</strong> <strong>the</strong> <strong>Oceans</strong> <strong>Sector</strong> <strong>in</strong> <strong>British</strong> <strong>Columbia</strong><br />
Appendix G: Background - Ocean Recreation<br />
Table G.1: B.C. Tidal Waters Sport Fish<strong>in</strong>g Licence Sales and Revenues - Selected<br />
Years<br />
1986/87 1991/92<br />
Fiscal Years<br />
1996/97 2001/02 2005/06<br />
Licence Type<br />
Resident *<br />
Annual 269,498 200,217 130,718 121,958 115,211<br />
5 Day 0 0 6,948 10,170 13,607<br />
3 Day 0 0 14,510 16,654 19,413<br />
1 Day 18,014 41,376 43,604 41,178 32,047<br />
Senior 0 24,080 19,190 19,141 20,183<br />
Juvenile 0 49,198 50,286 49,692 39,403<br />
Subtotal<br />
Non-Resident<br />
287,512 314,871 265,256 258,793 239,864<br />
*<br />
Annual 20,210 16,250 5,485 5,328 5,306<br />
5 Day 3,569 12,564 19,122 22,015 25,834<br />
4 Day 4,333 9,493 0 0 0<br />
3 Day 9,373 14,588 24,331 20,058 18,653<br />
2 Day 8,390 14,180 0 0 0<br />
1 Day 19,673 21,712 32,036 25,656 21,523<br />
Juvenile 0 6,242 6,496 6,017 5,123<br />
Subtotal 65,548 95,029 87,470 79,074 76,439<br />
Total 353,060 409,900 352,726 337,867 316,303<br />
Licence Revenue ** * Resident <strong>of</strong> Canada<br />
** Includes tags/stamps<br />
Source: DFO<br />
$2,164,000 $4,307,000 $6,977,000 $6,621,000 $6,572,000<br />
Table G.2: B.C. Cruise Passenger Counts<br />
Cruise Passengers ‘000<br />
2000 2001 2002 2003 2004 2005<br />
Vancouver 987 1,019 1,125 953 930 910<br />
Victoria 53 118 161 186 265 295<br />
Nanaimo - - - - - 15<br />
Pr<strong>in</strong>ce Rupert - - - - 60 96<br />
Total 1,040 1,137 1,286 1,139 1,255 1,316<br />
Source: Cruise B.C.
<strong>Economic</strong> <strong>Contribution</strong> <strong>of</strong> <strong>the</strong> <strong>Oceans</strong> <strong>Sector</strong> <strong>in</strong> <strong>British</strong> <strong>Columbia</strong> 61<br />
Table G.3: B.C. Ferries F<strong>in</strong>ancial Statements<br />
01/02 02/03 03/04 04/05 05/06<br />
A. Income Statement $ millions<br />
Revenues<br />
Tolls/Activities 378.4 392.3 403.9 433.2 446.1<br />
Prov Subsidy 71.7 74.2 105.8 107.0 108.2<br />
Fed Subsidy 23.0 23.4 24.0 24.3 24.9<br />
Subtotal<br />
Expenses<br />
473.1 489.9 533.7 564.5 579.2<br />
Wages, Salaries, Benefits 241.6 248.1 234.8 235.7 243.2<br />
O<strong>the</strong>r Operat<strong>in</strong>g 165.8 171.7 199.5 216.1 207.8<br />
Subtotal<br />
EBITDA<br />
407.4 419.8 434.3 451.8 451.0<br />
Interest 1.8 1.4 22.7 24.5 25.1<br />
Amortization 46.1 44.1 47.3 47.7 53.1<br />
Earn<strong>in</strong>gs 17.8 24.6 29.4 40.5 50.0<br />
Subtotal 65.7 70.1 99.4 112.7 128.2<br />
B. Capital Purchases $ millions<br />
Ships 25.0 e 25.0 e 25.7 50.1 28.3<br />
Berths, Bldgs etc 29.9 33.2 33.9 69.8 101.4<br />
Subtotal 54.9 58.2 59.6 119.9 129.7<br />
C. Employment FTEs 3,345 3,261 3,375 3,406<br />
Source: B.C. Ferries Annual Reports.<br />
Notes: 1. The provision <strong>of</strong> vehicle and passenger ferry services is exempt under <strong>the</strong> Excise Act for GST purposes.<br />
2. The company entered <strong>in</strong>to an agreement with <strong>the</strong> Prov<strong>in</strong>ce <strong>in</strong> April 2003 to provide, <strong>in</strong> exchange for fees, ferry service on specified routes that<br />
would not normally be commercially viable.<br />
3. The company receives revenue provided by <strong>the</strong> Prov<strong>in</strong>ce from <strong>the</strong> Government <strong>of</strong> Canada pursuant to a contract between federal and<br />
prov<strong>in</strong>cial governments for <strong>the</strong> provision <strong>of</strong> ferry, coastal, freight and passenger services <strong>in</strong> <strong>the</strong> waters <strong>of</strong> <strong>British</strong> <strong>Columbia</strong>.<br />
4. EBITDA – Earn<strong>in</strong>gs Before Interest, Taxes, Depreciation & Amortization.
62<br />
<strong>Economic</strong> <strong>Contribution</strong> <strong>of</strong> <strong>the</strong> <strong>Oceans</strong> <strong>Sector</strong> <strong>in</strong> <strong>British</strong> <strong>Columbia</strong><br />
Table G.4: B.C. and Canadian Tourist Expenditures<br />
<strong>British</strong> <strong>Columbia</strong> Canada<br />
Expenditures<br />
GDP Employment Expenditures GDP Employment<br />
$ millions<br />
$ millions<br />
PYs<br />
$ millions $ millions<br />
PYs<br />
Same Day Overnight Total<br />
1997 4,700 111,700 42,882 17,997 520,600<br />
1998 4,854 112,400 45,887 19,462 537,500<br />
1999 5,040 111,200 49,000 20,956 588,400<br />
2000 5,280 112,200 53,750 22,406 609,900<br />
2001 2,858 9,242 12,100 5,430 114,700 53,856 22,460 608,500<br />
2002 3,064 9,336 12,400 5,559 115,200 55,975 23,409 610,700<br />
2003 3,347 8,953 12,300 5,528 116,700 54,834 22,890 610,200<br />
2004 3,627 9,473 13,100 5,909 117,300 58,510 24,350 615,700<br />
2005e 4,014 9,786 13,800 6,203 119,900 62,741 26,046 625,800<br />
Source: B.C. - BC Stats (for GDP and Employment)<br />
- Tourism B.C. - overnight visitor spend<strong>in</strong>g (total tourism spend<strong>in</strong>g - same day plus overnight - estimates based on GDP be<strong>in</strong>g 45% <strong>of</strong> <strong>the</strong> total)<br />
Canada - Canadian Tourism Commission<br />
Notes: 1. A tourist is def<strong>in</strong>ed as one who travels more than 80km (50 miles) from <strong>the</strong>ir normal place <strong>of</strong> residence.<br />
2. Canadian figures <strong>in</strong>clude same day and overnight tourists<br />
3. Spend<strong>in</strong>g figures <strong>in</strong>clude po<strong>in</strong>t <strong>of</strong> sales taxes such as GST, PST, hotel tax, liquor & cigarette taxes etc.<br />
4. PYs is person-years.<br />
5. BC Stats estimates tourism GDP and Employment <strong>in</strong>dependent <strong>of</strong> <strong>the</strong> Tourism B.C. estimates <strong>of</strong> tourism expenditures i.e., <strong>the</strong> figures may not be<br />
consistent e.g., Tourism B.C. expenditures refer to overnight visitors only whereas BC Stats GDP refers to both overnight and same day visitors.
<strong>Economic</strong> <strong>Contribution</strong> <strong>of</strong> <strong>the</strong> <strong>Oceans</strong> <strong>Sector</strong> <strong>in</strong> <strong>British</strong> <strong>Columbia</strong> 63<br />
Table G.5: Ocean Recreation/Leisure Expenditures <strong>in</strong> B.C.<br />
$ millions<br />
Mar<strong>in</strong>e Leisure Category 2002 2003 2004 2005<br />
Mar<strong>in</strong>e Tourism<br />
Angl<strong>in</strong>g 330 335 340 350<br />
Cruise 270 270 270 270<br />
Ferries 392 404 433 446<br />
O<strong>the</strong>r 1,711 1,693 1,807 1,908<br />
Subtotal 2,703 2,702 2,850 2,974<br />
Mar<strong>in</strong>e Leisure by Non-Tourists<br />
Angl<strong>in</strong>g 220 245 270 292<br />
Cruise 0 0 0 0<br />
Ferries 0 0 0 0<br />
O<strong>the</strong>r 428 450 490 525<br />
Subtotal 648 695 760 817<br />
Mar<strong>in</strong>e Recreation/Leisure<br />
Angl<strong>in</strong>g 550 580 610 642<br />
Cruise 270 270 270 270<br />
Ferries 392 404 433 446<br />
O<strong>the</strong>r 2,139 2,143 2,297 2,433<br />
Subtotal 3,351 3,397 3,610 3,791<br />
Source: GSGislason & Associates Ltd. estimates.<br />
Notes: 1. Angl<strong>in</strong>g - $550 million <strong>in</strong> 2002 GSGislason & Associates Ltd., “SWOT Study”, 2004.<br />
- assumed 100% <strong>of</strong> expenditures <strong>of</strong> out-<strong>of</strong>-prov<strong>in</strong>ce anglers was tourist spend<strong>in</strong>g/1/3 <strong>of</strong> expenditures by <strong>in</strong>-prov<strong>in</strong>ce anglers was tourist spend<strong>in</strong>g.<br />
2. Cruise - BREA (2004) estimated $270 million <strong>in</strong> crew spend<strong>in</strong>g plus passenger spend<strong>in</strong>g.<br />
- cruise l<strong>in</strong>e expenditures on goods & services comprise part <strong>of</strong> Ports & Shipp<strong>in</strong>g sector.<br />
- little change <strong>in</strong> cruise passenger levels coastwide over period<br />
- assume all cruise passengers are tourists.<br />
3. Ferries - expenditures on ferries from B.C. Ferries Annual Reports re Tolls/O<strong>the</strong>r activity revenues<br />
- allocated 100% to tourist component<br />
4. O<strong>the</strong>r - expenditures on boat<strong>in</strong>g, sail<strong>in</strong>g, whalewatch<strong>in</strong>g, scuba div<strong>in</strong>g, beach/shore activities.<br />
- mar<strong>in</strong>e tourist amount assumed to be 15% <strong>of</strong> B.C. tourist expenditures o<strong>the</strong>r than angl<strong>in</strong>g, cruis<strong>in</strong>g, and ferry trips (Tablet G.1).<br />
- non-tourist amount assumed to be 25% <strong>of</strong> tourist amount <strong>in</strong> 2002, a conservative assumption (and <strong>the</strong>n escalated by annual growth <strong>in</strong> prov<strong>in</strong>cial<br />
GDP <strong>the</strong>reafter).
64<br />
<strong>Economic</strong> <strong>Contribution</strong> <strong>of</strong> <strong>the</strong> <strong>Oceans</strong> <strong>Sector</strong> <strong>in</strong> <strong>British</strong> <strong>Columbia</strong><br />
Table G.6: Ocean Recreation Activities by California Residents 2000<br />
millions<br />
No. <strong>of</strong> Participants No. <strong>of</strong> Days<br />
Mar<strong>in</strong>e Recreation Activity<br />
1. Beach-Related<br />
visit beaches 12.6 151<br />
swimm<strong>in</strong>g 8.4 95<br />
scuba div<strong>in</strong>g 0.3 1<br />
surf<strong>in</strong>g 1.1 23<br />
w<strong>in</strong>d surf<strong>in</strong>g 0.1 1e snorkel<strong>in</strong>g 0.7 4<br />
Subtotal<br />
2. Recreational Fish<strong>in</strong>g/Boat<strong>in</strong>g<br />
23.2 275<br />
recreational fish<strong>in</strong>g 2.7 20<br />
motor boat<strong>in</strong>g 1.5 12<br />
sail<strong>in</strong>g 1.1 7<br />
personal watercraft 0.7 3<br />
canoe<strong>in</strong>g 0.2 1e kayak<strong>in</strong>g 0.4 2e row<strong>in</strong>g 0.3 2e Subtotal<br />
3. O<strong>the</strong>r<br />
6.9 47<br />
visit waterside beside beaches 1.5 21<br />
bird watch<strong>in</strong>g around saltwater 2.6 66<br />
view<strong>in</strong>g/photography around saltwater 4.2 50e hunt<strong>in</strong>g waterfowl around saltwater 0.1 1e o<strong>the</strong>r 0.7 4<br />
Subtotal 9.1 142<br />
Total 39.2 464<br />
Source: Judith Kildow and Charles S. Colgan, “California’s Ocean Economy”, NOEP, July 2005.<br />
Notes: 1. Number <strong>of</strong> participants are not unique - one person may participate <strong>in</strong> more than one activity.<br />
2. “e” means estimate.<br />
3. In 2000 California had a population <strong>of</strong> 33.9 million - 26.2 million <strong>in</strong> coastal areas plus 7.7 million <strong>in</strong> o<strong>the</strong>r areas (about 75% <strong>of</strong> <strong>the</strong> <strong>British</strong> <strong>Columbia</strong><br />
population <strong>of</strong> 4 million lives <strong>in</strong> coastal areas).
<strong>Economic</strong> <strong>Contribution</strong> <strong>of</strong> <strong>the</strong> <strong>Oceans</strong> <strong>Sector</strong> <strong>in</strong> <strong>British</strong> <strong>Columbia</strong> 65<br />
Appendix h: Background – Ocean Transport<br />
Table H.1: Traffic Handled at B.C. Ports - Domestic & International *<br />
2000 2001<br />
Millions <strong>of</strong> Tonnes<br />
2002 2003 2004<br />
Port Authorities<br />
Vancouver 75.3 72.0 63.2 68.0 75.0<br />
Fraser River 11.0 11.5 12.5 13.7 14.9<br />
North Fraser 4.1 4.7 5.2 4.7 4.6<br />
Pr<strong>in</strong>ce Rupert 7.2 4.7 4.4 4.0 4.4<br />
Nanaimo 1.9 2.2 2.3 2.1 2.2<br />
Port Alberni 0.9 0.3 0.5 0.7 0.7<br />
Subtotal 100.4 95.4 88.1 93.2 101.8<br />
O<strong>the</strong>r Ports<br />
Howe Sound 6.5 5.8 6.8 6.7 6.2<br />
East Coast Vancouver Island 3.9 3.3 3.6 4.0 4.1<br />
Beale Cove 1.3 0.2 0.3 0.7 2.8<br />
Cr<strong>of</strong>ton 2.9 2.6 2.7 2.8 2.6<br />
Kitimat 2.1 1.7 1.7 1.6 1.8<br />
Campbell River 1.4 1.3 1.2 1.4 1.3<br />
Jervis Inlet 1.0 1.1 0.8 0.8 1.0<br />
O<strong>the</strong>rs (60 locations) 9.3 7.0 7.7 7.2 6.1<br />
Subtotal 28.4 23.0 24.8 25.2 25.9<br />
All Ports 128.8 118.4 112.9 118.4 127.7<br />
* Excludes traffic pass<strong>in</strong>g through ports that is not loaded or unloaded.<br />
Source: Transport Canada<br />
Table H.2: Port Authority Revenues <strong>in</strong> B.C.<br />
$ millions<br />
2000 2001 2002 2003 2004 2005<br />
Port Authorities<br />
Vancouver 86.4 92.1 96.0 102.9 100.9 98.7<br />
Fraser River 14.5 13.4 16.1 19.1 17.0 18.0 *<br />
North Fraser 2.7 2.6 2.7 2.6 2.6 2.4<br />
Pr<strong>in</strong>ce Rupert 6.4 5.5 4.8 3.9 4.8 5.5<br />
Nanaimo 5.8 5.5 4.9 5.0 6.3 6.7<br />
Port Alberni 2.6 2.6 2.8 2.8 3.0 2.9<br />
Subtotal 118.4 121.7 127.3 136.3 134.6 134.2<br />
* Estimate (Apr/06 year-end f<strong>in</strong>ancials for Fraser River Port Authority will not be released until June/07).<br />
Source: Transport Canada “Transportation <strong>in</strong> Canada - Annual Report” (based on Port Authorities F<strong>in</strong>ancial Statements) plus Port Authority F<strong>in</strong>ancial<br />
Statements for 2005.
66<br />
<strong>Economic</strong> <strong>Contribution</strong> <strong>of</strong> <strong>the</strong> <strong>Oceans</strong> <strong>Sector</strong> <strong>in</strong> <strong>British</strong> <strong>Columbia</strong><br />
Table H.3: Selected Mar<strong>in</strong>e Transport Employment Statistics<br />
Employees<br />
B.C. Maritime Employer’s Association<br />
Labour Costs<br />
$ millions<br />
Hours Worked<br />
‘000<br />
1997 3,919 194.8 4,669<br />
1998 3,604 187.7 4,326<br />
1999 3,576 205.1 4,579<br />
2000 3,656 227.1 4,956<br />
2001 3,548 213.7 4,523<br />
2002 3,727 226.1 4,599<br />
2003 3,647 253.0 4,918<br />
2004 3,928 279.1 5,230<br />
2005 4,312 303.1 5,547<br />
Source: Transport Canada, “Transportation <strong>in</strong> Canada - Annual Report”, Annual.<br />
Table H.4: Port <strong>of</strong> Vancouver Direct <strong>Economic</strong> Impacts for B.C. 2004 - InterVISTAS<br />
A. Port Traffic 2004<br />
Cargo - Bulk 57.7 million tonnes<br />
- Bulk Break 3.3 “<br />
- Conta<strong>in</strong>er 14.1 “<br />
Total 75.1 million tonnes<br />
Cargo Value $43 billion<br />
Cruise Passengers 930,000<br />
B. direct Impact 2004<br />
$ millions person-years<br />
Output GDP Wages Employment<br />
Port-Related<br />
Maritime Cargo 2,254 1,021 834 14,185<br />
Cruise Industry 566 234 181 3,855<br />
Capital Investment 162 67 61 1,410<br />
Ship Build<strong>in</strong>g & Repair 80 41 39 725<br />
Non-Maritime 67 23 18 745<br />
Total 3,129 1,386 1,133 20,920<br />
Source: InterVISTAS Consult<strong>in</strong>g Inc., “Port <strong>of</strong> Vancouver <strong>Economic</strong> Impact Update”, Prepared for Vancouver Port Authority, May 2005.<br />
Notes: 1. Maritime Cargo - impacts result<strong>in</strong>g from process<strong>in</strong>g & handl<strong>in</strong>g <strong>of</strong> bulk, break bulk and conta<strong>in</strong>ed goods at <strong>the</strong> Port (plus <strong>of</strong>f-Port activity <strong>of</strong><br />
shipp<strong>in</strong>g agents, <strong>in</strong>surance brokers, warehouse operators, exporters/importers etc plus a portion <strong>of</strong> <strong>the</strong> rail & truck<strong>in</strong>g logistics system).<br />
2. Cruise <strong>in</strong>dustry - impacts from Int’l Cruise Industry expenditures by cruise l<strong>in</strong>es for supplies, fuel etc. as well as crew spend<strong>in</strong>g and cruise passenger<br />
spend<strong>in</strong>g.<br />
3. Capital <strong>in</strong>vestment - impacts result<strong>in</strong>g from capital spend<strong>in</strong>g - by <strong>the</strong> Vancouver Port Authority (VPA) and its tenants<br />
4. Ship Build<strong>in</strong>g & Repair - activity generated by Port-related shipbuild<strong>in</strong>g and repair activity.<br />
5. Non-maritime activity - impacts from bus<strong>in</strong>esses located on VPA land but <strong>in</strong>volved <strong>in</strong> activities not directly related to cargo, cruise or ship build<strong>in</strong>g<br />
& repair (<strong>in</strong>clud<strong>in</strong>g restaurants, mar<strong>in</strong>as, fish<strong>in</strong>g, fish process<strong>in</strong>g and o<strong>the</strong>r non-mar<strong>in</strong>e enterprises).
<strong>Economic</strong> <strong>Contribution</strong> <strong>of</strong> <strong>the</strong> <strong>Oceans</strong> <strong>Sector</strong> <strong>in</strong> <strong>British</strong> <strong>Columbia</strong> 67<br />
Table H.5: Port <strong>of</strong> Vancouver Employment Impacts 2000 - InterVISTAS<br />
A. direct Employment by Port Activity 2000<br />
B.C.<br />
person-years<br />
Western Canada Total<br />
Port Activity<br />
Maritime Cargo 13,270 5,210 18,480<br />
Cruise Industry 2,970 1,540 4,510<br />
Capital Investment 1,326 0 1,326<br />
Ship Build<strong>in</strong>g & Repair 726 0 726<br />
Non-Maritime 684 0 684<br />
Total 18,976 6,750 25,726<br />
B. direct Maritime Cargo Employment by Industry 2000<br />
person-years person-years<br />
1. Association/Union 2,049 16. O<strong>the</strong>r 103<br />
2. Break Bulk Term<strong>in</strong>al Operator 138 17. Rail 7,493<br />
3. Bulk Term<strong>in</strong>al Operator 1,702 18. Retail Fuel Sales/Bunkers 48<br />
4. Construction/Dredg<strong>in</strong>g 118 19. Security 70<br />
5. Consult<strong>in</strong>g Eng<strong>in</strong>eers 54 20. Ship Broker 86<br />
6. Conta<strong>in</strong>er Stations 129 21. Ship Chandler 215<br />
7. Conta<strong>in</strong>er Lease & Repair/Off-Dock 112 22. Ship Pilot 49<br />
8. Conta<strong>in</strong>er Term<strong>in</strong>al Operator 471 23. Shipp<strong>in</strong>g Agent 639<br />
9. Customs Broker 34 24. Shipp<strong>in</strong>g L<strong>in</strong>e Operator 71<br />
10. Exporter/Importer 1,026 25. Truck<strong>in</strong>g 1,433<br />
11. Freight Forwarder 298 26. Tug/Tow/Barge 1,011<br />
12. Government Agency 248 27. Vancouver Port Authority 198<br />
13. Maritime Law 29 28. Warehouse Operator 232<br />
14. Mar<strong>in</strong>e Insurance Broker 204 29. Waste Disposal/Ship Clean<strong>in</strong>g 32<br />
15. Mar<strong>in</strong>e/Cargo Surveyor 117 30. Water Taxi 71<br />
18,480<br />
Source: InterVISTAS Consult<strong>in</strong>g Inc., “Port <strong>of</strong> Vancouver <strong>Economic</strong> Impact Study”, August 2001.
68<br />
<strong>Economic</strong> <strong>Contribution</strong> <strong>of</strong> <strong>the</strong> <strong>Oceans</strong> <strong>Sector</strong> <strong>in</strong> <strong>British</strong> <strong>Columbia</strong><br />
Appendix I: Background - federal Government<br />
Table I.1: Fisheries and <strong>Oceans</strong> Canada Ocean-Related Expenditures <strong>in</strong> B.C.<br />
2002/03 2003/04 2004/05 2005/06<br />
Budget/Expenditures $ millions<br />
Wages, Salaries, Benefits 156.2 155.7 162.5 162.1<br />
O<strong>the</strong>r 103.7 82.3 94.3 95.4<br />
Total 259.9 238.0 256.8 257.5<br />
Employment FTEs<br />
Source: DFO Vancouver<br />
2,340 2,324 2,174 2,160<br />
Notes: 1. Figures represent 90 to 95% <strong>of</strong> total Pacific Region budget – budgets from area <strong>of</strong>fices <strong>in</strong> Whitehorse (Yukon) and Kamloops (Interior B.C.) are<br />
excluded. And only 50% <strong>of</strong> Salmon Enhancement Program (SEP) budget is <strong>in</strong>cluded. Figures <strong>in</strong>clude operations <strong>of</strong> Coast Guard, Pacific Biological<br />
Stations (PBS), Institute for Ocean Sciences (IOS) and West Vancouver Laboratory.<br />
2. Figures do not <strong>in</strong>clude capital expenditures.<br />
3. Assumed Supplementary Labour Income or Benefits were 20% <strong>of</strong> Wages & Salaries.<br />
Table I.2: Department <strong>of</strong> National Defence Ocean-Related Expenditures <strong>in</strong> B.C.<br />
2002/03 2003/04 2004/05 2005/06<br />
Budget/Expenditures $ millions<br />
Wages, Salaries, Benefits 330 334 338 343<br />
O<strong>the</strong>r 54 54 78 84<br />
Total 384 388 416 427<br />
Employment FTEs 3,960 3,960 3,945 3,940<br />
Source: CFB Esquimalt<br />
Notes: 1. Figures represent 65-70% <strong>of</strong> total Pacific Maritime Command budget (CFB Esquimalt provides services to o<strong>the</strong>r sectors <strong>of</strong> <strong>the</strong> Armed Forces e.g., CFB<br />
Comox).<br />
2. Figures do not <strong>in</strong>clude capital expenditures.<br />
3. Major activities <strong>in</strong>clude: Search & Rescue, Sovereignty Patrols, Maritime Security Operations Centre, Exercis<strong>in</strong>g Navy Capabilities, Eng<strong>in</strong>eer<strong>in</strong>g &<br />
Ma<strong>in</strong>tenance <strong>of</strong> Navy Ships, and Acoustic Data Analysis.<br />
4. Assumed Supplementary Labour Income or Benefits were 20% <strong>of</strong> Wages and Salaries.<br />
Table I.3: Environment Canada Ocean-Related Expenditures <strong>in</strong> B.C.<br />
2002/03 2003/04 2004/05 2005/06<br />
Expenditures $ millions<br />
Wages, Salaries, Benefits 1.6 2.0 1.9 2.0<br />
O<strong>the</strong>r 4.4 4.5 4.5 4.1<br />
Total 6.0 6.5 6.4 6.1<br />
Employment FTEs<br />
Source: Environment Canada, Vancouver<br />
24 26 22 26<br />
Notes: 1. Covers oceans-related activities and programs with<strong>in</strong>: Meteorological Services <strong>of</strong> Canada (MSC), Canadian Wildlife Services (CWS), Environmental<br />
Protection Service (EP), and Canadian Environment Assessment Act (CEAA) activities.<br />
2. Assumed Supplementary Labour Income or Benefits were 20% <strong>of</strong> Wages & Salaries.<br />
3. Does not <strong>in</strong>clude Parks Canada activities (which are considered separately).
<strong>Economic</strong> <strong>Contribution</strong> <strong>of</strong> <strong>the</strong> <strong>Oceans</strong> <strong>Sector</strong> <strong>in</strong> <strong>British</strong> <strong>Columbia</strong> 69<br />
Table I.4: Parks Canada Budget re <strong>Oceans</strong> <strong>Sector</strong><br />
2002/03 2003/04 2004/05 2005/06<br />
Facility<br />
Gulf Islands National Park Reserve 1.4 2.4 3.2 3.7<br />
Pacific Rim National Park NA NA NA 5.0<br />
Haida Gwaii National Park NA NA NA 3.7<br />
Service Centre NA NA NA 1.0<br />
Total<br />
Source: Parks Canada, Victoria<br />
Notes: 1. The three National Parks are located on <strong>the</strong> ocean.<br />
11.0 12.0 13.0 13.4<br />
2. The Western & Nor<strong>the</strong>rn Canada Service Centre supports <strong>the</strong> three mar<strong>in</strong>e parks.<br />
3. Parks Canada facilities help visitors to enjoy healthy mar<strong>in</strong>e resources and activities along <strong>the</strong> Pacific Coast e.g., boat<strong>in</strong>g, swimm<strong>in</strong>g, surf<strong>in</strong>g, beach<br />
walk<strong>in</strong>g, sea<br />
view<strong>in</strong>g/sightsee<strong>in</strong>g, research.<br />
4. Totals for 2002/03 through 2004/05 are estimates.<br />
Table I.5: B.C. Employment Insurance Fish<strong>in</strong>g Claims<br />
B.C. EI Fish<strong>in</strong>g Claims<br />
Calendar Year No. <strong>of</strong> Claims Amount Paid $ millions<br />
1997 5,343 28.1<br />
1998 4,168 38.2<br />
1999 3,805 32.1<br />
2000 3,670 28.9<br />
2001 4,029 33.6<br />
2002 4,170 36.1<br />
2003 4,195 37.1<br />
2004 4,098 35.6<br />
2005 3,376 33.3<br />
2006 3,883 28.8<br />
Source: HRDC and Service Canada<br />
Note: 1. Today <strong>the</strong> Department spends less than $0.5 million on mar<strong>in</strong>e-related activities <strong>in</strong> B.C. (but <strong>in</strong> <strong>the</strong> 1998-2001 period <strong>the</strong> Department spent significant<br />
monies on <strong>the</strong> Pacific Fisheries Restructur<strong>in</strong>g and Adjustment Program).<br />
Table I.6: Transport Canada Ocean-Related Expenditures <strong>in</strong> B.C.<br />
2002/03 2003/04 2004/05 2005/06<br />
Expenditures $ millions<br />
Ports & Harbours 2.3 2.4 2.9 1.9<br />
B.C. Ferries Subsidy 23.4 24.0 24.3 24.9<br />
Port Fund<strong>in</strong>g/Grants 2.0 2.0 11.0 2.0<br />
Total 27.7 28.4 38.2 28.8<br />
Source: Transport Canada, “Transportation <strong>in</strong> Canada – Annual Report”.<br />
Notes: 1. 10% <strong>of</strong> Canada-wide expenditures on Ports & Harbours have been allocated to B.C. (Transport Canada Pacific Region could not produce B.C.<br />
<strong>in</strong>formation for this item).<br />
2. Grants to ports estimated (but 2004/05 <strong>in</strong>cludes $9 million Transport Canada grant to Ridley Term<strong>in</strong>al <strong>in</strong> Pr<strong>in</strong>ce Rupert).
70<br />
<strong>Economic</strong> <strong>Contribution</strong> <strong>of</strong> <strong>the</strong> <strong>Oceans</strong> <strong>Sector</strong> <strong>in</strong> <strong>British</strong> <strong>Columbia</strong><br />
Table I.7: Western <strong>Economic</strong> Diversification Investments <strong>in</strong> <strong>the</strong> <strong>Oceans</strong> Area <strong>in</strong> B.C.<br />
2002/03 2003/04 2004/05 2005/06<br />
Expenditures $ millions<br />
Projects 1.8 3.5 3.0 34.8<br />
Source: Western <strong>Economic</strong> Diversification (WD), Vancouver<br />
Notes: 1. Notable projects/activities/<strong>in</strong>vestments <strong>in</strong>clude: Western Canadian Universities Mar<strong>in</strong>e Sciences Society, Pr<strong>in</strong>ce Rupert Cruise Ship term<strong>in</strong>al,<br />
establishment <strong>of</strong> B.C. Centre for Aquatic Health Sciences, Campbell River Cruise Ship term<strong>in</strong>al, and Vancouver Mar<strong>in</strong>e Science Centre.<br />
2. Contributed $30 million <strong>in</strong> 2005/06 to Pr<strong>in</strong>ce Rupert Conta<strong>in</strong>er Term<strong>in</strong>al Development.<br />
3. Figures do not <strong>in</strong>clude WD staff salaries.<br />
Table I.8: NRCan Ocean-Related Expenditures <strong>in</strong> B.C.<br />
2002/03 2003/04 2004/05 2005/06<br />
Expenditures $ millions<br />
Wages, Salaries, Benefits 0.8 0.9 1.1 1.3<br />
O<strong>the</strong>r 0.5 0.5 0.6 0.6<br />
Total 1.3 1.4 1.7 1.9<br />
Employment FTEs<br />
Source: NRCan, Sidney<br />
8 9 11 13<br />
Note: 1. “o<strong>the</strong>r” <strong>in</strong>cludes about $125,000 per year payments to DFO for Canadian Coast Guard services plus about $60,000 per year payments to DFO for<br />
NRCan share <strong>of</strong> heat, utilities at <strong>the</strong> Institute for Ocean Sciences (IOS) <strong>of</strong>fice complex - DFO is <strong>the</strong> landlord.<br />
Table I.9: Canadian Food Inspection Agency Seafood-Related Expenditures <strong>in</strong> B.C.<br />
2002/03 2003/04 2004/05 2005/06<br />
Expenditures $ millions<br />
Wages, Salaries, Benefits 2.1 2.2 2.6 2.9<br />
O<strong>the</strong>r 0.3 0.3 0.4 0.3<br />
Total 2.4 2.5 3.0 3.2<br />
Employment FTEs 34 34 37 39<br />
Source: CFIA, Vancouver<br />
Notes: 1. The Canadian Food Inspection Agency (CFIA) is an arm <strong>of</strong> <strong>the</strong> federal department <strong>of</strong> Agriculture & Agri-Food Canada (AAFC).<br />
2. The figures are <strong>the</strong> sum <strong>of</strong> estimates for two regions - B.C. Ma<strong>in</strong>land/Interior and B.C. Coastal.<br />
3. Assumed Supplementary Labour Income or Benefits were 20% <strong>of</strong> Wages & Salaries.<br />
Table I.10: Federal NSERC and SSHRC Grants & Scholarships to B.C. Universities and<br />
Colleges 2005/06<br />
$ millions<br />
NSERC SCHRC Total<br />
B.C.I.T. 0.2 - 0.2<br />
U.B.C. 51.3 38.0 89.3<br />
Malasp<strong>in</strong>a 0.1 0.2 0.3<br />
Simon Fraser 15.6 14.8 30.4<br />
UVic 14.6 10.9 25.5<br />
81.8 63.9 145.7<br />
Source: National Science and Eng<strong>in</strong>eer<strong>in</strong>g Research Council <strong>of</strong> Canada (NSERC).<br />
Social Sciences and Humanities Research Council <strong>of</strong> Canada (SSHRC).<br />
Notes: 1. The above expenditures refer to all discipl<strong>in</strong>es, ocean-related and non ocean-related.<br />
2. We estimate that 5% <strong>of</strong> NSERC expenditures and 1% <strong>of</strong> SSHRC expenditures are ocean-related.
<strong>Economic</strong> <strong>Contribution</strong> <strong>of</strong> <strong>the</strong> <strong>Oceans</strong> <strong>Sector</strong> <strong>in</strong> <strong>British</strong> <strong>Columbia</strong> 71<br />
Appendix J: Background - Prov<strong>in</strong>cial Government<br />
Table J.1: B.C. M<strong>in</strong>istry <strong>of</strong> Environment Ocean-Related Expenditures<br />
2002/03 2003/04 2004/05 2005/06<br />
Expenditures $ millions<br />
Wages, Salaries, Benefits 1.2 1.4 1.2 2.3<br />
O<strong>the</strong>r 1.0 1.2 1.1 2.3<br />
Total 2.2 2.6 2.3 4.6<br />
Employment FTEs<br />
Source: B.C. M<strong>in</strong>istry <strong>of</strong> Environment, Victoria.<br />
17 19 16 30<br />
Notes: 1. In 2005/06, a new <strong>Oceans</strong> & Mar<strong>in</strong>e Fisheries Division was created <strong>in</strong> <strong>the</strong> M<strong>in</strong>istry <strong>of</strong> Environment. Several staff were transferred from <strong>the</strong> former B.C.<br />
M<strong>in</strong>istry <strong>of</strong> Agriculture, Fisheries & Food to <strong>the</strong> new Division.<br />
2. Assumed Supplementary Labour Income or Benefits were 20% <strong>of</strong> Wages & Salaries.<br />
3. Current activities <strong>in</strong>clude: oceans and mar<strong>in</strong>e fisheries management, seafood market<strong>in</strong>g and development, aquaculture waste regulation, emergency<br />
preparedness for mar<strong>in</strong>e oil spills, coastal environmental report<strong>in</strong>g, and prov<strong>in</strong>cial mar<strong>in</strong>e protected areas management.<br />
Table J.2: B.C. M<strong>in</strong>istry <strong>of</strong> Agriculture & Lands Ocean-Related Expenditures<br />
2002/03 2003/04 2004/05 2005/06<br />
Expenditures $ millions<br />
Wages, Salaries, Benefits 5.8 5.5 6.3 5.9<br />
O<strong>the</strong>r 1.9 2.6 1.5 4.7<br />
Total 7.7 8.1 7.8 10.6<br />
Employment FTEs 79 82 83 72<br />
Source: B.C. M<strong>in</strong>istry <strong>of</strong> Agriculture & Lands, Victoria.<br />
Notes: 1. In 2005/06, <strong>the</strong> M<strong>in</strong>istry <strong>of</strong> Agriculture, Food & Fisheries was dissolved and <strong>the</strong> majority <strong>of</strong> its staff were transferred to <strong>the</strong> new M<strong>in</strong>istry <strong>of</strong> Agriculture &<br />
Lands. Some staff went to <strong>the</strong> new <strong>Oceans</strong> & Mar<strong>in</strong>e Fisheries Division with<strong>in</strong> <strong>the</strong> M<strong>in</strong>istry <strong>of</strong> Environment.<br />
2. Includes <strong>the</strong> Integrated Land Management Bureau (ILMB) and <strong>the</strong> Aquaculture Development Section (Prior to 2005/06, <strong>the</strong> ILMB function rested with<br />
<strong>the</strong> M<strong>in</strong>istry <strong>of</strong> Susta<strong>in</strong>able Resource Management or MSRM – <strong>the</strong> figures <strong>in</strong>clude estimates for <strong>the</strong> MSRM function prior to 2005/06).<br />
3. Assumed supplementary Labour Income or Benefits were 20% <strong>of</strong> Wages & Salaries.<br />
4. Current activities <strong>in</strong>clude: aquaculture licens<strong>in</strong>g, compliance reviews, and site <strong>in</strong>spections; and mar<strong>in</strong>e and coastal zone plann<strong>in</strong>g.<br />
Table J.3: B.C. M<strong>in</strong>istry <strong>of</strong> Energy, M<strong>in</strong>es & Petroleum Resources Ocean-Related<br />
Expenditures<br />
2002/03 2003/04 2004/05 2005/06<br />
Expenditures $ millions<br />
Wages, Salaries, Benefits 0.5 1.1 1.2 1.2<br />
O<strong>the</strong>r 0.5 3.2 1.7 1.9<br />
Total 1.0 4.3 2.9 3.1<br />
Employment FTEs 5 12 12 12<br />
Source: B.C. M<strong>in</strong>istry <strong>of</strong> Energy, M<strong>in</strong>es & Petroleum Resources, Victoria.<br />
Notes: 1. Assumed supplementary Labour Income or Benefits were 20% <strong>of</strong> Wages & Salaries.<br />
2. Major activities <strong>in</strong>clude community and First Nations consultations, research studies, and regulatory regime development for <strong>of</strong>fshore oil and gas;<br />
and fund<strong>in</strong>g and policy development for ocean energy.
72<br />
<strong>Economic</strong> <strong>Contribution</strong> <strong>of</strong> <strong>the</strong> <strong>Oceans</strong> <strong>Sector</strong> <strong>in</strong> <strong>British</strong> <strong>Columbia</strong><br />
Table J.4: B.C. M<strong>in</strong>istry <strong>of</strong> Transportation Ocean-Related Expenditures<br />
2002/03 2003/04 2004/05 2005/06<br />
Expenditures $ millions<br />
Wages, Salaries, Benefits 0.1 0.1 0.1 0.1<br />
Subsidy to Coastal Ferries 74.2 105.8 107.0 108.2<br />
Total 74.3 105.9 107.1 108.3<br />
Employment FTEs 1 1 1 1<br />
Source: B.C. M<strong>in</strong>istry <strong>of</strong> Transportation, Victoria.<br />
B.C. Ferries Annual Reports.<br />
Notes: 1. Prior to 2003/04, B.C. Ferries received a motor fuel tax subsidy. Start<strong>in</strong>g <strong>in</strong> 2003/04, <strong>the</strong> motor fuel tax subsidy was elim<strong>in</strong>ated. Thereafter, <strong>the</strong><br />
company, <strong>in</strong> exchange for a fee, agreed to provide ferry service levels on specified routes and to adm<strong>in</strong>ister certa<strong>in</strong> policy <strong>in</strong>itiatives on behalf<br />
<strong>of</strong> <strong>the</strong> Prov<strong>in</strong>ce.<br />
2. Expenditures do not <strong>in</strong>clude <strong>the</strong> federal ferry subsidy, which is paid to <strong>the</strong> Prov<strong>in</strong>ce and <strong>the</strong>n passed on to B.C. Ferries.<br />
3. Major activity is <strong>the</strong> oversight <strong>of</strong> <strong>the</strong> coastal ferry services contract with B.C. Ferries.
<strong>Economic</strong> <strong>Contribution</strong> <strong>of</strong> <strong>the</strong> <strong>Oceans</strong> <strong>Sector</strong> <strong>in</strong> <strong>British</strong> <strong>Columbia</strong> 73<br />
Appendix K: Background - Potential Offshore Oil & Gas<br />
Table K.1: Illustrative Cost Pr<strong>of</strong>ile for a 500 Million Barrel Offshore Oil Field <strong>in</strong><br />
Queen Charlotte Bas<strong>in</strong> B.C.<br />
Year<br />
Production<br />
Mbbls<br />
Costs $ million US constant 2006<br />
Exploration Development Operat<strong>in</strong>g Transportation<br />
1 100<br />
2 100<br />
3 100<br />
4 100<br />
5 5<br />
6 11<br />
7 21<br />
8 32<br />
9 278 5<br />
10 557 16<br />
11 16.1 820 63 24<br />
12 62.1 131 213 93<br />
13 62.1 100 213 93<br />
14 62.1 205 213 93<br />
15 62.1 89 213 93<br />
16 53.5 110 200 80<br />
17 42.8 95 184 64<br />
18 34.3 58 171 51<br />
19 27.8 162 42<br />
20 22.5 154 34<br />
21 18.2 147 27<br />
22 15.0 142 22<br />
23 11.8 138 18<br />
24 9.6 134 14<br />
Total 500 400 2,511 2,370 750<br />
Source: Taken directly from Wade Locke <strong>Economic</strong> Consult<strong>in</strong>g et al, “<strong>Economic</strong> Overview <strong>of</strong> Oil and Gas Reserves Found <strong>in</strong> <strong>the</strong> Queen Charlotte Bas<strong>in</strong>”, April 2006<br />
Appendix B p.52.<br />
Notes: 1. The <strong>in</strong>formation <strong>in</strong> develop<strong>in</strong>g <strong>the</strong> semi-submersible cost scenario was based on <strong>in</strong>formation submitted by Petro-Canada as part <strong>of</strong> its development<br />
plan application for <strong>the</strong> Terra Nova project <strong>in</strong> Newfoundland and Labrador. The f<strong>in</strong>ancial data was updated to 2006 prices and exchange rates.<br />
2. Operat<strong>in</strong>g costs - $120 US million/yr plus $1.50 US/bbl; Transportation costs - $1.50 US/bbl<br />
3. Price adjustment - B.C. oil priced at 5% discount to world (West Texas crude) oil prices.
74<br />
<strong>Economic</strong> <strong>Contribution</strong> <strong>of</strong> <strong>the</strong> <strong>Oceans</strong> <strong>Sector</strong> <strong>in</strong> <strong>British</strong> <strong>Columbia</strong><br />
Table K.2: Illustrative Cost Pr<strong>of</strong>ile for a 2TCF Offshore Natural Gas Field <strong>in</strong><br />
Queen Charlotte Bas<strong>in</strong> B.C.<br />
Year<br />
Production<br />
bcf<br />
Exploration<br />
Costs $ million US constant 2006<br />
Development Operat<strong>in</strong>g<br />
1 100<br />
2 100<br />
3 100<br />
4 100<br />
5 539<br />
6 522<br />
7 66.6 68<br />
8 96.9 68<br />
9 133.3 261 68<br />
10 133.3 156 68<br />
11 133.3 104 68<br />
12 133.3 68<br />
13 133.3 68<br />
14 133.3 68<br />
15 133.3 68<br />
16 133.3 68<br />
17 133.3 68<br />
18 133.3 68<br />
19 106.6 68<br />
20 85.3 68<br />
21 68.2 68<br />
22 54.6 68<br />
23 43.7 68<br />
24 34.9 68<br />
25 27.9 68<br />
26 22.4 68<br />
27 17.9 68<br />
28 14.3 68<br />
29 11.4 68<br />
30 9.2 68<br />
31 7.3 68<br />
Total 2,000 400 1,582 1,700<br />
Source: Taken directly from Wade Locke <strong>Economic</strong> Consult<strong>in</strong>g et al, “<strong>Economic</strong> Overview <strong>of</strong> Oil and Gas Reserves Found <strong>in</strong> <strong>the</strong> Queen Charlotte Bas<strong>in</strong>”, April<br />
2006 Appendix C p.54.<br />
Notes: 1. The <strong>in</strong>formation <strong>in</strong> <strong>the</strong> develop<strong>in</strong>g semi-submersible cost scenario was based on <strong>in</strong>formation from <strong>the</strong> Sable project <strong>in</strong> Nova Scotia.<br />
2. Operat<strong>in</strong>g costs - $68 US million/yr<br />
3. Losses - 10% <strong>in</strong> gas production
<strong>Economic</strong> <strong>Contribution</strong> <strong>of</strong> <strong>the</strong> <strong>Oceans</strong> <strong>Sector</strong> <strong>in</strong> <strong>British</strong> <strong>Columbia</strong> 75<br />
Table K.3: B.C. Illustrative Oil & Gas Scenarios - F<strong>in</strong>ancial Projections for<br />
Development <strong>of</strong> a S<strong>in</strong>gle Oil Field and a S<strong>in</strong>gle Gas Field <strong>in</strong> Queen<br />
Charlotte Bas<strong>in</strong> B.C.<br />
Oil Gas<br />
A. Project Parameters<br />
Total Production 1,615M bbls 6,060 bcf<br />
Price $50US/bbl $6US/mcf<br />
Quality Adjustment/Losses 5% 10%<br />
Exchange Rate .85 .85<br />
B. Project Totals $ millions US undiscounted<br />
Revenue 76,717 32,724<br />
Less: Capital Costs - Exploration 1,200 1,200<br />
- Development 8,200 4,800<br />
Operat<strong>in</strong>g Costs - Fixed & Variable 7,280 5,100<br />
- Transportation 2,420 0<br />
Equals: Net Return Before Taxes/Royalties 57,617 21,624<br />
C. B.C. Direct Impact Totals $ millions CDN undiscounted<br />
Direct GDP - Exploration & Development i.e. constn 3,539 2,259<br />
- Operat<strong>in</strong>g/Production 80,985 33,999<br />
- Total 84,524 36,258<br />
Wages - Exploration & Development i.e. constn 1,327 847<br />
- Operat<strong>in</strong>g/ Production 2,141 1,500<br />
- Total 3,468 2,347<br />
Employment - Exploration & Development i.e. constn 16,590 10,590<br />
(person-years) - Operat<strong>in</strong>g/Production 35,685 25,000<br />
- Total 52,275 35,590<br />
Source: Basic economics - Wade Locke <strong>Economic</strong> Consult<strong>in</strong>g et al, “<strong>Economic</strong> Overview <strong>of</strong> Oil & Gas Resources Found <strong>in</strong> <strong>the</strong> Queen Charlotte Bas<strong>in</strong>”,<br />
Prepared for NRCan, April 15 2006. Appendices B and C.<br />
B.C. content - illustrative assumptions.<br />
Notes: 1. The assumed B.C. oil price is 95% <strong>of</strong> <strong>the</strong> world oil (West Texas crude) oil price/losses <strong>of</strong> 10% appear <strong>in</strong> gas production.<br />
2. It is assumed that direct GDP and Labour Income at <strong>the</strong> construction phase are .32 and .12 respectively (based on GE Bridges 2004 c).<br />
Over half <strong>of</strong> construction expenditures likely will be sourced to non-Canadian firms (GE Bridges 2004 c).<br />
3. It is assumed a 25%:75% wage:non-wage split for all operat<strong>in</strong>g expenditures (based on GE Bridges 2004 c).<br />
4. Assumed average wage plus benefits rates - $80,000 CDN per person-years <strong>in</strong> construction and $60,000 CDN per person-years <strong>in</strong> operations.
76<br />
<strong>Economic</strong> <strong>Contribution</strong> <strong>of</strong> <strong>the</strong> <strong>Oceans</strong> <strong>Sector</strong> <strong>in</strong> <strong>British</strong> <strong>Columbia</strong><br />
Appendix l: Background - Potential Offshore W<strong>in</strong>d farms<br />
Table L.1: Illustrative Offshore W<strong>in</strong>d Energy Scenario – F<strong>in</strong>ancial Projections<br />
W<strong>in</strong>d<br />
A. Project Parameters<br />
Lifecycle - Construction 1 year<br />
- Production 20 years<br />
- Total 21 years<br />
Capacity 1,500MW<br />
Capacity Factor 40%<br />
Annual Production 5,256 Gwh<br />
Price $100/Mwh<br />
B. Project Totals $ millions CDN undiscounted<br />
Revenue 10,512<br />
Less: Construction Costs 4,170<br />
Operat<strong>in</strong>g Costs 2,200<br />
Equals: Net Return Before Taxes 4,142<br />
C. B.C. Benefit Totals $ millions CDN undiscounted<br />
Direct GDP - Construction 1,334<br />
- Operat<strong>in</strong>g/Production 8,752<br />
- Total 10,086<br />
Direct Wages - Construction 500<br />
- Operat<strong>in</strong>g/ Production 440<br />
- Total 940<br />
Employment - Construction 6,250<br />
(person-years) - Operat<strong>in</strong>g/Production 7,335<br />
- Total 13,585<br />
Source: Basic economics - Garrad Hassan, “Assessment <strong>of</strong> <strong>the</strong> Energy Potential and Estimated Costs <strong>of</strong> W<strong>in</strong>d Energy <strong>in</strong> <strong>British</strong> <strong>Columbia</strong>”,<br />
Prepared for BC Hydro, May 2005.<br />
B.C. content - illustrative assumptions.<br />
Notes: 1. The scenario <strong>in</strong>volves 5-300MW projects.<br />
2. Construction cost is $834 million for each 300MW block <strong>of</strong> capacity.<br />
3. Annual operat<strong>in</strong>g cost is $22 million per year for each 300MW project.<br />
4. It is assumed a 20:80 wage:non-wage split for production expenditures (similar to US <strong>of</strong>fshore w<strong>in</strong>d facilities – see Global Insight 2003).<br />
5. Operations phase GDP is Revenues less Non-Wage Operat<strong>in</strong>g Costs.<br />
6. Assumed average wage plus benefits rates - $80,000 per PY <strong>in</strong> construction and $60,000 per PY <strong>in</strong> operations.
<strong>Economic</strong> <strong>Contribution</strong> <strong>of</strong> <strong>the</strong> <strong>Oceans</strong> <strong>Sector</strong> <strong>in</strong> <strong>British</strong> <strong>Columbia</strong> 77<br />
Appendix M: <strong>Economic</strong> Impact Multipliers<br />
Table M.1: <strong>Economic</strong> Impact Multipliers for B.C. <strong>Oceans</strong> <strong>Sector</strong>s 2003<br />
Direct Indirect Induced Total<br />
GDPa LIa EMb GDPa LIa EMb GDPa LIa EMb GDPa LIa EMb Private <strong>Sector</strong><br />
1. Seafood .57 .34 9.7 .18 .13 3.5 .19 .11 3.0 .94 .58 16.2<br />
2. Forestry .35 .23 3.6 .36 .25 4.7 .19 .12 3.1 .90 .60 11.4<br />
3. Ship Build<strong>in</strong>g .48 .40 6.0 .31 .14 3.0 .22 .13 3.5 1.01 .67 12.5<br />
Boat Build<strong>in</strong>g .40 .30 7.0 .15 .08 2.1 .15 .09 2.4 .70 .47 11.5<br />
4. Mar<strong>in</strong>e Constn .43 .32 6.4 .31 .20 5.0 .21 .12 3.3 .95 .64 14.7<br />
5. Ocean High Tech - Mfg .42 .34 5.8 .17 .10 2.7 .18 .11 2.8 .77 .55 11.3<br />
- Services .57 .31 4.9 .30 .19 5.0 .20 .12 3.2 1.07 .62 13.1<br />
6. Ocean Recreation - Angl<strong>in</strong>g .38 .23 6.4 .22 .12 3.3 .14 .08 2.2 .74 .43 11.9<br />
- Cruise .41 .32 7.0 .35 .28 4.8 .24 .14 3.8 1.00 .74 15.6<br />
- Ferries .83 .58 8.1 .15 .08 2.0 .26 .16 4.2 1.24 .82 14.3<br />
- O<strong>the</strong>r .45 .30 9.3 .30 .19 5.0 .20 .12 3.1 .95 .61 17.4<br />
7. Ocean Transport - Cruise Suppliers .41 .32 7.0 .35 .28 4.8 .24 .14 3.8 1.00 .74 15.6<br />
Public <strong>Sector</strong><br />
- All O<strong>the</strong>rs .46 .36 6.4 .28 .19 4.7 .22 .13 3.5 .96 .68 14.6<br />
1. Federal Government .77 .77 9.9 .12 .09 2.2 .34 .21 5.5 1.23 1.07 17.6<br />
2. Prov<strong>in</strong>cial Government .70 .70 10.0 .15 .10 2.5 .32 .19 5.1 1.17 .99 17.6<br />
3. Universities/Education .65 .65 6.5 .15 .08 2.0 .29 .18 4.7 1.09 .91 13.2<br />
4. ENGOs .56 .56 14.0 .29 .20 5.0 .30 .18 4.9 1.15 .94 23.9<br />
Sources for Direct: Seafood - GSGislason “SWOT” 2004<br />
Forestry - Table C.2, Appendix C<br />
Ship & Boat Bldg - Table D.1, Appendix D<br />
Mar<strong>in</strong>e Constn - Stats Can “2003 B.C. I-O Multipliers” for eng<strong>in</strong>eer<strong>in</strong>g constn Ocean High Tech - Table F.1, Appendix F<br />
Ocean Recreation - GSGislason “SWOT” 2004 (for angl<strong>in</strong>g)<br />
- InterVISTAS 2005 (for cruise)<br />
- CDN Tourism Commission ratios for Canada (for o<strong>the</strong>r)<br />
Ocean Transport - InterVISTAS 2005 (for cruise suppliers), LECG 2004 (for all o<strong>the</strong>rs)<br />
Federal Govt - survey<br />
Prov<strong>in</strong>cial Govt - survey<br />
Education - survey<br />
ENGOs - survey<br />
for Indirect: Derived from Stats Can “2003 Prov<strong>in</strong>cial Input-Output Multipliers-<strong>British</strong> <strong>Columbia</strong>”, Cat. No. 15 F0042XDB, 2006<br />
for Induced: Estimated GDP as .40 <strong>of</strong> direct and <strong>in</strong>direct wages, salaries & SLI, LI as .24 <strong>of</strong> direct and <strong>in</strong>direct wages, salaries & SLI, PYs assum<strong>in</strong>g<br />
$37,500 per PY <strong>in</strong> 2003 (figures derived from a special Input-Output run by Statistics Canada)<br />
Legend: GDP - Gross Domestic Product. EM - Employment*<br />
LI - Labour Income.<br />
a Impacts per $1 direct output<br />
PY - Person year<br />
b Employment per $1 million direct output