Regions in Figures 2018

Create successful ePaper yourself
Turn your PDF publications into a flip-book with our unique Google optimized e-Paper software.
ECONOMY<br />
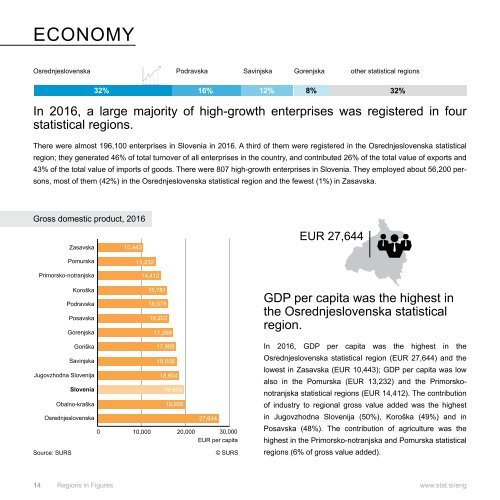
Osrednjeslovenska Podravska Sav<strong>in</strong>jska Gorenjska other statistical regions<br />
32% 16% 12% 8% 32%<br />
In 2016, a large majority of high-growth enterprises was registered <strong>in</strong> four<br />
statistical regions.<br />
There were almost 196,100 enterprises <strong>in</strong> Slovenia <strong>in</strong> 2016. A third of them were registered <strong>in</strong> the Osrednjeslovenska statistical<br />
region; they generated 46% of total turnover of all enterprises <strong>in</strong> the country, and contributed 26% of the total value of exports and<br />
43% of the total value of imports of goods. There were 807 high-growth enterprises <strong>in</strong> Slovenia. They employed about 56,200 persons,<br />
most of them (42%) <strong>in</strong> the Osrednjeslovenska statistical region and the fewest (1%) <strong>in</strong> Zasavska.<br />
Gross domestic product, 2016<br />
EUR 27,644<br />
Source: SURS<br />
© SURS<br />
GDP per capita was the highest <strong>in</strong><br />
the Osrednjeslovenska statistical<br />
region.<br />
In 2016, GDP per capita was the highest <strong>in</strong> the<br />
Osrednjeslovenska statistical region (EUR 27,644) and the<br />
lowest <strong>in</strong> Zasavska (EUR 10,443); GDP per capita was low<br />
also <strong>in</strong> the Pomurska (EUR 13,232) and the Primorskonotranjska<br />
statistical regions (EUR 14,412). The contribution<br />
of <strong>in</strong>dustry to regional gross value added was the highest<br />
<strong>in</strong> Jugovzhodna Slovenija (50%), Koroška (49%) and <strong>in</strong><br />
Posavska (48%). The contribution of agriculture was the<br />
highest <strong>in</strong> the Primorsko-notranjska and Pomurska statistical<br />
regions (6% of gross value added).<br />
14 <strong>Regions</strong> <strong>in</strong> <strong>Figures</strong> www.stat.si/eng