The Property Magazine Oxfordshire April/May 2018
The first issue of this exclusive Oxfordshire property magazine. Available online and in branches of Tesco, Sainsburys, ASDA, Morrisons, The Co-Operative
The first issue of this exclusive Oxfordshire property magazine. Available online and in branches of Tesco, Sainsburys, ASDA, Morrisons, The Co-Operative

Create successful ePaper yourself
Turn your PDF publications into a flip-book with our unique Google optimized e-Paper software.
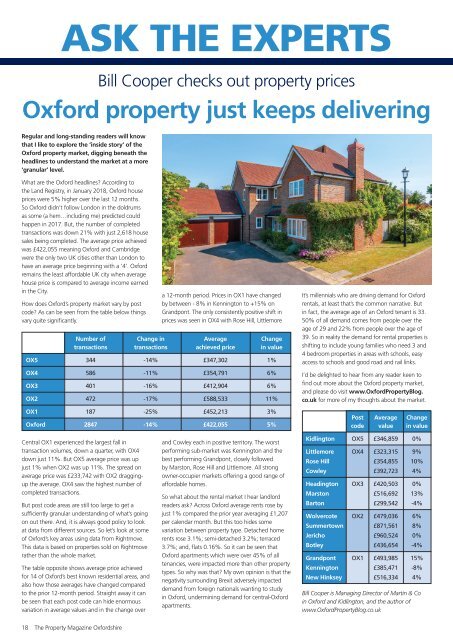
ASK THE EXPERTS<br />
Bill Cooper checks out property prices<br />
Oxford property just keeps delivering<br />
Regular and long-standing readers will know<br />
that I like to explore the ‘inside story’ of the<br />
Oxford property market, digging beneath the<br />
headlines to understand the market at a more<br />
‘granular’ level.<br />
What are the Oxford headlines? According to<br />
the Land Registry, in January <strong>2018</strong>, Oxford house<br />
prices were 5% higher over the last 12 months.<br />
So Oxford didn’t follow London in the doldrums<br />
as some (a hem…including me) predicted could<br />
happen in 2017. But, the number of completed<br />
transactions was down 21% with just 2,618 house<br />
sales being completed. <strong>The</strong> average price achieved<br />
was £422,055 meaning Oxford and Cambridge<br />
were the only two UK cities other than London to<br />
have an average price beginning with a ‘4’. Oxford<br />
remains the least affordable UK city when average<br />
house price is compared to average income earned<br />
in the City.<br />
How does Oxford’s property market vary by post<br />
code? As can be seen from the table below things<br />
vary quite significantly.<br />
a 12-month period. Prices in OX1 have changed<br />
by between - 8% in Kennington to +15% on<br />
Grandpont. <strong>The</strong> only consistently positive shift in<br />
prices was seen in OX4 with Rose Hill, Littlemore<br />
Number of Change in Average Change<br />
transactions transactions achieved price in value<br />
OX5 344 -14% £347,302 1%<br />
OX4 586 -11% £354,791 6%<br />
OX3 401 -16% £412,904 6%<br />
OX2 472 -17% £588,533 11%<br />
OX1 187 -25% £452,213 3%<br />
Oxford 2847 -14% £422,055 5%<br />
It’s millennials who are driving demand for Oxford<br />
rentals, at least that’s the common narrative. But<br />
in fact, the average age of an Oxford tenant is 33.<br />
50% of all demand comes from people over the<br />
age of 29 and 22% from people over the age of<br />
39. So in reality the demand for rental properties is<br />
shifting to include young families who need 3 and<br />
4 bedroom properties in areas with schools, easy<br />
access to schools and good road and rail links.<br />
I’d be delighted to hear from any reader keen to<br />
find out more about the Oxford property market,<br />
and please do visit www.Oxford<strong>Property</strong>Blog.<br />
co.uk for more of my thoughts about the market.<br />
Post Average Change<br />
code value in value<br />
Central OX1 experienced the largest fall in<br />
transaction volumes, down a quarter, with OX4<br />
down just 11%. But OX5 average price was up<br />
just 1% when OX2 was up 11%. <strong>The</strong> spread on<br />
average price was £233,742 with OX2 draggingup<br />
the average. OX4 saw the highest number of<br />
completed transactions.<br />
But post code areas are still too large to get a<br />
sufficiently granular understanding of what’s going<br />
on out there. And, it is always good policy to look<br />
at data from different sources. So let’s look at some<br />
of Oxford’s key areas using data from Rightmove.<br />
This data is based on properties sold on Rightmove<br />
rather than the whole market.<br />
<strong>The</strong> table opposite shows average price achieved<br />
for 14 of Oxford’s best known residential areas, and<br />
also how those averages have changed compared<br />
to the prior 12-month period. Straight away it can<br />
be seen that each post code can hide enormous<br />
variation in average values and in the change over<br />
and Cowley each in positive territory. <strong>The</strong> worst<br />
performing sub-market was Kennington and the<br />
best performing Grandpont, closely followed<br />
by Marston, Rose Hill and Littlemore. All strong<br />
owner-occupier markets offering a good range of<br />
affordable homes.<br />
So what about the rental market I hear landlord<br />
readers ask? Across Oxford average rents rose by<br />
just 1% compared the prior year averaging £1,207<br />
per calendar month. But this too hides some<br />
variation between property type. Detached home<br />
rents rose 3.1%; semi-detached 3.2%; terraced<br />
3.7%; and, flats 0.16%. So it can be seen that<br />
Oxford apartments which were over 45% of all<br />
tenancies, were impacted more than other property<br />
types. So why was that? My own opinion is that the<br />
negativity surrounding Brexit adversely impacted<br />
demand from foreign nationals wanting to study<br />
in Oxford, undermining demand for central-Oxford<br />
apartments.<br />
Kidlington OX5 £346,859 0%<br />
Littlemore OX4 £323,315 9%<br />
Rose Hill £354,855 10%<br />
Cowley £392,723 4%<br />
Headington OX3 £420,503 0%<br />
Marston £516,692 13%<br />
Barton £299,542 -4%<br />
Wolvercote OX2 £479,036 6%<br />
Summertown £871,561 8%<br />
Jericho £960,524 0%<br />
Botley £436,654 -4%<br />
Grandpont OX1 £493,985 15%<br />
Kennington £385,471 -8%<br />
New Hinksey £516,334 4%<br />
Bill Cooper is Managing Director of Martin & Co<br />
in Oxford and Kidlington, and the author of<br />
www.Oxford<strong>Property</strong>Blog.co.uk<br />
18<br />
<strong>The</strong> <strong>Property</strong> <strong>Magazine</strong> <strong>Oxfordshire</strong>