GASCO News (Volume 24, November 2013)
Produced for the National Gas Company of Trinidad & Tobago
Produced for the National Gas Company of Trinidad & Tobago

You also want an ePaper? Increase the reach of your titles
YUMPU automatically turns print PDFs into web optimized ePapers that Google loves.
Table 1: Atlantic liquefaction trains<br />
Train 1 Train 2 Train 3 Train 4<br />
Capacity, LNG 3.0 mtpa 3.3 mtpa 3.3 mtpa 5.2 mtpa<br />
Capacity, NGL 6,000 bpd 6,000 bpd 6,000 bpd 12,000 bpd<br />
BG 26.0% BG 32.5% BG 32.5% BG 28.89%<br />
BP 34.0% BP 42.5% Repsol 25.0% BP 37.78%<br />
Shareholders<br />
Repsol 20.0% Repsol 25.0% BP 42.5% Repsol 22.22%<br />
NGC 10.0% TTLNG 11.11%<br />
Summer<br />
Soca<br />
10.0%<br />
Contracted destination US, Spain US, Spain US, Spain US, DR, Spain<br />
Gas supply rate 520 mmscfd 560 mmscfd 560 mmscfd 800 mmscfd<br />
Date commissioned March 1999 August 2002 April 2003 December 2005<br />
Source: Atlantic LNG<br />
mtpa: million tons per annum; bpd: barrels per day; mmscfd: million standard cubic feet per day<br />
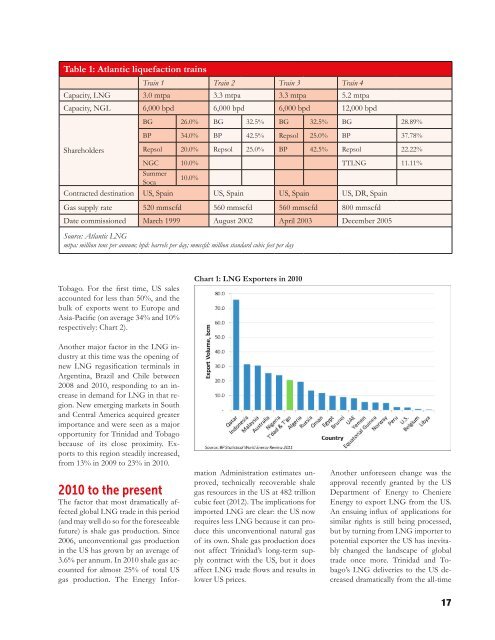
Tobago. For the first time, US sales<br />
accounted for less than 50%, and the<br />
bulk of exports went to Europe and<br />
Asia-Pacific (on average 34% and 10%<br />
respectively: Chart 2).<br />
Chart 1: LNG Exporters in 2010<br />
Another major factor in the LNG industry<br />
at this time was the opening of<br />
new LNG regasification terminals in<br />
Argentina, Brazil and Chile between<br />
2008 and 2010, responding to an increase<br />
in demand for LNG in that region.<br />
New emerging markets in South<br />
and Central America acquired greater<br />
importance and were seen as a major<br />
opportunity for Trinidad and Tobago<br />
because of its close proximity. Exports<br />
to this region steadily increased,<br />
from 13% in 2009 to 23% in 2010.<br />
2010 to the present<br />
The factor that most dramatically affected<br />
global LNG trade in this period<br />
(and may well do so for the foreseeable<br />
future) is shale gas production. Since<br />
2006, unconventional gas production<br />
in the US has grown by an average of<br />
3.6% per annum. In 2010 shale gas accounted<br />
for almost 25% of total US<br />
gas production. The Energy Information<br />
Administration estimates unproved,<br />
technically recoverable shale<br />
gas resources in the US at 482 trillion<br />
cubic feet (2012). The implications for<br />
imported LNG are clear: the US now<br />
requires less LNG because it can produce<br />
this unconventional natural gas<br />
of its own. Shale gas production does<br />
not affect Trinidad’s long-term supply<br />
contract with the US, but it does<br />
affect LNG trade flows and results in<br />
lower US prices.<br />
Another unforeseen change was the<br />
approval recently granted by the US<br />
Department of Energy to Cheniere<br />
Energy to export LNG from the US.<br />
An ensuing influx of applications for<br />
similar rights is still being processed,<br />
but by turning from LNG importer to<br />
potential exporter the US has inevitably<br />
changed the landscape of global<br />
trade once more. Trinidad and Tobago’s<br />
LNG deliveries to the US decreased<br />
dramatically from the all-time<br />
17