Callander Fund - Central Europe & Callander Fund South Eastern ...
Callander Fund - Central Europe & Callander Fund South Eastern ...
Callander Fund - Central Europe & Callander Fund South Eastern ...

You also want an ePaper? Increase the reach of your titles
YUMPU automatically turns print PDFs into web optimized ePapers that Google loves.
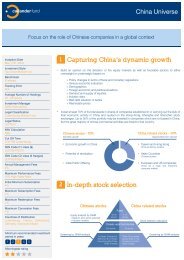
Presentation of the<br />
<strong>Callander</strong> <strong>Fund</strong> - <strong>Central</strong> <strong>Europe</strong> p<br />
&<br />
<strong>Callander</strong> <strong>Fund</strong> - <strong>South</strong> <strong>Eastern</strong> <strong>Europe</strong><br />
1<br />
From June 6th to 10th 2011
This presentation has been prepared by Gutmann Kapitalanlage AG, <strong>Fund</strong> Manager<br />
of the <strong>Callander</strong> <strong>Fund</strong>s – <strong>Central</strong> <strong>Europe</strong> & <strong>South</strong> <strong>Eastern</strong> <strong>Europe</strong><br />
2<br />
Speaker<br />
Nikolaus Goerg g – Investment Manager g
Agenda<br />
• Gutmann Kapitalanlage AG & Bank Gutmann…………………….. 04<br />
• The Team……………………………………………………………… 07<br />
• <strong>Fund</strong> concept………………………………………………………….. 09<br />
• Investment Process…………………………………………………... 13<br />
• Performance Review…………………………………….…………....<br />
Review<br />
19<br />
• Macro Overview………………………………………………….……. 23<br />
• Perspective…………………………………………………………….. 36<br />
• Why invest in the <strong>Callander</strong> <strong>Fund</strong> <strong>Central</strong> <strong>Europe</strong> & <strong>Eastern</strong><br />
<strong>Europe</strong>?........................................................................................... 41<br />
• Portfolio – <strong>Callander</strong> <strong>Fund</strong> <strong>Central</strong> <strong>Europe</strong>………………………… 43<br />
3
4<br />
Gutmann Kapitalanlage AG<br />
&<br />
Bank Gutmann
Gutmann Kapitalanlage AG & Bank Gutmann<br />
Gutmann Kapitalanlage AG<br />
• Gutmann KAG was founded in 1986 as a 100% subsidiary of Bank Gutmann<br />
• With 18 employees Gutmann KAG manages more than 90 funds with AuM of roughly 4.5 bn<br />
EUR<br />
• Core expertise: asset allocation, CEE public and private equity, EU and CEE bonds<br />
Bank Gutmann<br />
• Bank Gutmann was founded in 1922, , todayy held byy the Kahane family y (80%) ( ) and<br />
10 partners (20%)<br />
• Offices in Vienna, Budapest and Bucharest<br />
• Partners and senior executives of the bank are personally involved in day-to-day day to day relations with<br />
private clients<br />
• Focus on international private banking for over two decades<br />
• Core business is customized wealth management<br />
• AuM over 12 bn EUR<br />
• No underwriting, no commercial lending<br />
5
Bank Gutmann: International Private Banking Awards<br />
• Fuchs Report, Private Banking Survey*:<br />
– BBest t Private P i t Bank B k in i AAustria t i iin 2009/2010<br />
– Best Private Bank in Austria in 2008/2009<br />
– Promoted to “All Time Best List” for consistent outstanding performance in 2006/2007<br />
– Best Private Bank in 2005/2006<br />
– No. 2 Best Private Bank in 2004/2005<br />
– Best Private Bank in Austria in 2004/2005<br />
• Euromoney, International Private Banking Survey:<br />
– Best Foreign Bank in Hungary and Romania 2010<br />
– Best Foreign Bank in Hungary 2009<br />
– Best Private Bank for Trust Services in <strong>Central</strong> & <strong>Eastern</strong> <strong>Europe</strong> 2009<br />
– Best Private Bank in Austria in 2006 and 2007 (overall and local)<br />
– Best Private Bank at Relationship Management in Austria in 2005<br />
– Best Private Bank at Privacy and Security in Austria in 2005<br />
* covering Austria, Germany, Liechtenstein, Luxemburg and Switzerland<br />
6
7<br />
The Team
Team<br />
No picture<br />
available<br />
8<br />
Mr. Friedrich Strasser, CEFA: Member of Board of Bank Gutmann, Chief Investment<br />
Officer. With Bank Gutmann since 1990. Member of the Board of AIH – Alternative<br />
Investments Holding AG, Member of the Supervisory Board of Private Equity I-III AG,<br />
Member of the Board of G&H Kapitalpartner AG and G&H Holding AG.<br />
Mr. Nikolaus Goerg, CEFA: Prior to joining Gutmann KAG in 2006, Mr. Goerg had worked<br />
more than 6 years as a senior equity analyst at one of Austria‘s largest Banking<br />
Groups (Bank Austria Creditanstalt). In 2007 Mr. Goerg became head of Gutmann’s<br />
CEE equities team and its chief Portfolio Manager.<br />
Mrs. Kateryna Wagesreiter, CFA: Mrs. Wagesreiter (formerly Bilska) studied business<br />
administration in Lemberg. Prior to joining Bank Gutmann she had 3 years of<br />
experience i iin client li t relationship l ti hi managementt andd marketing k ti ffor CEE iin other th bbanks. k<br />
She joined Bank Gutmann as client relationship manager for CEE in 2004. In 2007<br />
she joined the CEE team as analyst and co-<strong>Fund</strong> Manager.<br />
Mr Mr. Christoph Olbrich Olbrich, CFA: Mr Mr. Olbrich studied Economics and Business Administration<br />
Administration.<br />
Prior to joining Bank Gutmann he has had 3 years of experience in Risk Management<br />
with Austria’s largest Asset Manager (Raiffeisen Capital Management). In 2007 he<br />
joined the CEE team at Bank Gutmann as analyst and co-<strong>Fund</strong> Manager.<br />
Ms. Mirjana Kovacevic: Ms. Kovacevic studied business administration in Vienna and<br />
Belgrade. She joined Gutmann KAG as a member of the risk management team in<br />
May 2007. Ms. Kovacevic is a Serbian citizen.
9<br />
<strong>Fund</strong> Concept
Our mission statement<br />
Active Active, bottom bottom-up up biased approach to<br />
• combine in-depth p views with a long-term g orientation<br />
• generate superior investment ideas within the CE & SEE universe<br />
• generate superior risk return profile in allocating funds to the region<br />
• look for opportunities across the market capitalization spectrum, with a close<br />
eye on liquidity issues<br />
10
Our strategy<br />
• Allocating according to market capitalization and to free float (MSCI) creates a<br />
hhuge artificial ifi i l bi bias towards d RRussia i andd towards d the h RRussian i energy majors. j<br />
Russian weighting in the MSCI EM EE is roughly 75%.<br />
• Ab About t 50% off RRussian i market k t capitalization it li ti i is “i “influenced” fl d” bby th the KKremlin. li<br />
• Special situation of Russian economy and high dependence on oil demand a<br />
more balanced investment approach approach.<br />
• <strong>Eastern</strong> <strong>Europe</strong> is more than just Russia and more than just a commodities´<br />
proxy proxy. Proper convergence allows for a completely different investment story<br />
with better diversification as a welcome consequence.<br />
11
How did the long term strategy work out?<br />
As of May<br />
30, 2011<br />
Returns Annual volatility profile<br />
80%<br />
<strong>Callander</strong> CE MSCI EM EE out/underper<br />
formance<br />
1 yr 16,8% 15,8% 1,0%<br />
3 yrs -14,3% -29,5% 15,2%<br />
5yrs 13,9% -9,5% 23,4%<br />
10yrs 199 199,6% 6% 152 152,8% 8% 46 46,8% 8%<br />
since<br />
inception<br />
(Feb .1997) 100,1% 93,9% 6,2%<br />
DEM-returns<br />
Source: Bloomberg<br />
12<br />
70%<br />
60%<br />
50%<br />
40%<br />
30%<br />
20%<br />
10%<br />
0%<br />
27/02/19988<br />
27/02/19999<br />
27/02/20000<br />
27/02/20011<br />
27/02/20022<br />
27/02/20033<br />
27/02/20044<br />
27/02/20055<br />
27/02/20066<br />
27/02/20077<br />
27/02/20088<br />
27/02/20099<br />
27/02/20100<br />
27/02/20111<br />
<strong>Callander</strong> CE ann vol MSCI EM EE ann vol<br />
roll. 12m vol.<br />
Source: Bloomberg
13<br />
Investment Process
Our investment approach: overview<br />
14<br />
Database-screening<br />
Input of our analysts<br />
Qualitative scoringg<br />
Portfolio<br />
Permanent<br />
checks
Investment Process I<br />
database<br />
screening<br />
Idea Generation<br />
identification of<br />
sector trends<br />
Universe 400<br />
companies<br />
find analysts<br />
with best<br />
proven track<br />
record<br />
Liquidity<br />
issues<br />
Generate<br />
40-60 ideas<br />
15<br />
double check<br />
quality of<br />
consensus<br />
activity yg generates<br />
ideas,<br />
frequent company<br />
visits
Investment Process II<br />
Quantitative and qualitative steps<br />
Quantitative process Qualitative process<br />
• model setup<br />
• economic i assumptions ti<br />
• detailed assumptions<br />
• valuation<br />
• double check of results<br />
16<br />
• extensive management meetings<br />
• qualitative lit ti scoring i of f companies i<br />
• changes, NOT status quo decisive!<br />
qualitiative scoring taken into account
Investment Process III<br />
How we make final decisions<br />
Input factors<br />
Weighting<br />
Comments<br />
• Valuation<br />
5<br />
Most important input<br />
• Potential for positive<br />
surprises<br />
1<br />
i.e. legal, regulatory,…<br />
• Sensitivity to underlying<br />
macro-situation<br />
1 In case it cannot be modelled, i.e.<br />
FX,…<br />
• Sensitivity to changes<br />
in global sentiment<br />
• Qualitative scoring<br />
• Liquidity in the stock<br />
17<br />
1<br />
2<br />
2<br />
Experience of the management<br />
team<br />
Changes decisive<br />
Final check, degree of conviction<br />
Valuation provides target price price.<br />
Qualitative scoring as an indicator for changes within the company.<br />
Liquidity provides degree of conviction.
GERD – Gutmann Equity Research Database<br />
• In-house research database of the<br />
Gutmann CEE Team<br />
• Enables complete documentation of<br />
the investment process<br />
Excel<br />
• Extensive Company Analysis in<br />
Excel company models<br />
• CCompany models d l are saved d iin<br />
GERD<br />
• Research data from Thomson<br />
Analytics<br />
• Research document database<br />
containing currently more than 1200<br />
documents<br />
• GERD is in continuous development<br />
18<br />
Models
19<br />
Performance review
Weekly fund flow data: Remarkable in 2011 so far!<br />
mln. USD U<br />
500<br />
400<br />
300<br />
200<br />
100<br />
0<br />
-100<br />
-200<br />
-300 300<br />
-400<br />
-500<br />
2005 2006 2007 2008 2009 2010 2011<br />
Source: EPFR; Wood; 2011 shows ytd data<br />
20<br />
Global EM Total EM <strong>Europe</strong> Russia<br />
In Q1 we witnessed an extreme<br />
shift in investor activities in<br />
Russia.<br />
Russia benefited among other<br />
things from the geopolitical<br />
setting.
Our CE-strategy: a difficult start into the year<br />
140<br />
130<br />
120<br />
110<br />
100<br />
90<br />
80<br />
MSCI RU Cons staples MSCI RU Energy<br />
Source: Bloomberg, USD returns ytd<br />
21<br />
As a consequence of „blind“<br />
money pouring i iinto t RRussia, i it<br />
was the large energy majors<br />
being pushed up…. Until the<br />
end of April! p<br />
Russia experienced significant<br />
outflows from mid-May.<br />
Consider also that Energy<br />
represents almost 60% in the<br />
MSCI Russia, , consumer<br />
staples only 2.5%!
Sector shift in Q1 2011 negative for the strategy<br />
% Active All.<br />
-15% -10% -5% 0% 5% 10% 15%<br />
Financials<br />
Energy<br />
Materials<br />
Utilities<br />
Health Care<br />
Telecommunication<br />
Information Technology<br />
Consumer Discretionary<br />
Consumer Staples<br />
Industrials<br />
Source: Bloomberg, as of May 30, 2011, ytd-figures, vs. Bank Gutmann Benchmark<br />
22<br />
Attribution constituents (in %pts)<br />
-2 -1.5 -1 -0.5 0 0.5 1 1.5<br />
Currency Selection Allocation Total
23<br />
Macro Overview
Russia and the price of oil: decoupling?<br />
Source: UniCredit Research, MSCI Barra, Bloomberg, Thomson Datastream<br />
as of May, 26th, 2011<br />
24<br />
In light of the current oil<br />
price environment Russian<br />
equities trade surprisingly<br />
low.<br />
Potential reasons: IPO IPOpipeline,<br />
disappointing<br />
corporate earnings, weak<br />
spot in the economic cycle,<br />
inflation jitters…
Almost each market back to pre-crisis levels! Almost!<br />
300%<br />
250%<br />
200%<br />
150%<br />
100%<br />
50%<br />
0%<br />
-50%<br />
5%<br />
0%<br />
-5%<br />
-10%<br />
-15% 15%<br />
-20%<br />
-25%<br />
-30%<br />
-35%<br />
MSCI<br />
World<br />
Source: Bloomberg; EUR returns<br />
25<br />
MSCI EM MSCI EM<br />
Asia<br />
MSCI<br />
LatAm<br />
MSCI EM<br />
EE<br />
2001-2010<br />
2008-May<br />
20, 2011<br />
Despite having been the<br />
second best performing<br />
region eg o in the e last as decade, decade,…<br />
…<strong>Eastern</strong> <strong>Europe</strong> p still is way y<br />
below its pre-crisis highs.<br />
What went wrong?
The impact of the crisis on output growth (Q3 08 GDP: 100%)<br />
Source: Eurostat, OECD, IMF, wiiw/Bruegel: „Whither growth in central and eastern <strong>Europe</strong>“<br />
Latam-8: Argentina, Brazil, Chile, Columbia, Ecuador, Mexico, Peru, Uruguay<br />
Asia Asia-6: 6: Indonesia, Indonesia Korea Korea, Malaysia, Malaysia Philippines Philippines, Taiwan Taiwan, Thailand<br />
26
How not to enter a credit crunch! Current account % of GDP<br />
Source: IMF, wiiw/Bruegel: „Whither growth in central and eastern <strong>Europe</strong>“<br />
CE5: Czech Republic, Hungary, Poland, Slovakia, Slovenia<br />
WB5: Albania, Bosnia and Herzegovina, Croatia, frmr. Yugoslav Republic of Macedonia,<br />
Serbia<br />
BB5: Bulgaria, Estonia, Latvia, Lithuania, Romania<br />
Asia-6: Indonesia, Korea, Malaysia, Philippines, Taiwan, Thailand<br />
Latam-8: Argentina, Brazil, Chile, Columbia, Ecuador, Mexico, Peru, Uruguay<br />
27<br />
Trade integration increased strongly<br />
in the convergence phase.<br />
Unfortunately for some, domestic<br />
consumption p was willingly gy funded<br />
from abroad, triggering a widening<br />
current account deficit.
External financing over the last years (net, bln US$)<br />
350<br />
300<br />
250<br />
200<br />
150<br />
100<br />
50<br />
0<br />
-50<br />
-100<br />
FDI<br />
EM <strong>Europe</strong> EM LatAm EM Asia<br />
Portfolio investments<br />
private creditors<br />
Source: The Institute of International Finance (2010)<br />
28<br />
FDI<br />
Portfolio investments<br />
private creditors<br />
FDI<br />
Portfolio investments<br />
private creditors
Pre-crisis growth of credit, the current account and 2009 GDP growth<br />
Source: IMF WEO, April 2010, Bruegel<br />
29<br />
The faster credit was growing prior<br />
to the crisis, the more severe the<br />
economic downturns have been.
The Capital-Paradox: the relationship of growth and capital flows<br />
Avg GDP peer<br />
capita growwth<br />
Avg C/A-balance as % of GDP<br />
Source: Prasad, Rajan, Subramanian (2007): „The Paradox of<br />
Capital“, in: IMF, Finance and Development Magazine<br />
30<br />
Economic theory would tell us that<br />
capital would flow „downhill“, from<br />
rich i h countries t i tto poor countries, t i<br />
because the marginal rate of<br />
return on capital is higher in<br />
poorer countries.<br />
But paradoxically those countries<br />
experienced the highest growth<br />
rates, t that th t were exporting ti capital. it l
The threat of (excessive) capital imports: real effective exchange rates<br />
160<br />
140<br />
120<br />
100<br />
80<br />
60<br />
40<br />
01-1994<br />
01-1995<br />
01-1996<br />
01-1997<br />
01-1998<br />
01-1999<br />
01-2000<br />
01-2001<br />
01-2002<br />
01-2003<br />
01-2004<br />
01-2005<br />
01-2006<br />
01-2007<br />
01-2008<br />
01-2009<br />
01-2010<br />
01-2011<br />
Brazil Czech Republic<br />
Euro area Hungary<br />
Poland Russia<br />
Source: Bank for International Settlements, Settlements BIS effective exchange<br />
rate, Real (CPI-based), Broad Indices, Monthly averages;<br />
2005=100<br />
31<br />
160<br />
140<br />
120<br />
100<br />
80<br />
60<br />
40<br />
01-1994<br />
01-1995<br />
01-1996<br />
01-1997<br />
01-1998<br />
01-1999<br />
01-2000<br />
01-2001<br />
01-2002<br />
01-2003<br />
01-2004<br />
01-2005<br />
01-2006<br />
01-2007<br />
01-2008<br />
01-2009<br />
01-2010<br />
01-2011<br />
Bulgaria Croatia Euro area Romania
The composition of GDP per capita<br />
=<br />
Labor<br />
productivity<br />
x Employment<br />
rate<br />
x<br />
Share of working<br />
age population in<br />
total population<br />
where: POP = total population, EMP = employed population, WorkingAgePOP = working age population<br />
Source: Mitra, P. in: The World Bank, 2008<br />
32
How we should see growth<br />
• Structural transformation<br />
• From low-productivity to high-productivity activities<br />
• By enabling resources to move freely towards the latter<br />
• OOr maybe b evenby b accelerating l ti th the shifts hift off resources<br />
“The key to growth is not more finance, but enhanced profitability of modern tradables!” *<br />
* Rodrik (2010): „Growth after the crisis“<br />
33
“Like Phoenix from its ashes”: You don´t need credit to recover!<br />
Sources: Calvo, Izquierdo, Talvi (2006), in: Zarazaga (2006), working paper, Dallas FED<br />
34
So what are the lessons for <strong>Central</strong> <strong>Europe</strong> / <strong>South</strong> <strong>Eastern</strong> <strong>Europe</strong>?<br />
• Don´t worry, if capital inflows do not reach pre-crisis levels!<br />
• Embrace the fact that sustainable growth comes via productivity gains!<br />
• Try to channel capital inflows into productive sectors and watch for the composition of inflows!<br />
• Create a “productivist”economic policy!<br />
• Be market friendly, create stability and confidence in the local banking sector!<br />
• Utilize the banking sector as an ally in your push to allow ressources to move easily!<br />
• Check, whether monetary policy is appropriate!<br />
• Check, whether the exchange rate regime is appropriate!<br />
• Make better and more use of EU-funding initiatives (<strong>Europe</strong>an Development Programme etc)!<br />
35
36<br />
Perspective
Current allocation: <strong>Callander</strong> <strong>Fund</strong> - <strong>Central</strong> <strong>Europe</strong><br />
80%<br />
70%<br />
60%<br />
50%<br />
40%<br />
30%<br />
20%<br />
10%<br />
0%<br />
As of May 30, 2011<br />
37<br />
<strong>Callander</strong> CEE MSCI EM EE<br />
50%<br />
45%<br />
40%<br />
35%<br />
30%<br />
25%<br />
20%<br />
15%<br />
10%<br />
5%<br />
0%
Current allocation: <strong>Callander</strong> <strong>Fund</strong> - <strong>South</strong> <strong>Eastern</strong> <strong>Europe</strong><br />
35% 25%<br />
30%<br />
25%<br />
20%<br />
15%<br />
10%<br />
5%<br />
20%<br />
15%<br />
10%<br />
0% 0%<br />
As of May 30, 2011<br />
<strong>Callander</strong> SEE Benchmark SEE<br />
38<br />
5%
What makes us cautious ?<br />
• Potential spillover of Greek sovereign debt issues via local banking sector into<br />
SEE-subsidiaries.<br />
• Declining willingness to converge due to perceived reduced attractiveness of<br />
E(M)U-accession?<br />
• Potential headwinds from fiscal consolidation, especially where IMF is present<br />
(Romania (Romania, Serbia)<br />
• Global leading indicators lose momentum.<br />
• Different monetary regimes globally can have unintended consequences.<br />
• Different sensitivies to headline inflation can distort economic policies.<br />
39
What makes us optimistic ?<br />
• CEE and SEE on the verge of taking the next step of convergence.<br />
• Can they take the right lessons from the crisis?<br />
• Privatization opportunities could lead to efficiency gains.<br />
• CEE and SEE as a whole will continue to grow faster than Western <strong>Europe</strong>.<br />
• EU is highly committed committed, not only to the periphery periphery.<br />
• External competitiveness (measured as increase of share of exports to EU) is<br />
increasing increasing.<br />
• External imbalances negligible compared to 2007/08.<br />
• Capital inflows appear much healthier than before the crisis.<br />
• Valuation discount to other Emerging Markets.<br />
40
Why invest in <strong>Callander</strong> <strong>Fund</strong>s <strong>Central</strong> <strong>Europe</strong><br />
41<br />
&<br />
<strong>South</strong> <strong>Eastern</strong> <strong>Europe</strong>?
Why invest in <strong>Callander</strong> <strong>Fund</strong>s – <strong>Central</strong> <strong>Europe</strong> & <strong>South</strong> <strong>Eastern</strong> <strong>Europe</strong>?<br />
• The <strong>Callander</strong> <strong>Fund</strong>s provide unique exposures to overlooked niches within the<br />
Emerging Markets Universe.<br />
• The Manager combines a long term view with long term experience and long term<br />
commitment with a long term track record (<strong>Callander</strong> CE since 1997).<br />
• Local presence, language skills and extensive travelling provide a better<br />
understanding of the region.<br />
• Investment approach tries to avoid MSCI-related risks.<br />
• “Risk” is not just market risk. Clear focus also on liquidity issues.<br />
• Superior risk-return profile since inception.<br />
42
43<br />
Portfolio<br />
<strong>Callander</strong> <strong>Fund</strong> - <strong>Central</strong> <strong>Europe</strong>
Portfolio market valuation as of May 31st, 2011<br />
44
For further information about the <strong>Callander</strong> <strong>Fund</strong>, please contact :<br />
Ademus S.A in Paris<br />
Catherine de Christen Nicolas Bague Dominique Meeke<br />
Chief Executive Officer Marketing Director Relationship Manager<br />
Tel. +33 1 53 53 88 00 Tel. +33 1 53 53 88 29 Tel: +33 6 14 86 30 48<br />
cdechristen@ademus.fr nbague@ademus.fr dmeeke@ademus.fr<br />
Diana Hautbout Elodie Lasserre<br />
Communications Marketing Assistant<br />
Tel: +33 1 53 53 88 18 Tel: +33 1 53 53 88 26<br />
dhautbout@ademus.fr @ elasserre@ademus.fr<br />
@<br />
C<strong>Callander</strong> ll d MManagers SS.A. A iin LLuxembourg. b<br />
Marc Cellier Nicolas Hanus Séverine Daniel<br />
Chief Executive Officer Executive Manager Director Business & Development<br />
Tel: +352 2692 70 34 61 Tel: +352 2692 70 34 61 Tel. +33 7 77 28 23 99<br />
mcellier@callandermanagers.lu nhanus@callandermanagers.lu sdaniel@callandermanagers.lu<br />
46
Orders to<br />
E.F.A. (<strong>Europe</strong>an <strong>Fund</strong> Administration SA)<br />
Subsidiary of Banque de Luxembourg, State<br />
Bank and Savings <strong>Fund</strong> & KBL <strong>Europe</strong>an<br />
Private Bankers SA<br />
2, rue d’Alsace – P.O. Box 1725 – L1017<br />
Luxembourg<br />
Ms. Marie Schumacher<br />
Mr. Ludovic Skowron<br />
Fax<br />
Cleastream: 10023<br />
Euroclear: 00281<br />
T. +352 48 48 80 826<br />
T. +352 48 48 80 582<br />
T. +352 48 65 61 8002<br />
*Orders have to be entered by fax before<br />
2 p.m. (Luxembourg time) with the beneficiary<br />
owner clearly l l indicated. i di t d<br />
Subscriptions – redemption terms<br />
Settlement day<br />
Subscriptions and redemptions D+5<br />
Delivery versus payment<br />
Subscriptions of units may only be effected on<br />
the basis of the prospectus accompanied by<br />
the management regulations and sub-fund<br />
descriptions or on the basis of the simplified<br />
prospectus.<br />
Information form<br />
Luxembourg Mutual <strong>Fund</strong> – Part 1 (12/20/2002 Law) – UCITS III<br />
<strong>Callander</strong> <strong>Fund</strong> Currency ISIN Bloomberg Telekurs WKN<br />
Asset C1 USD LU0012008875 CAEB CH595132 971194<br />
Asset C2 EUR (Hedged) LU0167130078 CAC2 CH1591816 136478<br />
Japan New Growth C1 JPY LU0097747421 CALJNGI CH802617 590936<br />
Japan New Growth C2 EUR (Hedged) LU0192479029 CALJNII CH1857062 A0B50J<br />
Japan New Growth I1 JPY LU0522165918 CALJNI1 LX CH11455782 A1C1F0<br />
Japan New Growth I2 EUR (Hedged) LU0522167377 CALJNI2 LX CH11455783 A1C1F1<br />
China Universe C1 USD LU0192479375 CALCHUS CH1857144 A0B50G<br />
China Universe C2 EUR (Hedged) LU0192479615 CALCHEU CH1857150 A0B50H<br />
DIAM Asia Pacific ex Japan C1 USD LU0551507535 CALDAC1 LX 11876603 A1C9BM<br />
DIAM Asia Pacific ex Japan C2 EUR (Hedged) LU0551508004 CALDAC2 LX 11876607 A1C9BN<br />
DIAM Asia Pacific ex Japan I1 USD LU0551508186 CALDAI1 LX 11876615 A1C9BP<br />
DIAM Asia Pacific ex Japan I2 EUR (Hedged) LU0551508343 CALDAI2 LX 11876624 A1C9BQ<br />
<strong>Central</strong> <strong>Europe</strong> C1 EUR LU0073519844 CALEEUR CH583137 987308<br />
<strong>South</strong> <strong>Eastern</strong> <strong>Europe</strong> C1 EUR LU0373272714 CALSOEE CH4338268 A0Q434<br />
SSwiss i Growth G th SSmall ll and d Mid C Cap C1 CHF LU0012160239 CALSWII CH596596 172935<br />
Swiss Growth Small and Mid Cap C2 EUR (Hedged) LU0272061077 CALSWI2 CH2744635 A0LFAT<br />
Global Security C1 USD LU0298334862 CALGSC1 CH3067196 A0MR0L<br />
Global Security C2 EUR (Hedged) LU0298335679 CALGSC2 CH3067239 A0MR0M<br />
The Net Asset Value is calculated on each business day in Luxembourg based on the latest known prices.
Custodian and promotor<br />
» Banque a que de Luxembourg u e bou g<br />
14, boulevard Royal, L-2449, Luxembourg<br />
Luxembourg<br />
Fees (as a NAV percentage)<br />
Annual management fees (C1, C2)<br />
Initial minimum subscription (C1, C2)<br />
Annual management fees (I1, I2)<br />
Initial minimum subscription (Japan I1)<br />
Initial minimum subscription (DIAM Asia Pacific ex Japan I1)<br />
Initial minimum subscription (I2)<br />
2%<br />
none<br />
1.2%<br />
22.5 5 billion JPY<br />
30 million USD<br />
20 million EUR<br />
Maximum subscription fees (all shares)<br />
4%<br />
Maximum redemption fees (all shares)<br />
1%<br />
Maximum conversion fees (all shares)<br />
1%<br />
Performance fees - High Water Level (except Japan and DIAM Asia Pacific ex Japan) 10%<br />
IInformation f ti resources<br />
Newspapers and magazines<br />
Bourse de Luxembourg<br />
Boersen Zeitung<br />
<strong>Europe</strong>an p City y Guide<br />
Expansion<br />
International Herald Tribune<br />
Milano Finanza<br />
Thomson Reuters<br />
WertpapierMitteilungen<br />
Platforms<br />
Allfunds Bank<br />
<strong>Europe</strong>rformance<br />
Lipper pp Analytical y Services<br />
MFEX<br />
Morningstar<br />
Reuters – BDLLUX04<br />
Standard & Poors<br />
www.callanderfund.com<br />
countries of<br />
countries of<br />
»distribution<br />
Luxembourg France Switzerland<br />
Germany United Kingdom Austria<br />
Spain<br />
Italyy<br />
Liechtenstein Singapore<br />
Sweden<br />
In Italy and the United Kingdom, the<br />
commercialisation is only permitted to<br />
institutional investors. The <strong>Callander</strong> <strong>Fund</strong> –<br />
Japan New Growth and the <strong>Callander</strong> <strong>Fund</strong> –<br />
DIAM Asia Pacific ex Japan are registered for<br />
sale in Liechtenstein and Singapore.<br />
<strong>Callander</strong> <strong>Fund</strong> units cannot be sold,<br />
transferred or issued to the public in the<br />
United States.
Notes<br />
49
www www.callanderfund.com<br />
callanderfund com<br />
50