

The New Atlantis - Winter 2018 (Issue 54) uncompressed with cover

Create successful ePaper yourself
Turn your PDF publications into a flip-book with our unique Google optimized e-Paper software.
Tafari Mbadiwe<br />
<strong>The</strong> trouble is that measurements of predictive reliability and fairness<br />
don’t exist in a vacuum. <strong>The</strong>y are mathematically linked to how frequently<br />
the event you’re trying to predict actually occurs — what statisticians<br />
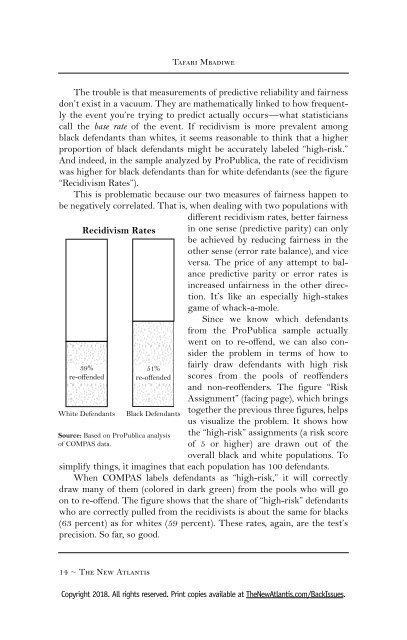
call the base rate of the event. If recidivism is more prevalent among<br />
black defendants than whites, it seems reasonable to think that a higher<br />
proportion of black defendants might be accurately labeled “high-risk.”<br />
And indeed, in the sample analyzed by ProPublica, the rate of recidivism<br />
was higher for black defendants than for white defendants (see the figure<br />
“Recidivism Rates”).<br />
This is problematic because our two measures of fairness happen to<br />
be negatively correlated. That is, when dealing <strong>with</strong> two populations <strong>with</strong><br />
Recidivism Rates<br />
39%<br />
re-offended<br />
White Defendants<br />
51%<br />
re-offended<br />
Black Defendants<br />
Source: Based on ProPublica analysis<br />
of COMPAS data.<br />
different recidivism rates, better fairness<br />
in one sense (predictive parity) can only<br />
be achieved by reducing fairness in the<br />
other sense (error rate balance), and vice<br />
versa. <strong>The</strong> price of any attempt to balance<br />
predictive parity or error rates is<br />
increased unfairness in the other direction.<br />
It’s like an especially high-stakes<br />
game of whack-a-mole.<br />
Since we know which defendants<br />
from the ProPublica sample actually<br />
went on to re-offend, we can also consider<br />
the problem in terms of how to<br />
fairly draw defendants <strong>with</strong> high risk<br />
scores from the pools of reoffenders<br />
and non-reoffenders. <strong>The</strong> figure “Risk<br />
Assignment” (facing page), which brings<br />
together the previous three figures, helps<br />
us visualize the problem. It shows how<br />
the “high-risk” assignments (a risk score<br />
of 5 or higher) are drawn out of the<br />
overall black and white populations. To<br />
simplify things, it imagines that each population has 100 defendants.<br />
When COMPAS labels defendants as “high-risk,” it will correctly<br />
draw many of them (colored in dark green) from the pools who will go<br />
on to re-offend. <strong>The</strong> figure shows that the share of “high-risk” defendants<br />
who are correctly pulled from the recidivists is about the same for blacks<br />
(63 percent) as for whites (59 percent). <strong>The</strong>se rates, again, are the test’s<br />
precision. So far, so good.<br />
14 ~ <strong>The</strong> <strong>New</strong> <strong>Atlantis</strong><br />
Copyright <strong>2018</strong>. All rights reserved. Print copies available at <strong>The</strong><strong>New</strong><strong>Atlantis</strong>.com/Back<strong>Issue</strong>s.