Sample-Chemical Distribution Market Report-2018 Edition
Over the recent years, the Chemical Distribution market is growing rapidly due growing consumption of chemicals around the world. Globally, the growth of Chemical Distribution market is driven by rising food and beverage consumption, pharmaceutical consumption along with rising disposable incomes. According to Azoth Analytics research report, “Global Chemical Distribution Market: Analysis By Type (Specialty and Commodity), By Region, By Country, Regulations: Opportunities and Forecasts (2018-2023)”, global market is projected to display a robust growth represented by a CAGR of 6.72% during 2018– 2023, chiefly driven by rising consumption of chemicals in industries such as pharmaceutical, food and beverage and personal care. The report titled “Global Chemical Distribution Market: Analysis By Type (Specialty and Commodity), By Region, By Country, Regulations: Opportunities and Forecasts (2018-2023)” has covered and analysed the potential of global chemical distribution market and provides statistics and information on market size, shares and growth factors. The report intends to provide cutting-edge market intelligence and help decision makers take sound investment evaluation. Besides, the report also identifies and analyses the emerging trends along with major drivers, challenges and opportunities in the global chemical distribution market. A comprehensive research report created through extensive primary research (inputs from industry experts, companies, stakeholders) and secondary research, the report aims to present the analysis of Global Chemical Distribution Market: Analysis By Type (Specialty and Commodity), By Region, By Country, By Region (Europe, Asia Pacific, North America, Latin America and Middle East and Africa) and By Country (Germany, France, Italy, China, Japan, India, U.S, Canada, Brazil and Mexico).
Over the recent years, the Chemical Distribution market is growing rapidly due growing consumption of chemicals around the world. Globally, the growth of Chemical Distribution market is driven by rising food and beverage consumption, pharmaceutical consumption along with rising disposable incomes.
According to Azoth Analytics research report, “Global Chemical Distribution Market: Analysis By Type (Specialty and Commodity), By Region, By Country, Regulations: Opportunities and Forecasts (2018-2023)”, global market is projected to display a robust growth represented by a CAGR of 6.72% during 2018– 2023, chiefly driven by rising consumption of chemicals in industries such as pharmaceutical, food and beverage and personal care.
The report titled “Global Chemical Distribution Market: Analysis By Type (Specialty and Commodity), By Region, By Country, Regulations: Opportunities and Forecasts (2018-2023)” has covered and analysed the potential of global chemical distribution market and provides statistics and information on market size, shares and growth factors. The report intends to provide cutting-edge market intelligence and help decision makers take sound investment evaluation. Besides, the report also identifies and analyses the emerging trends along with major drivers, challenges and opportunities in the global chemical distribution market.
A comprehensive research report created through extensive primary research (inputs from industry experts, companies, stakeholders) and secondary research, the report aims to present the analysis of Global Chemical Distribution Market: Analysis By Type (Specialty and Commodity), By Region, By Country, By Region (Europe, Asia Pacific, North America, Latin America and Middle East and Africa) and By Country (Germany, France, Italy, China, Japan, India, U.S, Canada, Brazil and Mexico).
You also want an ePaper? Increase the reach of your titles
YUMPU automatically turns print PDFs into web optimized ePapers that Google loves.
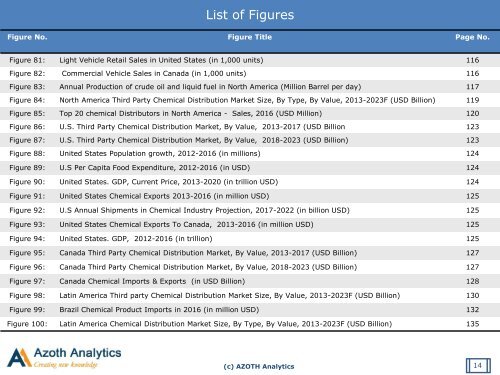
List of Figures<br />
Figure No. Figure Title Page No.<br />
Figure 81: Light Vehicle Retail Sales in United States (in 1,000 units) 116<br />
Figure 82: Commercial Vehicle Sales in Canada (in 1,000 units) 116<br />
Figure 83: Annual Production of crude oil and liquid fuel in North America (Million Barrel per day) 117<br />
Figure 84: North America Third Party <strong>Chemical</strong> <strong>Distribution</strong> <strong>Market</strong> Size, By Type, By Value, 2013-2023F (USD Billion) 119<br />
Figure 85: Top 20 chemical Distributors in North America - Sales, 2016 (USD Million) 120<br />
Figure 86: U.S. Third Party <strong>Chemical</strong> <strong>Distribution</strong> <strong>Market</strong>, By Value, 2013-2017 (USD Billion 123<br />
Figure 87: U.S. Third Party <strong>Chemical</strong> <strong>Distribution</strong> <strong>Market</strong>, By Value, <strong>2018</strong>-2023 (USD Billion) 123<br />
Figure 88: United States Population growth, 2012-2016 (in millions) 124<br />
Figure 89: U.S Per Capita Food Expenditure, 2012-2016 (in USD) 124<br />
Figure 90: United States. GDP, Current Price, 2013-2020 (in trillion USD) 124<br />
Figure 91: United States <strong>Chemical</strong> Exports 2013-2016 (in million USD) 125<br />
Figure 92: U.S Annual Shipments in <strong>Chemical</strong> Industry Projection, 2017-2022 (in billion USD) 125<br />
Figure 93: United States <strong>Chemical</strong> Exports To Canada, 2013-2016 (in million USD) 125<br />
Figure 94: United States. GDP, 2012-2016 (in trillion) 125<br />
Figure 95: Canada Third Party <strong>Chemical</strong> <strong>Distribution</strong> <strong>Market</strong>, By Value, 2013-2017 (USD Billion) 127<br />
Figure 96: Canada Third Party <strong>Chemical</strong> <strong>Distribution</strong> <strong>Market</strong>, By Value, <strong>2018</strong>-2023 (USD Billion) 127<br />
Figure 97: Canada <strong>Chemical</strong> Imports & Exports (in USD Billion) 128<br />
Figure 98: Latin America Third party <strong>Chemical</strong> <strong>Distribution</strong> <strong>Market</strong> Size, By Value, 2013-2023F (USD Billion) 130<br />
Figure 99: Brazil <strong>Chemical</strong> Product Imports in 2016 (in million USD) 132<br />
Figure 100: Latin America <strong>Chemical</strong> <strong>Distribution</strong> <strong>Market</strong> Size, By Type, By Value, 2013-2023F (USD Billion) 135<br />
(c) AZOTH Analytics<br />
14


