Sample-Global Thermal Insulation Material Market
The report titled “Global Thermal Insulation Materials Market (Glass Wool, Stone Wool, Expanded Polystyrene, Extruded Polystyrene, Polyurethane, Others): Analysis By End-Use, By Region, By Country (2018 Edition) – Forecast to 2023” has been segmented on the basis of Material Type - Glass Wool, Stone Wool, Expanded Polystyrene, Extruded Polystyrene, Polyurethane and Others), By Application (Building Construction, HVAC & Appliances, Industrial / Mechanical equipment, Automotive & Others), By Region (North America, Europe, Asia Pacific, ROW-Latin America, Middle East, Africa) and By Country (United States, Canada, Mexico, Germany, France, United Kingdom., Italy, China, South Korea, Japan).
The report titled “Global Thermal Insulation Materials Market (Glass Wool, Stone Wool, Expanded Polystyrene, Extruded Polystyrene, Polyurethane, Others): Analysis By End-Use, By Region, By Country (2018 Edition) – Forecast to 2023” has been segmented on the basis of Material Type - Glass Wool, Stone Wool, Expanded Polystyrene, Extruded Polystyrene, Polyurethane and Others), By Application (Building Construction, HVAC & Appliances, Industrial / Mechanical equipment, Automotive & Others), By Region (North America, Europe, Asia Pacific, ROW-Latin America, Middle East, Africa) and By Country (United States, Canada, Mexico, Germany, France, United Kingdom., Italy, China, South Korea, Japan).
Create successful ePaper yourself
Turn your PDF publications into a flip-book with our unique Google optimized e-Paper software.
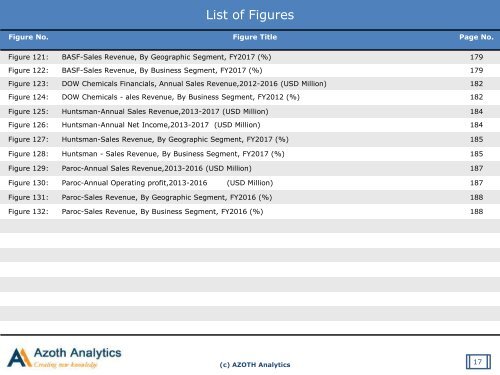
List of Figures<br />
Figure No. Figure Title Page No.<br />
Figure 121: BASF-Sales Revenue, By Geographic Segment, FY2017 (%) 179<br />
Figure 122: BASF-Sales Revenue, By Business Segment, FY2017 (%) 179<br />
Figure 123: DOW Chemicals Financials, Annual Sales Revenue,2012-2016 (USD Million) 182<br />
Figure 124: DOW Chemicals - ales Revenue, By Business Segment, FY2012 (%) 182<br />
Figure 125: Huntsman-Annual Sales Revenue,2013-2017 (USD Million) 184<br />
Figure 126: Huntsman-Annual Net Income,2013-2017 (USD Million) 184<br />
Figure 127: Huntsman-Sales Revenue, By Geographic Segment, FY2017 (%) 185<br />
Figure 128: Huntsman - Sales Revenue, By Business Segment, FY2017 (%) 185<br />
Figure 129: Paroc-Annual Sales Revenue,2013-2016 (USD Million) 187<br />
Figure 130: Paroc-Annual Operating profit,2013-2016 (USD Million) 187<br />
Figure 131: Paroc-Sales Revenue, By Geographic Segment, FY2016 (%) 188<br />
Figure 132: Paroc-Sales Revenue, By Business Segment, FY2016 (%) 188<br />
(c) AZOTH Analytics<br />
17


