THE SERIAL POSITION EFFECT OF FREE RECALL1
THE SERIAL POSITION EFFECT OF FREE RECALL1
THE SERIAL POSITION EFFECT OF FREE RECALL1

Create successful ePaper yourself
Turn your PDF publications into a flip-book with our unique Google optimized e-Paper software.
Journal of Experimental Psychology<br />
1962, Vol. 64, No. 5, 482-488<br />
<strong>THE</strong> <strong>SERIAL</strong> <strong>POSITION</strong> <strong>EFFECT</strong> <strong>OF</strong> <strong>FREE</strong> RECALL 1<br />
Recently Murdock (1960) has<br />
shown that in free recall RI, the total<br />
number of words recalled after one<br />
presentation, is a linear function of t,<br />
total presentation time. Nothing was<br />
said about the serial position effect,<br />
though this is a well-known phenomenon<br />
of free recall (e.g., Deese &<br />
Kaufman, 1957). However, given<br />
that there is a serial position effect,<br />
the simple linear relationship between<br />
RI and t is rather surprising.<br />
In the customary serial position<br />
curve of free recall, probability of<br />
recall is plotted as a function of serial<br />
position. This means, then, that the<br />
area under the serial position curve is<br />
equal to RI, the number of words<br />
recalled after one presentation. If Rj<br />
is a linear function of t then it must<br />
follow that the area under the serial<br />
position curve is also a linear function<br />
of t. However, it is not immediately<br />
apparent how the serial position curve<br />
varies with t in such a way as to<br />
maintain this simple linear relationship.<br />
The present experiment was designed<br />
as an attempt to determine<br />
how the serial position curve varied<br />
with list length and presentation rate<br />
while still maintaining this linear<br />
relationship. Unfortunately, at the<br />
end of the experiment it was still not<br />
clear how this relationship came about<br />
or, for that matter, whether the relationship<br />
was even linear after all.<br />
The basic reason for this failure was<br />
1 This study was supported by a research<br />
grant, M-3330, from the National Institutes<br />
of Health. The author would like to thank<br />
Ellen Lissner, Cynthia Marvin, and Frank<br />
Warhurst for analyzing the serial position<br />
data.<br />
BENNET B. MURDOCH, JR.<br />
University nf Vermont<br />
482<br />
that the trends which did show up<br />
were not consistent enough to justify<br />
any clear-cut conclusions. However,<br />
a rather definite picture of the serial<br />
position curve itself did emerge from<br />
the data. Therefore, the present<br />
article will be restricted to a quantitive<br />
description and attempted explanation<br />
of the serial position curve<br />
of free recall.<br />
PROCEDURE<br />
Six groups each had a different combination<br />
of list length and presentation rate.<br />
These six combinations were 10-2, 20-1, 15-2,<br />
30-1, 20-2, and 40-1; the first number indicates<br />
list length and the second number indicates<br />
presentation time (in sec.) per item. Thus,<br />
10-2 means a list of 10 words presented at<br />
a rate of 2 sec/item. Notice that the first<br />
two, middle two, and last two groups were<br />
matched for t, total presentation time (20,<br />
30, and 40 sec., respectively).<br />
For each group there were 80 different lists.<br />
The lists were constructed by randomly<br />
selecting words from the (approximately)<br />
4000 most common English words (Thorndike-Lorge,<br />
1944, G count of 20 and up),<br />
except that homonyms, contractions, and<br />
archaic words were excluded.<br />
Group testing was used. Lists were read<br />
to 5s either at every beat (presentation rate<br />
of 1 sec/item) or at every other beat (presentation<br />
rate of 2 sec/item) of an Electric<br />
metronome set at a rate of 60 beats/min.<br />
After each list there was a recall period of<br />
1.5 min. The 5s wrote down as many words,<br />
as they could remember in any order that<br />
they wished. Each recall period was terminated<br />
by a verbal "Ready" signal which<br />
preceded the start of the next list by 5-10 sec.<br />
All groups were given 20 lists per session and<br />
four sessions; successive sessions were spaced<br />
2-7 days apart. Nothing was said about<br />
rehearsing while the lists were being presented.<br />
In all there were 103 5s, students of both<br />
sexes from the introductory psychology course<br />
who were fulfilling a course requirement.<br />
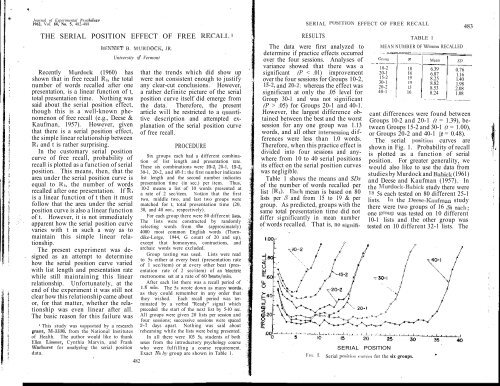
Exact Ns by group are shown in Table 1.<br />
<strong>SERIAL</strong> <strong>POSITION</strong> <strong>EFFECT</strong> <strong>OF</strong> <strong>FREE</strong> RECALL<br />
RESULTS<br />
The data were first analyzed to<br />
determine if practice effects occurred<br />
over the four sessions. Analyses of<br />
variance showed that there was a<br />
significant (P < .01) improvement<br />
over the four sessions for Groups 10-2,<br />
15-2, and 20-2; whereas the effect was<br />
significant at only the .05 level for<br />
Group 30-1 and was not significant<br />
(P > .05) for Groups 20-1 and 40-1.<br />
However, the largest difference obtained<br />
between the best and the worst<br />
session for any one group was 1.13<br />
words, and all other intersession differences<br />
were less than 1.0 words.<br />
Therefore, when this practice effect is<br />
divided into four sessions and anywhere<br />
from 10 to 40 serial positions<br />
its effect on the serial position curves<br />
was negligible.<br />
Table 1 shows the means and SDs<br />
of the number of words recalled per<br />
list (Ri). Rich mean is based on 80<br />
lists per ,5 and from 15 to 19 & per<br />
group. As predicted, groups with the<br />
same total presentation time did not<br />
differ significantly in mean number<br />
of words recalled. That is, no signifi-<br />
I.OOr<br />
TABLE 1<br />
MEAN NUMBER <strong>OF</strong> WORDS RECALLED<br />
Group<br />
10-2<br />
20-1<br />
15-2<br />
30-1<br />
20-2<br />
40-1<br />
<strong>SERIAL</strong> <strong>POSITION</strong><br />
18<br />
16<br />
19<br />
19<br />
1.5<br />
16<br />
FK;. 1. Serial position curves for the six groups.<br />
Mean<br />
6.39<br />
6.87<br />
8.25<br />
8.82<br />
8.53<br />
8.24<br />
SD<br />
0.76<br />
1.16<br />
1.40<br />
1.98<br />
2.08<br />
1.08<br />
483<br />
cant differences were found between<br />
Groups 10-2 and 20-1 (t = 1.39), between<br />
Groups 15-2 and 30-1 (t = 1.00),<br />
or Groups 20-2 and 40-1 (/ = 0.48).<br />
The serial position curves are<br />
shown in Fig. 1. Probability of recall<br />
is plotted as a function of serial<br />
position. For greater generality, we<br />
would also like to use the data from<br />
studies by Murdock and Babick (1961)<br />
and Deese and Kaufman (1957). In<br />
the Murdock-Babick study there were<br />
18 5s each tested on 80 different 25-1<br />
lists. Iii the Deese-Kaufman study<br />
there were two groups of 16 .5s each;<br />
one group was tested on 10 different<br />
10-1 lists and the other group was<br />
tested on 10 different 32-1 lists. The
484 BENNET B. MURDOCK, JR.<br />
serial position data were presented in<br />
the original article as Fig. 1 (p. 182)<br />
and we read the points from the two<br />
curves as accurately as possible.<br />
These three serial position curves are<br />
shown here as Fig. 2.<br />
We have, then, nine different serial<br />
position curves. In general, the<br />
curves seem to share certain general<br />
characteristics: a marked recency<br />
effect, a flat middle section, and a<br />
primary effect which is more precipitous<br />
though smaller in magnitude<br />
than the recency effect. The presence<br />
of a flat middle section, or asymptote,<br />
is clearest in the 40-1 list (Fig. 1), but<br />
becomes less and less obvious as list<br />
length decreases. Actually, in the two<br />
10-word lists the primacy and recency<br />
curves may have intersected each<br />
other before an asymptote has been<br />
reached.<br />
More specifically, the recency effect<br />
can adequately be described by the Gompertz<br />
double-exponential function. As<br />
given by Lewis (1960, p. 81) the equation<br />
is y = vg h *. Probability of nonrecall(y)<br />
was plotted as a function of list length<br />
minus serial position (x). Thus, the last<br />
word in a list would have an x value of 0,<br />
the next to last word an x value of 1, etc.<br />
Both v and g were fractional and positive.<br />
The asymptote v was determined from<br />
the mean recall probabilities averaged<br />
Group<br />
10-2<br />
20-1<br />
15-2<br />
.10-1<br />
20-2<br />
40-1<br />
25-l»<br />
10-l b<br />
32-1"<br />
<strong>SERIAL</strong> <strong>POSITION</strong><br />
FIG. 2. Serial position curves for 10-1<br />
and 32-1 lists (Deese & Kaufman, 1957) and<br />
25-1 lists (Murdock & Babick, 1961).<br />
over the flat part on each serial position<br />
curve. The constants g and h were obtained<br />
by a least squares method described<br />
by Lewis (1960, pp. 82-88) using<br />
the last eight points of each serial position<br />
curve (except of the two 10-word<br />
lists where only the last four or five<br />
points could be used).<br />
The evidence for this conclusion is<br />
shown in Table 2 under the r 1 column.<br />
In all cases the Gompertz equation<br />
accounted for more than. 95% of the<br />
variance, and the mean coefficient of<br />
determination (r 2 ) was 97.79%.<br />
Since in all nine cases g < l/e the<br />
recency effect is consistently an S shaped<br />
curve. This characteristic can be seen<br />
in the serial position curves of .Fig. 1 and<br />
2. Starting from the last serial position,<br />
each curve is initially positively decelerated<br />
and then soon becomes negatively<br />
decelerated.<br />
TABLE 2<br />
VALUES FOR GOMPERTZ DOUBLE-EXPONENTIAL FUNCTION TO KIT<br />
<strong>SERIAL</strong> <strong>POSITION</strong> CURVES IN <strong>FREE</strong> RECALL<br />
V<br />
.548<br />
.852<br />
.622<br />
.814<br />
.730<br />
.88.5<br />
.851<br />
.566<br />
.840<br />
«<br />
.100<br />
.050<br />
.026<br />
.032<br />
.048<br />
.036<br />
.134<br />
.206<br />
.270<br />
•From Murdock and Babick (1961).<br />
'From Deese and Kaufman (1957).<br />
yt<br />
.055<br />
.043<br />
.016<br />
.026<br />
.035<br />
.032<br />
.114<br />
.117<br />
.227<br />
h<br />
.574<br />
.596<br />
.518<br />
.546<br />
.552<br />
.557<br />
.634<br />
.431<br />
.644<br />
r'<br />
97.3%<br />
98.8%<br />
97.8%<br />
99.3%<br />
95.9%<br />
98.7%<br />
98.3%<br />
98.3%<br />
95.7%<br />
Xi<br />
1.5<br />
2.1<br />
2.0<br />
2.0<br />
1.9<br />
2.0<br />
1.5<br />
0.5<br />
0.6<br />
6.9<br />
7.9<br />
6.5<br />
7.0<br />
6.9<br />
7.1<br />
8.1<br />
4.1<br />
7.4<br />
<strong>SERIAL</strong> <strong>POSITION</strong> <strong>EFFECT</strong> <strong>OF</strong> <strong>FREE</strong> RECALL<br />
The yo column gives the value of y<br />
when x = 0. If y0 is subtracted from<br />
1.00 this gives the probability that the<br />
word in the last serial position will be<br />
correctly recalled. The results for the<br />
six groups of the present experiment \verc<br />
very similar to each other, and an<br />
analysis of variance of the number correctly<br />
recalled showed that the groups<br />
did not differ significantly (F = 1.61,<br />
df = 5/97, P > .05). The recall probabilities<br />
were rather high but they were<br />
not 1.00 (and had they been the Gompertz<br />
would not be applicable); the<br />
corresponding recall probabilities for the<br />
Murdock-Babick and Docse-Kaufman<br />
data were clearly lower.<br />
The inflection point occurs between<br />
the second and third words from the end<br />
of the list and appears to be essentially<br />
independent of list length and presentation<br />
rate. The evidence for this conclusion<br />
is given under the Xi column of<br />
Table 2, where .V; = —In ( — In g)/ln // (In<br />
is log base c). That is, ,v, is the inflection<br />
point, that x value at which the deceleration<br />
changes from positive to negative.<br />
The Xi values range from 0.5 words to 2.1<br />
words with a mean of 1.57 words. Since<br />
the last word in any list has an x value<br />
of 0, a mean of 1.57 words places the inflection<br />
point midway between the second<br />
and third words from the end of the list.<br />
Actually, both Dcese-Kaufman curves<br />
appear to have inflection points nearer<br />
the end of the list than any of the other<br />
curves. Otherwise, however, the inflection<br />
points cluster rather closely in the<br />
range of-1.5-2.1 words.<br />
-' The recency effect extends over the<br />
last eight serial positions and appears to<br />
be essentially independent of list length<br />
and presentation rate. The evidence for<br />
this conclusion is given under the .v.or,<br />
column, where x.tt is that value of x at<br />
which the curve is 95% down. That is,<br />
at this point forgetting is 95%, of the<br />
'asymptotic value. The 95% level serves<br />
as a convenient criterion to mark the<br />
end of the recency effect.<br />
The mean of the x.ts column is 6.88<br />
words or, rounded off to the nearest whole<br />
number, 7 words. Except for the Deese-<br />
Kaufman 10-1 list all the values seem to<br />
485<br />
lie very close to 7 words. Since the x<br />
value is 7 words, the recency effect extends<br />
over the last eight serial positions.<br />
Another way of indicating the similarity<br />
among different lists is by the /;.<br />
column of Table 2. In the Gompertz the<br />
constant h determines the rate of change.<br />
Since the values of h are all rather<br />
similar this indicates that all curves have<br />
a similar rate of change, and if they have<br />
a similar rate of change all curves should<br />
level out at about: the same x value if the<br />
numerical values of g do not differ too<br />
greatly.<br />
The primacy effect appears to extend<br />
over the first three or four serial positions.<br />
This can be seen in the serial<br />
position curves of Fig. 1 and 2, as all of<br />
the curves seem to level out at about the<br />
third or fourth serial position. The<br />
primacy effect is so short-lived that the<br />
curve is difficult to describe mathematically.<br />
Actually, it may well be<br />
exponential. Scmilog plots of the first<br />
three or four points of the nine curves<br />
(using 1.00 — was the asymptote for each<br />
curve) gave reasonable approximations<br />
to straight lines and the slopes were<br />
rather similar to one another. A group<br />
curve based on the mean (y~c) values of<br />
the individual curves was an excellent<br />
fit ; the rate constant was 0.77 and the<br />
intercept was .27 (sec Murdock & Cook,<br />
1960). 1 lowever, the fact that this group<br />
curve was based on only three points<br />
should make one hesitant about placing<br />
too much confidence in it.<br />
Finally, the primacy and recency effects<br />
arc spanned by a horizontal asymptote.<br />
The asymptote is considered to<br />
extend from Serial Position 5 up to the<br />
last eight serial positions. That is, in a<br />
20-word list the asymptote would extend<br />
from Serial Position 5 through Serial<br />
Position 12, in a 30-word list from Serial<br />
Position 5 through Serial Position 22, etc.<br />
That the asymptote is essentially horizontal<br />
is suggested by the middle parts<br />
of the serial position curves of Fig. 1<br />
and 2.<br />
A close examination of the serial<br />
position curves suggests that the<br />
Irend line may have a small positive
486 BENNET B. MURDOCK, JR.<br />
PREDICTED<br />
Group<br />
20-1<br />
30-1<br />
20-2<br />
40-1<br />
25-1<br />
32-1<br />
AX<br />
8<br />
18 8<br />
28<br />
13<br />
20<br />
TABLE 3<br />
^ND OBTAINED INCRKMKNTS<br />
VOR ASYMPTOTE<br />
\<br />
i<br />
\<br />
Pred.<br />
.039<br />
.022<br />
.019<br />
.027<br />
.044<br />
.032<br />
Obt.<br />
.100<br />
-.004<br />
.015<br />
.038<br />
.036<br />
.046<br />
Diff.<br />
.061<br />
-.026<br />
-.004<br />
.Oil<br />
-.008<br />
.014<br />
slope rather t than a zero slope How.<br />
ever this pos,togitive slope cou,d be due<br />
t0 , ncfeVthat the recency effect is<br />
only 95 /0 do,_QWn. ; e 5% of the efl[ect , 00 , 27 f<br />
7 s * 11 * l . 0 exert an effect on the<br />
(allegedly) horizontal asymptote.<br />
Ihe proper . tegt of thig condusion><br />
then, « to deaetermme whether the ob_<br />
tamed mcrei^^ (if ,my) ig greater<br />
than the incr>.rement attributable to the<br />
5% remaining from the recency effect_<br />
Ihe follovbwin aual is deals only<br />
with lists of )f 2Q wordg or more. the 10<br />
and 15 worc^j ,ists could not be uged<br />
because the ,iere were tOQ few pointg<br />
For each of |f the gk ,igts the obtained<br />
increment , wag found by fitti a<br />
least squareVes regreasion Hne to the<br />
asymptote, ^ determining its siopei then<br />
nmltiplymg^.the glope fay ^ where Ax.<br />
is the differ,l!rence between Serial Posi.<br />
tion 5 and tr!^he seventh-from-last serial<br />
position (A^ = 8for the 20.word ligti<br />
Ax - 13 I01,or the 25.Word list, etc.).<br />
1 he expectested ;ncrement was foimd by<br />
obtaining t\h& preclicted y value from<br />
•t-l-tf\ the I ^/-MTu-^/ii. • r i<br />
;z equation tor the two<br />
values of (Serial Position 5 and<br />
. -um-last serial position),<br />
then subtra ^j For each Hst the<br />
constants s^hown {n Tab)e 2 were uged<br />
Ihe prediQiicted and obtained incre.<br />
ments are ghown in TaWe 3; the<br />
difference tj between the predicted and<br />
obtained i:| increments was not sta.<br />
"pf.! 7Significant « = 0.72, d/ = 5).<br />
, t ie a! tasymptote does appear to be<br />
horizontal, and the slight positive<br />
slope to the curve is no greater than<br />
would be expected from the tail end<br />
of the recency effect.<br />
DISCUSSION<br />
We have presented data to show that<br />
the serial position curve of free recall is<br />
characterized by a rather steep (possibly<br />
exponential) primacy effect, an S shaped<br />
recency effect, and a horizontal asymptote<br />
extending between the primacy and<br />
recency effect. An idealized curve for a<br />
24-word list is shown in Fig. 3. Its equation<br />
is<br />
- .772 (M2)- M(L ~' )<br />
where L is list length and x is Serial<br />
Position 1, 2, 3, ... L. The constants<br />
for the primacy effect were those of the<br />
group curve discussed above while the<br />
constants for the asymptote and the<br />
recency effect were the mean values of<br />
the constants given in Table 2 for the six<br />
lists of the present experiment.<br />
The curve of Fig. 3 is an empirical<br />
curve, not a rational curve. It is an<br />
attempt to describe the serial position<br />
effect of free recall quantitatively, not<br />
explain it. Not only does this empirical<br />
curve represent the nine curves of Fig. 1<br />
and 2 quite well, but also it is consistent<br />
with several other sets of data. For<br />
one, it agrees with serial position curves<br />
for 20-1 lists reported by Deese (1957,<br />
g.80<br />
<strong>SERIAL</strong> <strong>POSITION</strong><br />
.80 < OUl<br />
(£<br />
Uot<br />
FIG. 3. Idealized serial position curve<br />
for 24-word list.<br />
<strong>SERIAL</strong> <strong>POSITION</strong> <strong>EFFECT</strong> <strong>OF</strong> <strong>FREE</strong> RECALL 487<br />
Fig. 1, p. 580). For another, it agrees<br />
well with some unpublished curves culled<br />
from several experiments recently reported<br />
by Murdock (1960). Finally, the<br />
exact same trends are present in some<br />
memory-span data reported by Waugh<br />
(I960, Fig. 3, p. 75).<br />
However, the empirical curve of Fig. 3<br />
is not in agreement with results reported<br />
by Bousfield, Whitmarsh, and Esterson<br />
(1958). These authors used S-, 10-, 20-,<br />
and 40-word lists all presented at a rate<br />
of 2.5 sec/word, and consistently found<br />
the primacy effect more marked than the<br />
recency effect. Both Bousfield et al.<br />
(1958, pp. 260-261) and Deese (1957, pp.<br />
581-582) suggest that the relatively slow<br />
presentation rate may have encouraged<br />
rehearsal and thus led to the greater<br />
primacy effect. To investigate this<br />
possibility, we conducted an additional<br />
experiment with 35 5s using 10 20-2.5<br />
lists. The 20-word length was selected<br />
because the curves of Bousfield el: al.<br />
(1958, Fig. 1, p. 258) seemed to show the<br />
most pronounced primacy effect for this<br />
length list. As Bousfield et al. (1958)<br />
apparently used a somewhat longer<br />
recall period we used a 4-min. recall<br />
period in this additional experiment;<br />
otherwise the procedure was identical<br />
with that of the other experiments reported<br />
here.<br />
The results of the experiment are<br />
shown in Fig. 4. As can be seen, in<br />
general the results are quite consistent<br />
with the empirical curve of Fig. 1, and in<br />
5 10 15<br />
<strong>SERIAL</strong> <strong>POSITION</strong><br />
-,1.00<br />
.Fin. 4. Serial position curve for 20-2.5 lists.<br />
particular the recency effect is more<br />
pronounced than the primacy effect.<br />
This experiment clearly shows that the<br />
results of Bousfield et al. (1958) are not<br />
due to the slower presentation rate<br />
per se.<br />
Why did Bousfield et al. (1958) find<br />
primacy more pronounced than recency?<br />
One possibility is their instructions.<br />
Twice in their instructions they told 5s<br />
that the words were to be recalled,<br />
". . . in the order in which they occur<br />
in your memory." The stress on order<br />
may have given 5s a set to recall the<br />
words in the order presented, and Deese<br />
(1957) has shown that instructions to 5s<br />
are an important variable in determining<br />
the shape of the curve. A second possibility<br />
is the design used. Bousfield et a!.<br />
(1958) used a counterbalanced design<br />
such that each 5 had only one list at each<br />
length. Thus, in effect each list was<br />
(to 5) of unknown length, and this fact<br />
may have encouraged rehearsal in the<br />
order of presentation.<br />
In any event, under the conditions of<br />
the present experiment there seems little<br />
doubt that the serial position effect of<br />
free recall is essentially as depicted in<br />
Fig. 3. Of course, as Deese (1957, p. 581)<br />
has noted, the serial position curve is<br />
sensitive to the introduction of experimental<br />
variables. However, it has been<br />
found that more items are recalled with<br />
free recall than with ordered recall<br />
(Dcesc, 1957; Waugh, 1961), so evidently<br />
free recall is the preferred, perhaps even<br />
the more basic, method of recalling a list<br />
of unrelated words.<br />
Finally, why does the serial position<br />
curve of free recall take the shape it<br />
does? One possible explanation is in<br />
terms of short-term proactive and retroactive<br />
inhibition. That is, each word<br />
in a list is both preceded by anywhere<br />
from 0 to (L — 1) other words and followed<br />
by anywhere from (L — 1) to 0<br />
other words. Up to a point, the more<br />
preceding words the more short-term PI<br />
and the more succeeding words the more<br />
short-term RI. The PI and RI effects<br />
presumably summate to determine the<br />
total inhibitory effects.<br />
If this explanation is correct, recent
488 BENNET B. MURDOCK, JR.<br />
studies of the short-term retention of<br />
individual items should provide an indication<br />
of the course of PI and RI to be<br />
expected. It has been found that, in<br />
short-term memory, PI effects appear to<br />
be greatest after about three prior words<br />
(Murdock, 1961). This agrees well with<br />
the finding that the primacy effect levels<br />
out after the first three or four serial<br />
positions. In short-term memory RI<br />
effects appear to approach an asymptotic<br />
value greater than zero (Murdock, 1961;<br />
Peterson & Peterson, 1959). This agrees<br />
well with the finding of a horizontal<br />
asymptote in the serial position curve.<br />
Finally, an examination of the RI curve<br />
of short-term memory even suggests an<br />
S shaped curve (see proportion of correct<br />
recalls over different retention intervals,<br />
Tabjes 1 and 3, Murdock, 1961, pp. 619-<br />
620). This agrees well with the Gompertz<br />
recency effect suggested here.<br />
Thus, it would appear that all the main<br />
characteristics of the idealized serial position<br />
curve shown in Fig. 3 are compatible<br />
with the results obtained from the shortterm<br />
retention of individual items, and<br />
these findings lend support to the idea<br />
that the serial position curve of free<br />
recall is essentially a manifestation of<br />
short-term PI and RI effects.<br />
SUMMARY<br />
This experiment, was a study of the serial<br />
position effect of free recall. Curves were<br />
obtained for 10-2, 20-1, 15-2, 30-1, 20-2, and<br />
40-1 lists, where the first, number indicates<br />
list length and the second number indicates<br />
presentation time per word. On the basis of<br />
the available evidence it was concluded that,<br />
under the conditions of the present experiment,<br />
the serial position curve is characterized<br />
by a steep, possible exponential, primacy<br />
effect extending over the first three or four<br />
words in the list, an S shaped recency effect<br />
extending over the last eight words in the list,<br />
r<br />
and a horizontal asymptote spanning the<br />
primacy and recency effect. Finally, it was<br />
suggested that the shape of the curve may<br />
well result from proactive and retroactive<br />
inhibition effects occurring within the list<br />
itself.<br />
REFERENCES<br />
BOUSFIELD, W. A., WHITMARSH, G. A., &<br />
ESTERSON, J. Serial position effects and<br />
the "Marbe effect" in the free recall of<br />
meaningful words. /. gen. Psychol., 19S8,<br />
59, 255-262.<br />
DEESE, J. Serial organization in the recall of<br />
disconnected items. Psychol. Rep., 1957, 3,<br />
577-582.<br />
DEESE, J., & KAUFMAN, R. A. Serial effects<br />
in recall of unorganized and sequentially<br />
organized verbal material. /. exp. Psychol.,<br />
1957, 54, 180-187.<br />
LHWIS, D. Quantitative methods in psychology.<br />
New York: McGraw-Hill, 1960.<br />
MURDOCK, B. B., JK. The immediate retention<br />
of unrelated words. /. exp. Psychol.,<br />
1960, 60, 222-234.<br />
MURDOCK, B. B., JR. The retention of<br />
individual items. /. exp. Psychol., 1961, 62,<br />
618-625.<br />
MURDOCH B. B., JR., & BAUICK, A. J. The<br />
effect of repetition on the retention of<br />
individual words. Atner. J. Psychol., 1961,<br />
74, 596-601.<br />
MURDOCK, B. B., JR., & COOK, C. D. On<br />
fitting the exponential. Psychol. Rep.,<br />
1960, 6, 63-69.<br />
PETERSON, L. R., & PETERSON, M. J. Shortterm<br />
retention of individual verbal items.<br />
J. exp. Psyrhol., 1959, 58, 193-198.<br />
THORNDIKK, E. L., & LORGE, I. The teacher's<br />
•word book of 30,000 words. New York:<br />
Teachers College, Columbia University,<br />
1944.<br />
WAUGH, N. C. Serial position and the<br />
memory-span. Amer. J. Psychol., 1960,<br />
73, 68-79.<br />
WAUGH, N. C. Kree versus serial recall.<br />
./. exp. Psychol., 1961, 62, 496-502.<br />
(Received October 6, 1961)<br />
Journal uf Experimental Psycftotogv<br />
1962, Vol. 64, No. S, 489-494<br />
<strong>THE</strong> SCALING OK SUBJECTIVE ROUGHNESS<br />
AND SMOOTHNESS '<br />
S. S. STEVENS AND JUDITH RICH HARRIS<br />
These experiments begun us an attempt<br />
to apply the method of magnitude<br />
estimation to a continuum for<br />
which the stimulus seemed to have no<br />
metric scale, only an ordinal scale of<br />
grades of sandpaper, or emery cloth.<br />
Unexpected discoveries led on to more<br />
engaging inquiries. At the outset,<br />
both a ratio scale and a category scale<br />
of apparent tactual roughness were<br />
determined with 12 grades (grits) of<br />
emery cloth. The relation between<br />
the ratio scale and the category scale<br />
was typical of the relation found on<br />
prothctic contimia. (For these first<br />
results, see Stevens, 1961a; for an<br />
earlier related study, see Duclelc cv<br />
Baker, 1956.)<br />
The next study was an exercise in which<br />
two students, C. S. Harris and J. P. McMahon,<br />
asked 12 (>s to judge the smoothness of<br />
the stimuli instead of the roughness. The<br />
ratio scale of smoothness approximated the<br />
inverse, or reciprocal, of the ratio scale found<br />
for roughness, and the category scale of<br />
smoothness was the reverse, or the complement,<br />
of the category scale of roughness.<br />
These results resemble Torgerson's (1960)<br />
findings when he scaled both the apparent<br />
lightness- and the apparent darkness of gray<br />
papers.<br />
In terms of a linear scale of apparent<br />
roughness, it turned out that the stimuli used<br />
were bunched rather tightly at the low<br />
Nnooth) end of the continuum, so much so<br />
that the two category scales were almost<br />
logarithmic functions of the respective ratio<br />
scales. Other studies of category scaling<br />
suggest that the nearly logarithmic form<br />
found here is an accident of the stimulus spacing,<br />
and that if an iterative procedure were<br />
used to arrive at a "pure" category scale the<br />
curve for roughness would be less curved than<br />
'This research was supported by Grant<br />
G-10716 from the National Science Foundation<br />
(Report PAR-266).<br />
Harvard University<br />
a logarithmic function (Stevens & Gaianter,<br />
1957).<br />
Since the available number of emery cloth<br />
grits is limited, it is difficult to determine a<br />
pure category scale, but when a sample of<br />
grits more uniformly spaced in subjective<br />
roughness was used, the form of the category<br />
scale changed as predicted: it became much<br />
loss curved than a logarithmic function when<br />
plotted against, the ratio scale of subjective<br />
roughness. Ten Os judged grits 320, 120,<br />
80, 50, 40, 30, and 24 twice each on a sevenpoint<br />
scale. The average judgments were<br />
1.17, 2.17, 3.04, 4.12, 5.17, 6.08, and 6.62.<br />
These values determine a line that is straighter<br />
than a logarithmic function—a line that is not<br />
far from the pure form of the category scale,<br />
as evidenced by the tendency of Os to use each<br />
category number approximately equally often<br />
(Stevens & Gaianter, 1957). It appears,<br />
therefore, that: roughness behaves like a<br />
prothetic continuum, and that the pure<br />
category scale is not a logarithmic function<br />
of the magnitude scale (Eisler, 1962).<br />
I'Yom these preliminary studies a<br />
surprising fact emerged: magnitude<br />
estimations of roughness, and of<br />
smoothness, turned out to give fairly<br />
straight lines when plotted in log-log<br />
coordinates against the grit number of<br />
the emery cloths. Another instance,<br />
it seems, of the psychophysical power<br />
law. (Grit number refers to the<br />
number of openings per inch in the<br />
screen employed to sift the abrasive<br />
particles.) I f apparent roughness and<br />
its reciprocal, apparent smoothness,<br />
are power functions of particle size, it<br />
becomes a challenging task to determine<br />
more accurately the exponents<br />
involved. In the preliminary experiments,<br />
each involving 12 Os, the<br />
approximate exponents were — 1.5 for<br />
roughness and +1.2 for smoothness<br />
when measured against grit number.<br />
The next problem was to determine<br />
489