Marine Ecosystems Services and Human Health
Marine Ecosystems Services and Human Health
Marine Ecosystems Services and Human Health

Create successful ePaper yourself
Turn your PDF publications into a flip-book with our unique Google optimized e-Paper software.
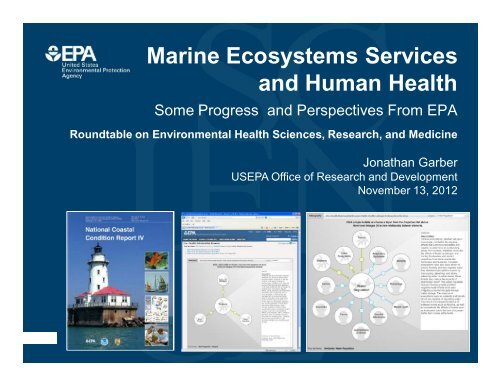
<strong>Marine</strong> <strong>Ecosystems</strong> <strong>Services</strong><br />
<strong>and</strong> <strong>Human</strong> <strong>Health</strong><br />
Some Progress <strong>and</strong> Perspectives From EPA<br />
Roundtable on Environmental <strong>Health</strong> Sciences, Research, <strong>and</strong> Medicine<br />
Jonathan Garber<br />
USEPA Office of Research <strong>and</strong> Development<br />
November 13, 2012
<strong>Marine</strong> <strong>Ecosystems</strong> <strong>Services</strong> <strong>and</strong> <strong>Human</strong> <strong>Health</strong><br />
*Some Progress <strong>and</strong> Perspectives From EPA<br />
•Enhancing <strong>and</strong> protecting ecosystems <strong>and</strong> human<br />
health are explicitly central to EPA’s mission<br />
•Supported by regulatory <strong>and</strong> science arms of the<br />
agency<br />
•Eco-<strong>Health</strong> connections areas of continuing <strong>and</strong><br />
increasing focus <strong>and</strong> investment<br />
1 (* With all the usual disclaimers…)
2<br />
Statutory Authorities for EPA’s Coastal <strong>and</strong> <strong>Marine</strong> Programs<br />
•Clean Water Act (CWA)<br />
•the management of the National Estuary (CWA, section 320)<br />
•312(o) / 301(h) / 403 (c): the authority for regulating discharges<br />
from recreational vessels<br />
•<strong>Marine</strong> Protection Research <strong>and</strong> Sanctuaries Act (MPRSA)<br />
•the control of dumping of dredged material (<strong>and</strong> other<br />
materials) into ocean waters under section 103 of MPRSA<br />
•Ocean Dumping Ban Act<br />
•Shore Protection Act<br />
•<strong>Marine</strong> Plastic Pollution Research <strong>and</strong> Control Act<br />
•Title XIV: "Certain Alaskan Cruise Ship Operations"<br />
•Executive Orders<br />
•Clean Air, Superfund, <strong>and</strong> other contaminant-related statutes
Modified DPSR-Like Decision Framework for Optimizing Management Decisions<br />
That Affect Production of Coastal <strong>Marine</strong> <strong>and</strong> Ocean Ecosystem <strong>Services</strong><br />
Stressors<br />
On <strong>Marine</strong> Systems<br />
•Temperature rise<br />
•Acidification<br />
•Eutrophication<br />
•Contaminants<br />
•HABs<br />
•Habitat loss<br />
•….etc<br />
Management<br />
Decisions <strong>and</strong> Points<br />
Of Intervention<br />
Harvest<br />
The Question:<br />
How do we<br />
optimize the<br />
interventions to<br />
maximize<br />
production of<br />
services?<br />
Dredging<br />
Zoning<br />
Protected<br />
areas<br />
Water Quality<br />
…many<br />
others<br />
Production of<br />
Ecosystem <strong>Services</strong><br />
Seafood<br />
Production<br />
Transportation<br />
Storm<br />
Protection<br />
Pharmaceuticals<br />
Recreation<br />
…etc.<br />
Desired<br />
Outcome<br />
<strong>Human</strong><br />
Well<br />
Being
4<br />
Making the Connections<br />
Critical Path For Connecting Eco- <strong>Services</strong> to <strong>Human</strong> <strong>Health</strong> Outcomes<br />
1. Establish inventories of baseline<br />
eco <strong>and</strong> health conditions<br />
2. Translate conditions to quantifiable<br />
services<br />
3. Link services to human health<br />
outcomes<br />
4. Model <strong>and</strong> predict impacts of<br />
interventions <strong>and</strong> feedbacks<br />
Progress<br />
Scorecard
Making the Connections: Some Examples<br />
National Coastal<br />
Condition<br />
Assessments<br />
Stressors<br />
On <strong>Marine</strong> Systems<br />
•Temperature rise<br />
•Acidification<br />
•Eutrophication<br />
•Contaminants<br />
•HABs<br />
•Habitat loss<br />
•….etc<br />
Management<br />
Decisions <strong>and</strong> Points<br />
Of Intervention<br />
Harvest<br />
The Question:<br />
How do we<br />
optimize the<br />
interventions to<br />
maximize<br />
production of<br />
services?<br />
Dredging<br />
Zoning<br />
Protected<br />
areas<br />
Water Quality<br />
…many<br />
others<br />
Production of<br />
Ecosystem <strong>Services</strong><br />
Seafood<br />
Production<br />
Transportation<br />
Storm<br />
Protection<br />
Pharmaceuticals<br />
Recreation<br />
…etc.<br />
Eco <strong>Services</strong><br />
Atlas<br />
Eco-<strong>Health</strong><br />
Browser<br />
Desired<br />
Outcome<br />
<strong>Human</strong><br />
Well<br />
Being
6<br />
Establishing Conditions<br />
National Coastal Assessments (2000-06)<br />
•Created an integrated comprehensive coastal<br />
monitoring program across all US coastal states to<br />
assess the condition of estuaries at multiple scales<br />
(state, regional, national).<br />
•Transferred this technology to the states, tribes, EPA<br />
Regions, EPA Office of Water <strong>and</strong> others<br />
•to assist the States in meeting CWA§305(b) objectives <strong>and</strong><br />
•to enhance EPA’s ability to make scientifically sound<br />
assessments of the condition of U.S. coastal waters.<br />
•National Coastal Condition Assessment (2010) – part of<br />
OW’s National Aquatic Resources Surveys (NARS)
7<br />
National Coastal Condition Reports<br />
• NCCR I (2001) - EMAP Data from 1990 - 1996<br />
• NCCR II (2005) – NCA Data from 1997 – 2000<br />
• NEP NCCR (2007) – NCA-NEP Data from 1997-2003<br />
• NCCR III (2008) – NCA Data from 2001 to 2002 <strong>and</strong> trends<br />
• NCCR IV (2011) – NCA Data from 2003-2006 <strong>and</strong> trends<br />
• NCCR V (2013) – NCCA Data from 2010
8<br />
NCCR IV Partners<br />
•EPA – ORD<br />
•EPA – OW<br />
•NOAA – NOS<br />
•NOAA – NMFS<br />
•US FWS<br />
•Coastal States
9<br />
Data Contained in the NCCR IV<br />
Describing Coastal Condition<br />
• Coastal Monitoring Data – NCA, FWS’s National<br />
WetI<strong>and</strong>sInventory, Great Lakes Data<br />
Supplemental Information<br />
• Offshore Fisheries Data –NOAA NMFS<br />
• Coastal Ocean Data –NOAA NCCOS<br />
• Assessment <strong>and</strong> Advisory Data –EPA OST Fish<br />
Consumption Advisories <strong>and</strong> Beach Closures
10<br />
What’s New in NCCR IV<br />
• Includes NCA data from 3,144 sites sampled<br />
between 2003-2006 <strong>and</strong> trends from 2000-2006<br />
• Includes SE Alaska, the U.S. Virgin Isl<strong>and</strong>s, Guam,<br />
<strong>and</strong> American Samoa, for the first time<br />
• Coastal fisheries data for top commercial species<br />
• Coastal ocean condition data for Mid-Atlantic Bight,<br />
South Atlantic Bight, <strong>and</strong> the West Coast
11<br />
Indicators of Coastal Condition<br />
Water Quality Index:<br />
• Water Clarity, DO, Chlorophyll a, DIN, DIP<br />
Benthic Index:<br />
• Community Diversity, Pollution<br />
Tolerant/Sensitive Species<br />
Sediment Quality Index:<br />
• Toxicity, Contaminants, TOC<br />
Fish Tissue Contaminant Index:<br />
• Whole-Fish Contaminant Burden<br />
Coastal Habitat Index:<br />
• FWS National Wetl<strong>and</strong>s Inventory Wetl<strong>and</strong>s<br />
Loss Rates
Overall condition for U.S.<br />
coastal waters is rated fair.<br />
•Poorest conditions:<br />
-coastal habitat<br />
-sediment quality<br />
-benthic condition<br />
•Best conditions:<br />
-fish tissue<br />
contaminants<br />
-DO <strong>and</strong> DIN of water<br />
quality index<br />
12<br />
NCCR IV Overall Condition
13<br />
Regional Water Quality Condition
14<br />
Coastal Ocean Condition
15<br />
Offshore Fisheries
16<br />
Fish Consumption Advisories
Making the Connections: Some Examples<br />
National Coastal<br />
Condition<br />
Assessments<br />
Stressors<br />
On <strong>Marine</strong> Systems<br />
•Temperature rise<br />
•Acidification<br />
•Eutrophication<br />
•Contaminants<br />
•HABs<br />
•Habitat loss<br />
•….etc<br />
Management<br />
Decisions <strong>and</strong> Points<br />
Of Intervention<br />
Harvest<br />
The Question:<br />
How do we<br />
optimize the<br />
interventions to<br />
maximize<br />
production of<br />
services?<br />
Dredging<br />
Zoning<br />
Protected<br />
areas<br />
Water Quality<br />
…many<br />
others<br />
Production of<br />
Ecosystem <strong>Services</strong><br />
Seafood<br />
Production<br />
Transportation<br />
Storm<br />
Protection<br />
Pharmaceuticals<br />
Recreation<br />
…etc.<br />
National<br />
<strong>Services</strong><br />
Atlas<br />
Eco-<strong>Health</strong><br />
Browser<br />
Desired<br />
Outcome<br />
<strong>Human</strong><br />
Well<br />
Being
18<br />
EPA’s National Atlas For Sustainability<br />
•web-based, easy-to-use, mapping application to view <strong>and</strong> analyze<br />
multiple ecosystem services in a specific region.<br />
•visual method for interpreting ecosystem services <strong>and</strong> underst<strong>and</strong>ing<br />
how they can be conserved <strong>and</strong> enhanced for a sustainable future.<br />
•Allows users to assess<br />
•Clean <strong>and</strong> adequate water for drinking <strong>and</strong> domestic use<br />
•Clean water for recreation <strong>and</strong> aquatic habitat<br />
•Food, fuel <strong>and</strong> fiber<br />
•Recreation, cultural <strong>and</strong> aesthetic amenities<br />
•Climate regulation (e.g. carbon storage to off-set greenhouse gases)<br />
•Protection from hazardous weather<br />
•Habitat <strong>and</strong> the maintenance of biodiversity<br />
•Clean air<br />
•Goes live on EPA’s public website in 2013
Decision<br />
Alternative<br />
Δ Exposure to<br />
Stressors<br />
Δ <strong>Ecosystems</strong><br />
Δ Ecological<br />
Functions<br />
Δ Ecosystem<br />
<strong>Services</strong><br />
Δ <strong>Human</strong><br />
Well Well-being being<br />
EnviroAtlasScience Questions<br />
• How can we effectively quantify <strong>and</strong> communicate the<br />
productionof the goods <strong>and</strong> services we receive from<br />
ecosystems?<br />
• What is the supply of those services in relationship to the<br />
dem<strong>and</strong> <strong>and</strong> future dem<strong>and</strong>?<br />
• How do drivers of ecosystem services such as l<strong>and</strong> use<br />
change (e.g., road development), climate change, <strong>and</strong><br />
pollutant loads impact the delivery of ecosystem services?<br />
• At a screening level, where does it make sense to invest or<br />
prioritize l<strong>and</strong>/water protection, restoration, conservation, or<br />
use?<br />
• If we invest in green space, can we reduce the costs of grey<br />
infrastructure while also gaining other co-benefits?<br />
• How can we promote the incorporation of this type of<br />
information into decision-making?<br />
• How can we demonstrate how these services explicitly relate<br />
to human health <strong>and</strong> well-being?
Making the Connections: Some Examples<br />
National Coastal<br />
Condition<br />
Assessments<br />
Stressors<br />
On <strong>Marine</strong> Systems<br />
•Temperature rise<br />
•Acidification<br />
•Eutrophication<br />
•Contaminants<br />
•HABs<br />
•Habitat loss<br />
•….etc<br />
Management<br />
Decisions <strong>and</strong> Points<br />
Of Intervention<br />
Harvest<br />
The Question:<br />
How do we<br />
optimize the<br />
interventions to<br />
maximize<br />
production of<br />
services?<br />
Dredging<br />
Zoning<br />
Protected<br />
areas<br />
Water Quality<br />
…many<br />
others<br />
Production of<br />
Ecosystem <strong>Services</strong><br />
Seafood<br />
Production<br />
Transportation<br />
Storm<br />
Protection<br />
Pharmaceuticals<br />
Recreation<br />
…etc.<br />
National<br />
<strong>Services</strong><br />
Atlas<br />
Eco-<strong>Health</strong><br />
Browser<br />
Desired<br />
Outcome<br />
<strong>Human</strong><br />
Well<br />
Being
Office of Research <strong>and</strong> Development<br />
National <strong>Health</strong> <strong>and</strong> Environmental Effects Research Laboratory<br />
http://www.epa.gov/research/healthscience/browser/introduction.html<br />
Photo image area measures 2” H x 6.93” W <strong>and</strong> can be masked by a<br />
collage strip of one, two or three images.<br />
The photo image area is located 3.19” from left <strong>and</strong> 3.81” from top of page.<br />
Each image used in collage should be reduced or cropped to a maximum of<br />
2” high, stroked with a 1.5 pt white frame <strong>and</strong> positioned edge-to-edge with<br />
accompanying images.
25<br />
Making the Connections:<br />
Critical Path For Linking Eco- <strong>Services</strong> to <strong>Human</strong> <strong>Health</strong><br />
Outcomes<br />
1. Establish inventories of baseline<br />
eco <strong>and</strong> health conditions<br />
2. Translate conditions to quantifiable<br />
services<br />
3. Link services to human health<br />
outcomes<br />
4. Predict impacts of interventions <strong>and</strong><br />
feedbacks<br />
Progress Scorecard<br />
•Pretty good<br />
•Making progress<br />
•Needs work (a lot)<br />
•Ditto
Questions?<br />
Stressors<br />
On <strong>Marine</strong> Systems<br />
•Temperature rise<br />
•Acidification<br />
•Eutrophication<br />
•Contaminants<br />
•HABs<br />
•Habitat loss<br />
•….etc<br />
Management<br />
Decisions <strong>and</strong> Points<br />
Of Intervention<br />
Harvest<br />
The Question:<br />
How do we<br />
optimize the<br />
interventions to<br />
maximize<br />
production of<br />
services?<br />
Dredging<br />
Zoning<br />
Protected<br />
areas<br />
Water Quality<br />
…many<br />
others<br />
Production of<br />
Ecosystem <strong>Services</strong><br />
Seafood<br />
Production<br />
Transportation<br />
Storm<br />
Protection<br />
Pharmaceuticals<br />
Recreation<br />
…etc.<br />
Desired<br />
Outcome<br />
<strong>Human</strong><br />
Well<br />
Being


![Barry Davis Presentation.ppt [Read-Only] - Institute of Medicine](https://img.yumpu.com/31160415/1/190x146/barry-davis-presentationppt-read-only-institute-of-medicine.jpg?quality=85)
![Diekema.ppt [Compatibility Mode] - Institute of Medicine](https://img.yumpu.com/5085552/1/190x146/diekemappt-compatibility-mode-institute-of-medicine.jpg?quality=85)