

wire

You also want an ePaper? Increase the reach of your titles
YUMPU automatically turns print PDFs into web optimized ePapers that Google loves.
20<br />
Parking Availability – Use Cases<br />
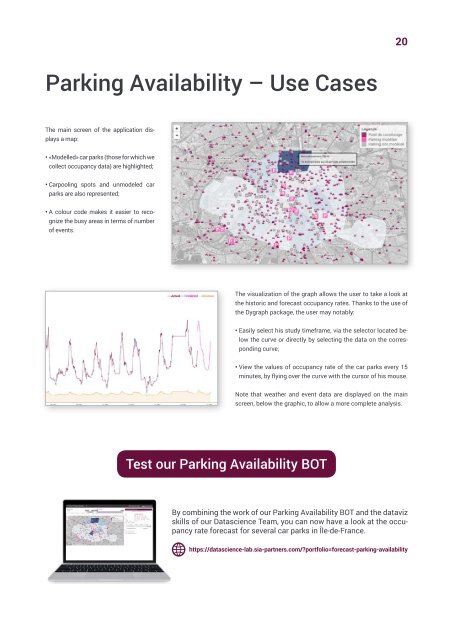
The main screen of the application displays<br />
a map:<br />
• «Modelled» car parks (those for which we<br />
collect occupancy data) are highlighted;<br />
• Carpooling spots and unmodeled car<br />
parks are also represented;<br />
• A colour code makes it easier to recognize<br />
the busy areas in terms of number<br />
of events.<br />
The visualization of the graph allows the user to take a look at<br />
the historic and forecast occupancy rates. Thanks to the use of<br />
the Dygraph package, the user may notably:<br />
• Easily select his study timeframe, via the selector located below<br />
the curve or directly by selecting the data on the corresponding<br />
curve;<br />
• View the values of occupancy rate of the car parks every 15<br />
minutes, by flying over the curve with the cursor of his mouse.<br />
Note that weather and event data are displayed on the main<br />
screen, below the graphic, to allow a more complete analysis.<br />
Test our Parking Availability BOT<br />
By combining the work of our Parking Availability BOT and the dataviz<br />
skills of our Datascience Team, you can now have a look at the occupancy<br />
rate forecast for several car parks in Île-de-France.<br />
https://datascience-lab.sia-partners.com/?portfolio=forecast-parking-availability