

2018 EB (Munis) Survey Graphic Report

You also want an ePaper? Increase the reach of your titles
YUMPU automatically turns print PDFs into web optimized ePapers that Google loves.
Section 1<br />
Current Medical Programs (continued)<br />
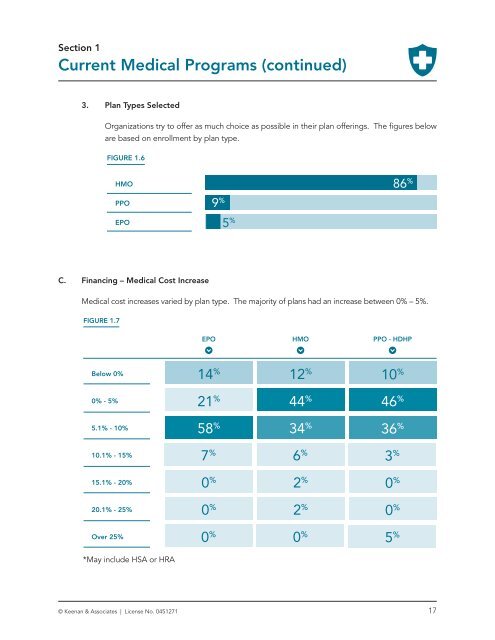
3. Plan Types Selected<br />
Organizations try to offer as much choice as possible in their plan offerings. The figures below<br />
are based on enrollment by plan type.<br />
FIGURE 1.6<br />
HMO<br />
PPO<br />
EPO<br />
9 %<br />
5 %<br />
86 %<br />
C. Financing – Medical Cost Increase<br />
Medical cost increases varied by plan type. The majority of plans had an increase between 0% – 5%.<br />
FIGURE 1.7<br />
Below 0%<br />
0% - 5%<br />
5.1% - 10%<br />
10.1% - 15%<br />
15.1% - 20%<br />
PPO - HDHP<br />
EPO<br />
HMO<br />
58 % 34 % 36 %<br />
14 % 12 % 10 %<br />
21 % 44 %<br />
7 %<br />
6 %<br />
3 %<br />
0 % 2 %<br />
2 % 46 %<br />
0 %<br />
20.1% - 25%<br />
0 % 0 % 0 %<br />
Over 25%<br />
*May include HSA or HRA<br />
0 %<br />
5 %<br />
© Keenan & Associates | License No. 0451271 17