Hydrometeorology Testbed (HMT) Program - NOAA ...
Hydrometeorology Testbed (HMT) Program - NOAA ...
Hydrometeorology Testbed (HMT) Program - NOAA ...

Create successful ePaper yourself
Turn your PDF publications into a flip-book with our unique Google optimized e-Paper software.
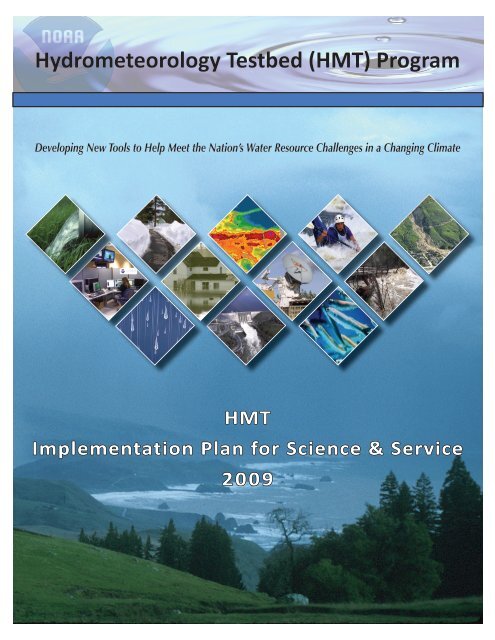
<strong>Hydrometeorology</strong> <strong>Testbed</strong> (<strong>HMT</strong>) <strong>Program</strong><br />
Developing New Tools to Help Meet the Nation’s Water Resource Challenges in a Changing Climate<br />
<strong>HMT</strong><br />
Implementation Plan for Science & Service<br />
2009
<strong>NOAA</strong>’s <strong>Hydrometeorology</strong> <strong>Testbed</strong> (<strong>HMT</strong>) <strong>Program</strong><br />
Developing New Tools to Help Meet the Nation’s<br />
Water Resource Challenges in a Changing Climate<br />
Accelerating Hydrometeorological Research and Development and<br />
The Infusion of Research & Technology Into Forecasting Operations<br />
Implementation Plan for <strong>HMT</strong> Science & Services<br />
This document comprises the <strong>HMT</strong> Science Plan: it describes the who, what, why, and<br />
where of <strong>HMT</strong>, and how this national program conducts research and development to<br />
improve services through regional implementation. It is a living document, to be updated<br />
annually.<br />
Gary M. Carter<br />
Director, Office of Hydrologic Development<br />
<strong>NOAA</strong> National Weather Service<br />
Integrated Water Forecasting <strong>Program</strong> Manager<br />
Updated: November 18, 2009<br />
Approval<br />
Date Date<br />
F. Martin Ralph<br />
Chief, ESRL/PSD Water Cycle Branch<br />
<strong>NOAA</strong> Office of Oceanic & Atmospheric Research<br />
Science, Technology, & Infusion <strong>Program</strong> Manager
Steve Albers, <strong>NOAA</strong>/OAR/ESRL<br />
Ed Berry, <strong>NOAA</strong>/NWS/WFO-DDC<br />
Faye Barthold, <strong>NOAA</strong>/NCEP<br />
Dan Birkenheuer <strong>NOAA</strong>/OAR/ESRL<br />
Mike Bodner, <strong>NOAA</strong>/NCEP<br />
Barbara Brown, NCAR/DTC<br />
Wallace Clark, STC & <strong>NOAA</strong>/OAR/ESRL<br />
Don Cline, <strong>NOAA</strong>/NWS/OCWWS<br />
Tom Filiaggi, <strong>NOAA</strong>/NWS/OST<br />
Dan Gottas, <strong>NOAA</strong>/OAR/ESRL<br />
Tom Hamill, <strong>NOAA</strong>/OAR/ESRL<br />
Rob Hartman, <strong>NOAA</strong>/NWS/CNRFC<br />
Art Henkel <strong>NOAA</strong>/NWS/CNRFC<br />
Kenneth Howard, <strong>NOAA</strong>/OAR/NSSL<br />
Contributors<br />
<strong>HMT</strong> Project Manager<br />
Timothy Schneider, <strong>NOAA</strong>/OAR/ESRL<br />
Technical Coordination<br />
Lynn E. Johnson, University of Colorado Denver<br />
Christopher R. Williams, CIRES/University of Colorado<br />
Isidora Jankov, CSU/CIRA & <strong>NOAA</strong>/OAR/ESRL<br />
Tara Jensen, NCAR/DTC<br />
Dave Jorgensen, <strong>NOAA</strong>/OAR/NSSL<br />
John Juskie, <strong>NOAA</strong>/NWS<br />
Clark King, <strong>NOAA</strong>/OAR/ESRL<br />
David Kingsmill, CU/CIRES & <strong>NOAA</strong>/OAR/ESRL<br />
David Kitzmiller, <strong>NOAA</strong>/NWS/OHD<br />
Sergey Matrosov, CU/CIRES & <strong>NOAA</strong>/OAR/ESRL<br />
Layout/Design & Technical Editing<br />
Barb DeLuisi & Ann Reiser, <strong>NOAA</strong>/OAR/ESRL<br />
Additional Contributors<br />
Patty Miller, <strong>NOAA</strong>/OAR/ESRL<br />
Brian Motta, <strong>NOAA</strong>/NWS/OCWWS<br />
Paul Neiman, <strong>NOAA</strong>/OAR/ESRL<br />
Mel Nordquist , <strong>NOAA</strong>/NWS/WFO-EKA<br />
Scott O’Donnell, <strong>NOAA</strong>/NWS/OST<br />
Pedro Restrepo, <strong>NOAA</strong>/NWS/OHD<br />
Dave Reynolds, <strong>NOAA</strong>/NWS/WFO-MTR<br />
Woody Roberts, <strong>NOAA</strong>/OAR/ESRL<br />
Paul Schultz, <strong>NOAA</strong>/OAR/ESRL<br />
Dong-Jun Seo, <strong>NOAA</strong>/NWS/OHD<br />
Mike Smith <strong>NOAA</strong>/NWS/OHD<br />
Stephan Smith, <strong>NOAA</strong>/NWS/OST<br />
Ellen Sukovich, CU/CIRES & <strong>NOAA</strong>/OAR/ESRL<br />
Ed Tollerud, <strong>NOAA</strong>/OAR/ESRL<br />
Zoltan Toth, <strong>NOAA</strong>/OAR/ ESRL<br />
Ernie Wells, <strong>NOAA</strong>/NWS/OCWWS<br />
Allen B. White <strong>NOAA</strong>/OAR/ESRL<br />
Klaus Weickmann, <strong>NOAA</strong>/OAR/ESRL<br />
Jeff Whitaker, <strong>NOAA</strong>/OAR/ESRL<br />
Huiling Yuan, NOA/OAR/ESRL<br />
Bob Zamora <strong>NOAA</strong>/OAR/ESRL<br />
Cover photo credits: Background Image–Paul Neiman, CIRES; Irrigation–Tim McCabe, NRCS; Monterey Forecast Office–<br />
<strong>NOAA</strong>; Snowy Road–Clark King, <strong>NOAA</strong>; Folsom Dam–CA DWR; Anchovies–<strong>NOAA</strong>, Horse Bridge Flood– Kris Merideth, NPS;<br />
La Conchita Landslide–Mark Reid, USGS.
<strong>HMT</strong> Science & Services Implementation Plan Table of Contents<br />
Table of Contents<br />
Executive Summary ......................................................................................................................................................... i<br />
1 Introduction ............................................................................................................................................................... 1<br />
1.1 <strong>HMT</strong>’s Drivers: <strong>NOAA</strong>’s Strategic Goals and Mission Requirements .................................................................... 1<br />
1.2 <strong>NOAA</strong> and the Nation’s Water Resources ............................................................................................................ 5<br />
1.3 <strong>NOAA</strong>’s Water Guidance and Calls to Action ...................................................................................................... 6<br />
1.3.1 NRC Report: Flash Flood Forecasting over Complex Terrain ....................................................................... 7<br />
1.3.2 NRC Report: <strong>NOAA</strong> and the Global Precipitation Measurement (GPM) Mission ........................................ 8<br />
1.3.3 NRC Report: Observing Weather and Climate from the Ground Up: A Nationwide Network of Networks..8<br />
1.3.4 AMS Call to Action .................................................................................................................................... 8<br />
1.4 <strong>HMT</strong> History ....................................................................................................................................................... 8<br />
1.5 <strong>HMT</strong> Accomplishments ..................................................................................................................................... 10<br />
1.5.1 Scientific & Technical Accomplishments .................................................................................................. 11<br />
1.5.2 Transition to Operations & Training .......................................................................................................... 12<br />
1.5.3 <strong>Program</strong>matic & Organizational Accomplishments .................................................................................. 13<br />
1.6 Lessons Learned from <strong>HMT</strong>-West ...................................................................................................................... 14<br />
2 <strong>HMT</strong> Science Plan & Management ............................................................................................................................ 15<br />
2.1 Goals and Objectives ........................................................................................................................................ 15<br />
2.1.1 Goals ...................................................................................................................................................... 16<br />
2.1.2 Objectives ............................................................................................................................................... 16<br />
2.2 Implementation Strategy.................................................................................................................................... 17<br />
2.2.1 Building Partnerships Across <strong>NOAA</strong> ......................................................................................................... 17<br />
2.2.2 The <strong>HMT</strong> Concept: <strong>Testbed</strong> as a Process .................................................................................................. 18<br />
2.2.3 National <strong>Testbed</strong> Strategy with Regional Implementations ....................................................................... 19<br />
2.2.4 Other Partnerships and Interagency Synergism ......................................................................................... 19<br />
2.2.5 Linkages to Demonstration Performance Measures ................................................................................. 20<br />
2.4 <strong>HMT</strong> Management ........................................................................................................................................... 21<br />
2.4.1 <strong>HMT</strong> Management Council (MC) ............................................................................................................ 22<br />
2.4.2 <strong>HMT</strong> Project Manager (PM) ..................................................................................................................... 22<br />
2.4.3 <strong>HMT</strong> National Advisory Panel (NAP) ...................................................................................................... 23<br />
2.4.4 <strong>HMT</strong> Regional Implementation Teams (RIT) ............................................................................................ 23<br />
2.4.4.1 RIT-West ........................................................................................................................................ 23<br />
2.4.4.2 RIT-Southeast ................................................................................................................................. 24<br />
2.4.5 Integrated Water Resource Services-Priority Area Task Team (IWRS-PATT) ................................................ 24<br />
2.5 Operating Plan .................................................................................................................................................. 24
<strong>HMT</strong> Science & Services Implementation Plan Table of Contents<br />
2.5.1 Communication ....................................................................................................................................... 24<br />
2.5.2 <strong>HMT</strong> <strong>Program</strong> Overview.......................................................................................................................... 25<br />
2.5.2.1 <strong>HMT</strong>-West ...................................................................................................................................... 25<br />
2.5.2.2 <strong>HMT</strong>-Southeast............................................................................................................................... 25<br />
2.5.3 Legacy Outcomes .................................................................................................................................... 26<br />
2.5.3.1 EFREP ............................................................................................................................................ 26<br />
2.5.4 Timeline and Milestones ......................................................................................................................... 26<br />
2.6 Training ............................................................................................................................................................. 26<br />
3 <strong>HMT</strong> Crosscutting Themes ........................................................................................................................................ 27<br />
3.1 Overview .......................................................................................................................................................... 27<br />
3.2 Atmospheric Rivers ........................................................................................................................................... 27<br />
3.2.1 Description ............................................................................................................................................. 27<br />
3.2.2 Team ........................................................................................................................................................ 28<br />
3.2.3 Recent Accomplishments ......................................................................................................................... 28<br />
3.2.4 Current and Planned Demonstration Activities ......................................................................................... 28<br />
3.3 <strong>HMT</strong> Observation Systems ................................................................................................................................ 28<br />
3.3.1 Description ............................................................................................................................................. 28<br />
3.3.2 Team ........................................................................................................................................................ 29<br />
3.3.3 Recent Accomplishments ........................................................................................................................ 29<br />
3.3.4 Current and Planned Demonstration Activities ......................................................................................... 30<br />
4 <strong>HMT</strong> Major Activity Areas and Projects ..................................................................................................................... 32<br />
4.1 Overview .......................................................................................................................................................... 32<br />
4.2 Quantitative Precipitation Estimation (QPE) ....................................................................................................... 32<br />
4.2.1 Overview ............................................................................................................................................... 32<br />
4.2.2 QPE from Precipitation Gauges ............................................................................................................... 33<br />
4.2.2.1 Description .................................................................................................................................... 33<br />
4.2.2.2 Team .............................................................................................................................................. 33<br />
4.2.2.3 Recent Accomplishments .............................................................................................................. 33<br />
4.2.2.4 Current and Planned Demonstration Activities .............................................................................. 33<br />
4.2.3 Radar QPE ............................................................................................................................................... 34<br />
4.2.3.1 Description .................................................................................................................................... 34<br />
4.2.3.2 Team .............................................................................................................................................. 34<br />
4.2.3.3 Recent Accomplishments ............................................................................................................... 34<br />
4.2.3.4 Current and Planned Demonstration Activities .............................................................................. 34<br />
4.2.4 Multisensor QPE ...................................................................................................................................... 35<br />
4.2.4.1 Description ................................................................................................................................... 35<br />
4.2.4.2 Team .............................................................................................................................................. 35
<strong>HMT</strong> Science & Services Implementation Plan Table of Contents<br />
4.2.4.3 Recent Accomplishments ............................................................................................................... 35<br />
4.2.4.4 Current and Planned Demonstration Activities .............................................................................. 35<br />
4.2.5 Radar System Design & Gap-Filling Radar Evaluation .............................................................................. 36<br />
4.2.5.1 Description .................................................................................................................................... 36<br />
4.2.5.2 Team .............................................................................................................................................. 36<br />
4.2.5.3 Recent Accomplishments ............................................................................................................... 36<br />
4.2.5.4 Current and Planned Demonstration Activities ............................................................................... 37<br />
4.2.6 Best Possible QPE Supporting DMIP-2 ..................................................................................................... 37<br />
4.2.6.1 Description .................................................................................................................................... 37<br />
4.2.6.2 Team .............................................................................................................................................. 37<br />
4.2.6.3 Recent Accomplishments ............................................................................................................... 38<br />
4.2.6.4 Current and Planned Demonstration Activities ............................................................................... 38<br />
4.3 Quantitative Precipitation Forecasting (QPF) ..................................................................................................... 39<br />
4.3.1 Overview ................................................................................................................................................ 39<br />
4.3.2 Numerical Weather Prediction for QPF/PQPF .......................................................................................... 40<br />
4.3.2.1 Description ................................................................................................................................... 40<br />
4.3.2.2 Team ............................................................................................................................................. 42<br />
4.3.2.3 Recent Accomplishments .............................................................................................................. 43<br />
4.3.2.4 Current and Planned Demonstration Activities ............................................................................... 43<br />
4.3.3 Other QPF Aids ....................................................................................................................................... 44<br />
4.3.3.1 Description .................................................................................................................................... 44<br />
4.3.3.2 Team .............................................................................................................................................. 45<br />
4.3.3.3 Recent Accomplishments ............................................................................................................... 45<br />
4.3.4 COSMIC .................................................................................................................................................. 49<br />
4.3.4.1 Description .................................................................................................................................... 49<br />
4.3.4.2 Team .............................................................................................................................................. 50<br />
4.3.4.3 Recent Accomplishments ............................................................................................................... 50<br />
4.3.4.4 Current and Planned Demonstration Activities ............................................................................... 51<br />
4.4 Snow Level, Surface Snow and Melting Layer .................................................................................................... 51<br />
4.4.1 Overview ................................................................................................................................................ 51<br />
4.4.2 Snow Level and Snow Information .......................................................................................................... 51<br />
4.4.2.1 Description .................................................................................................................................... 51<br />
4.4.2.2 Team ............................................................................................................................................. 52<br />
4.4.2.3 Recent Accomplishments ............................................................................................................... 52<br />
4.4.2.4 Current and Planned Demonstration Activities .............................................................................. 52<br />
4.4.3 Melting Layer Observations ..................................................................................................................... 53<br />
4.4.3.1 Description .................................................................................................................................... 53
<strong>HMT</strong> Science & Services Implementation Plan Table of Contents<br />
4.4.3.2 Team .............................................................................................................................................. 53<br />
4.4.3.3 Recent Accomplishments ............................................................................................................... 53<br />
4.4.3.4 Current and Planned Demonstration Activities ............................................................................... 54<br />
4.5 Hydrologic Applications ................................................................................................................................... 54<br />
4.5.2 Real-Time Operational Improvements Using <strong>HMT</strong> Data ......................................................................... 55<br />
4.5.2.1 Description ................................................................................................................................... 55<br />
4.5.2.2 Team .............................................................................................................................................. 55<br />
4.5.2.3 Recent Accomplishments .............................................................................................................. 55<br />
4.5.2.4 Current and Planned Demonstration Activities ............................................................................... 55<br />
4.5.3 Hydrologic Research in North Fork of the American River and DMIP-2 ................................................... 57<br />
4.5.3.1 Description ................................................................................................................................... 57<br />
4.5.3.2 Team .............................................................................................................................................. 57<br />
4.5.3.3 Recent Accomplishments .............................................................................................................. 57<br />
4.5.3.4 Current and Planned Demonstration Activities ............................................................................... 57<br />
4.5.4 Supporting Integrated Water Resources Services (IWRS) in Arizona.......................................................... 59<br />
4.4.4.1 Description ................................................................................................................................... 59<br />
4.5.4.2 Team .............................................................................................................................................. 60<br />
4.5.4.3 Recent Accomplishments .............................................................................................................. 60<br />
4.5.4.4. Current and Planned Demonstration Activities .............................................................................. 60<br />
4.6 Debris Flow ...................................................................................................................................................... 61<br />
4.6.1 Description ............................................................................................................................................. 61<br />
4.6.2 Team ........................................................................................................................................................ 61<br />
4.6.3 Recent Accomplishments ........................................................................................................................ 61<br />
4.6.4 Current and Planned Demonstration Activities ......................................................................................... 62<br />
4.7 Verification ....................................................................................................................................................... 63<br />
4.7.1 Overview ............................................................................................................................................... 63<br />
4.7.2 QPE/QPF Verification............................................................................................................................... 63<br />
4.7.2.1 Description .................................................................................................................................... 63<br />
4.7.2.2 Team .............................................................................................................................................. 64<br />
4.7.2.3 Recent Accomplishments .............................................................................................................. 65<br />
4.7.2.4 Current and Planned Demonstration Activities .............................................................................. 65<br />
4.7.3 <strong>HMT</strong>/DTC Collaboration ......................................................................................................................... 70<br />
4.7.3.1 Description .................................................................................................................................... 70<br />
4.7.3.2 Team ............................................................................................................................................. 70<br />
4.7.3.3 Recent Accomplishments .............................................................................................................. 70<br />
4.7.3.4 Current and Planned Demonstration Activities .............................................................................. 70<br />
4.7.4 Snow Level Verification ........................................................................................................................... 73
<strong>HMT</strong> Science & Services Implementation Plan Table of Contents<br />
4.7.4.1 Description ................................................................................................................................... 73<br />
4.7.4.2 Team .............................................................................................................................................. 73<br />
4.7.4.3 Recent Accomplishments .............................................................................................................. 73<br />
4.7.4.4 Current and Planned Demonstration Activities .............................................................................. 75<br />
4.7.5 Hydrologic Verification ............................................................................................................................ 75<br />
4.7.5.1 Description ................................................................................................................................... 75<br />
4.7.5.2 Team .............................................................................................................................................. 75<br />
4.7.5.3 Recent Accomplishments ............................................................................................................. 75<br />
4.7.5.4 Current and Planned Demonstration Activities ............................................................................ 76<br />
4.8 Decision Support Tools ..................................................................................................................................... 78<br />
4.8.1 Overview ................................................................................................................................................ 78<br />
4.8.2 Flash Flood Monitoring <strong>Program</strong> (FFMP) .................................................................................................. 79<br />
4.8.2.1 Description ................................................................................................................................... 79<br />
4.8.2.2 Team .............................................................................................................................................. 79<br />
4.8.2.3 Recent Accomplishments .............................................................................................................. 79<br />
4.8.2.4 Current and Planned Demonstration Activities ............................................................................... 79<br />
4.8.3 Forecaster Workstation Upgrades Using Advanced Linux Prototype System (ALPS) .................................. 83<br />
4.8.3.1 Description .................................................................................................................................... 83<br />
4.8.3.2 Team .............................................................................................................................................. 83<br />
4.8.3.3 Recent Accomplishments .............................................................................................................. 83<br />
4.8.3.4 Current and Planned Demonstration Activities ............................................................................... 84<br />
4.8.4 Gridded Forecast Preparation ............................................................................................................ 85<br />
4.8.4.1 Description .................................................................................................................................... 85<br />
4.8.4.2 Team ............................................................................................................................................. 86<br />
4.8.4.3 Recent Accomplishments ............................................................................................................... 86<br />
4.8.4.4 Current and Planned Demonstration Activities ............................................................................... 86<br />
4.8.5 Integrated Water Resources Science and Services (IWRSS) ....................................................................... 87<br />
4.8.5.1 Description ................................................................................................................................... 87<br />
4.8.5.2 Team .............................................................................................................................................. 87<br />
4.8.5.3 Recent Accomplishments .............................................................................................................. 88<br />
4.8.5.4 Current and Planned Demonstration Activities .............................................................................. 89<br />
5 Budget ....................................................................................................................................................................... 91<br />
6 References ................................................................................................................................................................ 92<br />
7 Appendices ............................................................................................................................................................... 96<br />
Appendix A: Acronyms .............................................................................................................................................. 96<br />
Appendix B: An Analysis of the <strong>HMT</strong> Bibliography .................................................................................................. 100<br />
Appendix C: <strong>HMT</strong> Management Action Plan ........................................................................................................... 110
<strong>HMT</strong> Science & Services Implementation Plan Table of Contents<br />
Appendix D: Memorandum Initiating <strong>HMT</strong>-Southeast Planning ............................................................................... 112<br />
Appendix E: Memorandum Establishing a Full-time <strong>HMT</strong> Project Manager .............................................................. 113<br />
Appendix F: <strong>NOAA</strong> Annual Guidance Memo FY 2010–2014 .................................................................................. 114<br />
Appendix G: Synopsis of <strong>HMT</strong> Major Activities for 2009 ......................................................................................... 122<br />
G.1. Overview ...................................................................................................................................................... 122<br />
G.2 Quantitative Precipitation Estimation (QPE) ................................................................................................... 122<br />
G.2.1 QPE Gauges ......................................................................................................................................... 122<br />
G.2.1.1 Technical Area Leaders ................................................................................................................ 122<br />
G.2.1.2 Description and Problem Statement ............................................................................................ 122<br />
G.2.1.3 <strong>HMT</strong> Activities and Tasks ............................................................................................................. 122<br />
G.2.2 Radar QPE ............................................................................................................................................ 123<br />
G.2.2.1 Technical Area Leaders ................................................................................................................ 123<br />
G.2.2.2 Description and Problem Statement ............................................................................................ 123<br />
G.2.2.3 <strong>HMT</strong> Activities and Tasks ............................................................................................................ 123<br />
G.2.3 Multisensor QPE ................................................................................................................................... 124<br />
G.2.3.1 Technical Area Leaders ................................................................................................................ 124<br />
G.2.3.2 Description and Problem Statement ............................................................................................ 124<br />
G.2.3.3 <strong>HMT</strong> Activities and Tasks ............................................................................................................. 124<br />
G.2.4 Radar System Design & Gap-Filling Radar Evaluation ........................................................................... 124<br />
G.2.4.1 Technical Area Leaders ................................................................................................................ 124<br />
G.2.4.2 Description and Problem Statement ............................................................................................ 124<br />
G.2.4.3 <strong>HMT</strong> Activities and Tasks ............................................................................................................. 125<br />
G.2.5 Best Possible QPE Supporting DMIP-2 .................................................................................................. 125<br />
G.2.5.1 Technical Area Leaders ................................................................................................................ 125<br />
G.2.5.2 Description and Problem Statement ............................................................................................ 125<br />
G.2.5.3 <strong>HMT</strong> Activities and Tasks ............................................................................................................. 125<br />
G.3.1 Numerical Weather Prediction .............................................................................................................. 126<br />
G.3.1.1 Technical Area Leaders ................................................................................................................ 126<br />
G.3.1.2 Description and Problem Statement ............................................................................................ 126<br />
G.3.1.3 <strong>HMT</strong> Activities and Tasks ............................................................................................................. 126<br />
G.3.2 Other QPF Aids .................................................................................................................................... 127<br />
G.3.2.1 Technical Area Leaders ................................................................................................................ 127<br />
G.3.2.2 Description and Problem Statement ............................................................................................ 127<br />
G.3.2.3 <strong>HMT</strong> Activities and Tasks ............................................................................................................ 127<br />
G.3.3 COSMIC ............................................................................................................................................... 127<br />
G.3.3.1 Technical Area Leaders ................................................................................................................ 127<br />
G.3.3.2 Description and Problem Statement ............................................................................................ 127
<strong>HMT</strong> Science & Services Implementation Plan Table of Contents<br />
G.3.3.3 <strong>HMT</strong> Activities and Tasks ............................................................................................................ 128<br />
G.4 Snow Level, Surface Snow and Melting Layer ................................................................................................. 128<br />
G.4.1 Snow Level and Snow Information ....................................................................................................... 128<br />
G.4.1.1 Technical Area Leaders ................................................................................................................ 128<br />
G.4.1.2 Description and Problem Statement ............................................................................................ 128<br />
G.4.1.3 <strong>HMT</strong> Activities and Tasks ............................................................................................................. 128<br />
G.4.2 Melting Layer Observations ................................................................................................................ 129<br />
G.4.2.1 Technical Area Leaders ................................................................................................................ 129<br />
G.4.2.2 Description and Problem Statement ............................................................................................ 129<br />
G.4.2.3 <strong>HMT</strong> Activities and Tasks ............................................................................................................. 129<br />
G.5 Hydrologic Applications ................................................................................................................................. 130<br />
G.5.1 Real Time Hydrologic Operational Improvements Using <strong>HMT</strong> Data ..................................................... 130<br />
G.5.1.1 Technical Area Leaders ................................................................................................................ 130<br />
G.5.1.2 Description and Problem Statement ............................................................................................ 130<br />
G.5.1.3 <strong>HMT</strong> Activities and Tasks ............................................................................................................. 130<br />
G.5.2 Hydrologic Research in North Fork American River and DMIP 2 .......................................................... 130<br />
G.5.2.1 Technical Area Leaders ................................................................................................................ 130<br />
G.5.2.2 Description and Problem Statement ............................................................................................ 131<br />
G.5.3.2 <strong>HMT</strong> Activities and Tasks ............................................................................................................. 131<br />
G.5.3 Supporting Integrated Water Resources Services (IWRS) in Arizona ....................................................... 131<br />
G.5.3.1 Technical Area Leaders ................................................................................................................ 131<br />
G.5.3.2 Description and Problem Statement ............................................................................................ 131<br />
G.5.3.3 <strong>HMT</strong> Activities and Tasks ............................................................................................................. 132<br />
G.6 Debris Flow.................................................................................................................................................... 132<br />
G.6.1 Technical Area Leaders ......................................................................................................................... 132<br />
G.6.2 Description and Problem Statement ...................................................................................................... 132<br />
G.6.3 <strong>HMT</strong> Activities and Tasks ...................................................................................................................... 132<br />
G.7 Verification .................................................................................................................................................... 133<br />
G.7.1 QPE/QPF Verification ............................................................................................................................ 133<br />
G.7.1.1 Technical Area Leaders ................................................................................................................ 133<br />
G.7.1.2 Description and Problem Statement ............................................................................................ 133<br />
G.7.1.3 <strong>HMT</strong> Activities and Tasks ............................................................................................................. 133<br />
G.7.2 <strong>HMT</strong>/DTC Collaboration ...................................................................................................................... 134<br />
G.7.2.1 Technical Area Leaders ................................................................................................................ 134<br />
G.7.2.2 Description and Problem Statement ............................................................................................ 134<br />
G.7.2.3 <strong>HMT</strong> Activities and Tasks ............................................................................................................. 134<br />
G.7.3 Snow Level Verification ......................................................................................................................... 134
<strong>HMT</strong> Science & Services Implementation Plan Table of Contents<br />
G.7.3.1 Technical Area Leaders ................................................................................................................ 134<br />
G.7.3.2 Description and Problem Statement ............................................................................................ 135<br />
G.7.3.3 <strong>HMT</strong> Activities and Tasks ............................................................................................................. 135<br />
G.7.4 Hydrologic Verification ......................................................................................................................... 135<br />
G.7.4.1 Technical Area Leaders ................................................................................................................ 135<br />
G.7.4.2 Description and Problem Statement ........................................................................................... 135<br />
G.7.4.3 <strong>HMT</strong> Activities and Tasks ............................................................................................................. 135<br />
G.8 Decision Support Tools ................................................................................................................................... 136<br />
G.8.1 Flash Flood Monitoring <strong>Program</strong> (FFMP) ............................................................................................... 136<br />
G.8.1.1 Technical Area Leaders ................................................................................................................ 136<br />
G.8.1.2 Description and Problem Statement ........................................................................................... 136<br />
G.8.2.3 <strong>HMT</strong> Activities and Tasks ............................................................................................................. 136<br />
G.8.2 Forecaster Workstation Upgrades Using Advanced Linux Prototype System (ALPS) ............................... 137<br />
G.8.2.1 Technical Area Leaders ................................................................................................................ 137<br />
G.8.2.2 Description and Problem Statement ........................................................................................... 137<br />
G.8.2.3 <strong>HMT</strong> Activities and Tasks ............................................................................................................. 137<br />
G.8.3 Gridded Forecast Preparation ................................................................................................................ 138<br />
G.8.3.1 Technical Area Leaders ................................................................................................................ 138<br />
G.8.3.2 Description and Problem Statement ............................................................................................ 138<br />
G.8.3.3 <strong>HMT</strong> Activities and Tasks ............................................................................................................. 138<br />
G.8.4 Integrated Water Resources Science and Services (IWRSS) .................................................................... 138<br />
G.8.4.1 Technical Area Leaders ................................................................................................................ 138<br />
G.8.4.2 Description and Problem Statement ............................................................................................ 139<br />
G.8.4.3 <strong>HMT</strong> Activities and Tasks ............................................................................................................. 139
<strong>HMT</strong> Science & Services Implementation Plan Executive Summary<br />
Executive Summary<br />
The <strong>Hydrometeorology</strong> <strong>Testbed</strong> (<strong>HMT</strong>) is a research program aimed at accelerating the research,<br />
development, and infusion of new technologies, models, and scientific results from the research community<br />
into daily forecasting operations of the National Weather Service (NWS) Weather Forecast Offices (WFOs),<br />
River Forecast Centers (RFCs), and the National Centers for Environmental Prediction (NCEP). <strong>HMT</strong> has<br />
been identified in the NWS Hydrology Science and Technology Implementation Plan (STIP) as a key new<br />
R&D approach for improving flood forecasts, and its implementation has been directed to <strong>NOAA</strong>'s Weather<br />
and Water mission goal. The diversity of talent and expertise across <strong>NOAA</strong> and other federal, state, and local<br />
agencies is being harnessed in <strong>HMT</strong> by building partnerships that breakdown traditional ‘stovepipes’. The<br />
cross-discipline structure of <strong>HMT</strong> includes researchers and forecasters forming new working relationships<br />
that are time efficient and effective in realizing improved water services.<br />
<strong>HMT</strong> has demonstrated that advanced observational, data assimilation and modeling systems can<br />
be deployed for productive use by NWS RFC and WFO operational offices and NCEP operational<br />
staff, and their federal, state, and local agency partners. Additional coordination will be directed<br />
to placing <strong>HMT</strong> advanced tools into operational settings of the partners.<br />
<strong>HMT</strong> is a national testbed strategy that is implemented regionally. In practice, this means that resources are<br />
focused for a number of years in one region of the country to address the hydrometeorology problems in that<br />
region. Then, the regional project is shifted to another region of the country while maintaining a continued,<br />
“legacy” effort in the original focus region. Each project will run for several years (nominally for five or<br />
more years) in each regional demonstration setting to determine the most useful new tools for improving<br />
precipitation and runoff forecasting methods. The proven successful tools will remain in place and will be<br />
duplicated as the <strong>HMT</strong> moves to the next region.<br />
<strong>HMT</strong> has demonstrated that the regional testbed strategy is an effective way to concentrate the<br />
efforts of researchers and operational agencies on the particular hazardous weather phenomenon<br />
of that region. Further, the process of <strong>HMT</strong> planning and deployment provides insights into how<br />
multiparticipant projects can be designed and implemented for achievement of improved water<br />
services.<br />
The first phase of <strong>HMT</strong> is an outgrowth of <strong>NOAA</strong>'s CALJET and PACJET projects from 1997–2003 on<br />
the West Coast. <strong>HMT</strong>-West targets California's flood-vulnerable American River Basin as the first fullscale<br />
deployment of this highly instrumented facility, deployed during the period from 2005 through 2011.<br />
Preliminary, small-scale tests of <strong>HMT</strong> facilities were conducted in California's Coast Range in 2004 (<strong>HMT</strong>-<br />
04), and the <strong>HMT</strong> was extended to the western slopes of the Sierra Nevada for the winter of 2004-2005. The<br />
2008–2009 winter season is the fourth and most comprehensive deployment in the American River Basin and<br />
associated region to date. <strong>HMT</strong>-West is expected to peak in 2009–2011, before transitioning to a legacy mode<br />
of operations.<br />
Following the California demonstration, <strong>HMT</strong> facilities will be sequentially deployed to other regions of the<br />
nation to address serious hydrometeorology problems that are unique to those locations. The next regional<br />
testbed is targeted to begin in 2011 (or thereafter, pending support) in the southeastern United States: planning<br />
is underway for <strong>HMT</strong>-Southeast and is focused on the Tar-Neuse River Basins of North Carolina.<br />
Staged deployment of the <strong>HMT</strong> observational and forecasting systems has allowed researchers<br />
to learn about and focus on the primary drivers of extreme precipitation and associated flooding<br />
and flash flooding, and to validate advanced data assimilation and forecast tools through users<br />
charged with forecast and warning operations. It is anticipated that successful aspects of the <strong>HMT</strong><br />
will remain deployed in the region as a legacy to provide continuing support for operations.<br />
i
<strong>HMT</strong> Science & Services Implementation Plan Executive Summary<br />
Unlike typical research field projects, <strong>HMT</strong> operates as a demonstration with forecasters and researchers<br />
joining forces in the operational setting. <strong>HMT</strong> yields research findings and field-tested methods that can be<br />
implemented into <strong>NOAA</strong>'s operational forecast and information services. These include improved algorithms,<br />
better models, new observations or better use of existing observations, new diagnostic techniques, and<br />
forecaster training modules describing new tools or insights into physical processes. A key output of <strong>HMT</strong><br />
is an accurate estimate of the spatio-temporal distribution of current and forecast precipitation over selected<br />
pilot study watersheds. These observations are then used to evaluate existing and new forecast models and<br />
other forecast tools, such as those needed for the NWS watch-warning system and streamflow forecasting<br />
system.<br />
The major activity areas of <strong>HMT</strong> include:<br />
• Quantitative Precipitation Estimation (QPE)<br />
• Quantitative Precipitation Forecast (QPF)<br />
• Snow Level and Surface Snow Information<br />
• Hydrologic Applications<br />
• Debris Flow<br />
• Verification<br />
• Decision Support Tools<br />
Quantitative precipitation estimation is difficult for a variety of reasons, including shallow rain processes,<br />
practical difficulties in deploying and maintaining rain gauge networks, limitations of radar in detecting<br />
precipitation in zones with beam blockages, over-shooting or coarse radar resolution, algorithmic<br />
uncertainties, and challenges in determining the precipitation phase near or at the surface. <strong>HMT</strong>-West<br />
precipitation gauges, weather radars, and multisensor data assimilation methods enable scientists to form<br />
a more complete picture of winter precipitation events over the Sierras, test new methods for deriving<br />
precipitation from more commonly available remote observing platforms, and determine the impact of these<br />
QPEs in hydrologic models.<br />
ii<br />
<strong>HMT</strong> has demonstrated that coordinated deployment of a wide spectrum of sensors, data<br />
assimilation techniques, and models can provide a more complete picture of winter precipitation<br />
events and hydrologic responses over complex terrain. However, gaps remain in the sensor<br />
coverage and analysis capabilities that require further development and testing to achieve a fully<br />
complete representation of QPE.<br />
Quantitative precipitation forecasts are a key element for improving lead-time for extreme precipitation<br />
events and consequent hydrological forecasts. Various activities have been implemented in <strong>HMT</strong>-West to<br />
provide improved QPFs, including numerical weather prediction modeling (NWP), an AR water vapor<br />
flux tool, reforecasting for statistical postprocessing, and subseasonal forecasting based on patterns of the<br />
Madden-Julian Oscillation (MJO) and other large-scale phenomena. The principle ensemble systems being<br />
used in the <strong>HMT</strong> are configurations of the Weather Research and Forecasting (WRF) Model, the NCEP Shortrange<br />
Ensemble Forecast System (SREF) and the North American Ensemble Forecast System (NAEFS), with<br />
efforts directed to designing, implementing, maintaining, and evaluating the ensemble modeling systems, and<br />
new statistical postprocessing techniques, especially for probabilistic quantitative precipitation forecasts.<br />
<strong>HMT</strong> has fostered development of a number of new approaches for QPF which address lead time<br />
scales ranging from 0–3 days, 3–5 days, 5–14 days and greater than 14 days. Parallel testing of<br />
these approaches provides new insights into the efficacy of singular and combined versions for<br />
improving forecast lead times. Gaps are evident, however, in the data assimilation procedures,<br />
the appropriateness of the various products for operational use by the RFCs, WFOs and NCEP,<br />
coordination of the various products, assignment of computing resources, and verification of forecast<br />
products; these gaps are the focus of continuing research.
<strong>HMT</strong> Science & Services Implementation Plan Executive Summary<br />
Snow level and surface snow information are important because the snow level (SL) determines the amount<br />
of area in a basin that will receive rain versus snow during a particular storm, key factors governing the<br />
amount of water that is available for runoff and the potential for flooding. <strong>HMT</strong> has developed, implemented,<br />
and evaluated a technique that uses profiling radars to automatically detect the altitude of the SL during<br />
precipitation. <strong>HMT</strong> is now using these systems to validate gridded observational estimates and forecasts of<br />
SL through intensive field monitoring of storm events. This validation work will eventually lead to better<br />
integration of radar SL estimates into operational forecasting.<br />
<strong>HMT</strong> has yielded new sensors and techniques for SL nowcasting, QPE and forecast verification. A<br />
patented SL algorithm has been implemented and provides products used by the RFC for operational<br />
hydrologic forecasting. Further, as part of the <strong>HMT</strong>-West legacy, <strong>NOAA</strong> has embarked on projects<br />
with the California Department of Water Resources (DWR) and the California Energy Commission<br />
(the CalWater project) to provide radar and wind profiler instrumentation to support continuing<br />
research on snow weather processes in the Sierras.<br />
Hydrologic applications build on the hydrometeorological observations and forecasts to obtain improved<br />
river simulations and forecasts. Activities include: 1) evaluation of advanced observations of rain and snow,<br />
temperature, soil moisture, and other variables in the context of operational forecasting at the CNRFC and<br />
companion WFOs (Sacramento, Monterrey and Reno); 2) hydrologic research in the North Fork American<br />
River as part of the second phase of the distributed model inter-comparison project (DMIP-2); and 3) soil<br />
moisture monitoring in support of distributed model implementation.<br />
<strong>HMT</strong> datasets are being used to support WFO and RFC hydrologic forecasting operations. The<br />
high-resolution <strong>HMT</strong> datasets also provide the basis for pilot testing of new hydrologic modeling<br />
approaches of the AHPS and ESP by the CNRFC, and the DMIP-2 by OHD. Planned deployment<br />
of additional gap-filling radars is intended to provide a better definition of orographic rainfall<br />
in the mountainous terrain. Soil moisture networks are being deployed throughout California<br />
(through <strong>HMT</strong> and EFREP), in Arizona, and in Colorado.<br />
Debris flows are gravity-driven mixtures of sediment and water that are most commonly initiated when heavy<br />
rainfall or rapid snowmelt mobilizes soil on steep slopes. Areas burned by brush fires in California are shown<br />
to be particularly susceptible to debris flows. Accurately measuring rainfall over potential debris flow basins<br />
is one of the more difficult challenges associated with applying intensity-duration thresholds. Radar-observed<br />
quantitative precipitation estimates (QPE) provide one way to estimate the areal coverage of precipitation, if<br />
the radar is properly sited and calibrated.<br />
<strong>HMT</strong> will contribute to the multiagency collaboration that is providing enhanced QPE and QPF<br />
products to support debris flow watch and warning product development by the responsible WFOs<br />
and RFCs, primarily through the FFMP application.<br />
Verification is an essential activity that provides quantifiable information on improvements in forecast<br />
skill. The <strong>HMT</strong> QPF verification project has several goals, including 1) the identification, assessment, and<br />
assurance of verification data quality, including QPE; 2) the establishment of effective techniques for the<br />
verification of probabilistic forecasts; and 3) the determination of confidence levels for verification scores.<br />
Methods are applied for QPE, QPF, snow level and hydrological forecasts. Verification is also the basis for<br />
the formulation of new and/or improved performance measures.<br />
One notable <strong>HMT</strong>-West outcome is the development of a new QPF performance measure based<br />
on the QPF versus QPE bias ratio for extreme precipitation events associated with land-falling<br />
Pacific winter storms. Research analyses of precipitation forecasts and estimates for events<br />
during <strong>HMT</strong>-West have also led to the development of improved verification techniques for<br />
iii
<strong>HMT</strong> Science & Services Implementation Plan Executive Summary<br />
iv<br />
ensemble QPFs. Similar advancements have been demonstrated for snow level forecasts. Planned<br />
verification activities include those for QPE, QPF and hydrologic forecasts. <strong>HMT</strong> is developing<br />
and evaluating new performance measures for QPF and snow level monitoring and prediction.<br />
Decision support tools denote a category of activities involving placement of <strong>HMT</strong>- coordinated<br />
functionalities for use by forecasters in actual forecasting and hazardous event warning operations. This<br />
category of <strong>HMT</strong> activities includes: 1) forecaster workstation upgrades using the Advanced Linux Prototype<br />
System (ALPS), 2) flash flood monitoring and prediction (FFMP), 3) gridded forecast preparation (graphical<br />
forecast editor (GFE)), and 4) Integrated Water Resources Science and Services (IWRSS).<br />
<strong>HMT</strong> has supported the development and operational deployment of the ALPS workstation. Two<br />
ALPS are deployed in the Sacramento Flood Operations Center (FOC), which coordinates flood<br />
response actions by the California DWR, the US Army Corps of Engineers, the US Bureau of<br />
Reclamation; and in the Monterey and Eureka WFOs. These are examples of the penetration<br />
of <strong>HMT</strong> advanced data sets and decision tools into operations by the responsible response<br />
agencies. Efforts to utilize and/or improve FFMP and GFE are also underway. This is the kind of<br />
coordination envisioned by <strong>NOAA</strong>’s IWRSS concept.<br />
Two crosscutting themes have emerged:<br />
• Atmospheric Rivers<br />
• Observation Systems<br />
Atmospheric Rivers (AR) are considered a crosscutting theme of the <strong>HMT</strong>-West in that this<br />
hydrometeorological phenomenon strongly influences all of the other activities. It is becoming increasingly<br />
clear that our ability to improve predictions of many of the largest storms and floods impacting western North<br />
America, and our ability to track their progress as they propagate down the coastal margin, will depend on<br />
advancing our understanding and observations of ARs.<br />
<strong>HMT</strong> has provided new capabilities for detection and forecasting of ARs and the contribution<br />
of this phenomenon to heavy precipitation and flood runoff events. These capabilities are<br />
demonstrated in the various specific activities described below. Continuing research seeks to<br />
improve the lead time for AR detection and to integrate advanced detection and forecasting tools<br />
into forecast operations.<br />
<strong>HMT</strong> observational systems are an enabling theme and are the foundation for detection and forecasting<br />
of extreme precipitation events. The <strong>HMT</strong> observational systems have evolved over the past several years<br />
to incorporate a wide variety of instrumentation and data collection capabilities. Special, highly detailed<br />
observations are being collected within the broader context of the operational observing networks of the<br />
National Weather Service (NWS) and other agencies. The <strong>HMT</strong> observational strategy consists of a network<br />
providing broad regional context within which heavily instrumented river basins are nested.<br />
The <strong>HMT</strong> program creates a unique capability within <strong>NOAA</strong> to assess new technology by<br />
understanding what needs to be measured, how to measure it, and how to extract the most useful<br />
information from these measurements. R&D continues to develop new and low-cost sensors and data<br />
assimilation techniques, which can provide the foundation for improved water services.
<strong>HMT</strong> Science & Services Implementation Plan Introduction<br />
1 Introduction<br />
<strong>NOAA</strong>’s <strong>Hydrometeorology</strong> <strong>Testbed</strong> (<strong>HMT</strong>) <strong>Program</strong> has been developed to respond to the increased<br />
criticality of water to our nation’s wellbeing. Severe weather events such as hurricanes, intense rainstorms<br />
and subsequent flooding and/or flash flooding, droughts and concerns with the impacts of climate change<br />
have led to a number of initiatives directed to improving our capacity for forecasting and warning of these<br />
phenomena. To accomplish these goals, a priority is being placed on the design and development of integrated<br />
multifunctional mesoscale observing networks and operational forecasting systems focused on a specific<br />
region. The <strong>HMT</strong> <strong>Program</strong> is comprised of regional projects called “testbeds” (e.g. <strong>HMT</strong>-West in northern<br />
California) and satellite projects known as mini-testbeds (such as the soil moisture and temperature network<br />
in Arizona).<br />
Deployment of a regionally oriented testbed approach was a primary recommendation of a U.S. Weather<br />
Research <strong>Program</strong> workshop (summarized in Dabberdt et al. 2005a):<br />
“As <strong>NOAA</strong> considers the future of its integrated regional, surface, and tropospheric observing systems,<br />
it faces a key question addressed by this workshop—how to optimize the development and deployment<br />
of new measurement systems so as to strengthen the mesoscale observation and prediction capabilities<br />
over the United States. <strong>Testbed</strong>s can point the way toward filling this need …”<br />
This recommendation describes a primary motivator for <strong>NOAA</strong>’s <strong>HMT</strong> <strong>Program</strong>. <strong>HMT</strong> is about innovation<br />
– a relatively new model for doing applied research: <strong>HMT</strong> is a hydrometeorological research program aimed<br />
at accelerating the research, development, and infusion of new technologies, models, and scientific results<br />
from the research community into daily forecasting operations of the National Weather Service (NWS). It<br />
is one effort to build a bridge over the so-called “valley of death” that often exists between the research and<br />
development and operational communities (National Research Council, 2000). These principles are contained<br />
in <strong>HMT</strong>’s mission and vision statements:<br />
Mission<br />
To conduct research and accelerate the development and infusion of new<br />
technologies, models, and scientific results from the research community into daily<br />
hydrometeorological forecasting operations of the National Weather Service (NWS)<br />
Vision<br />
To significantly increase the accuracy (verifiability) and reliability of <strong>NOAA</strong>’s<br />
hydrometeorological products and services to meet the nation’s growing demands for<br />
water resource information in a changing climate.<br />
1.1 <strong>HMT</strong>’s Drivers: <strong>NOAA</strong>’s Strategic Goals and Mission Requirements<br />
In this section, <strong>HMT</strong> is placed within the framework of <strong>NOAA</strong>’s Strategic Plan and key performance<br />
measures<br />
Key Societal Needs<br />
Water is a vital resource that touches every life, every day. Thus it is almost a paradox that both too much<br />
water and too little water can be extraordinarily costly, and even deadly.<br />
- “Water is the next oil.” Managing a key natural resource (and a valuable commodity) requires<br />
advanced monitoring and predictive capabilities to reduce conflict between many competing demands,<br />
from fisheries, to agriculture, human consumption and many other uses<br />
1
<strong>HMT</strong> Science & Services Implementation Plan Introduction<br />
2<br />
- On average, flooding causes more loss of life than other weather-related natural hazards, a significant<br />
fraction of which can be mitigated through more accurate forecasts and warnings<br />
- Whether the problem is too little, or too much water, the societal impacts are profound<br />
This dimension is explored further in section 1.2.<br />
A National Priority has Emerged on Water Resources Information<br />
Water resources problems are significant and getting bigger, and have created demand for <strong>NOAA</strong> and other<br />
agencies to coordinate and accelerate efforts to address these challenges. Excerpts from a briefing by <strong>NOAA</strong><br />
Deputy Undersecratary Mary Glackin at the interagency meeting “Collaborating for a Sustainable Water<br />
Resources Future” (August 2009), include:<br />
- Climate change and variability are dramatically impacting water availability and quality<br />
- Socio-economic impacts of floods and droughts are escalating<br />
- Population growth and economic development are stressing water supplies<br />
- Increasing global demand for food and energy are causing unprecedented pressure on water resources<br />
and aquatic ecosystems<br />
- Seamless integration of information and capabilities, and enhanced levels of collaboration, are<br />
required to address these challenges<br />
- Each Federal water agency has an important role<br />
<strong>NOAA</strong>’s Mission<br />
<strong>NOAA</strong>’s mission is to<br />
“To understand and predict changes in the Earth’s environment and conserve and manage coastal<br />
and marine resources to meet our nation’s economic, social, and environmental needs.”<br />
The <strong>NOAA</strong> Mission Goal that is addressed most directly by <strong>HMT</strong> is to<br />
“Serve Society’s Needs for Weather and Water Information” (Weather and Water)<br />
Weather and Water’s Performance Objectives<br />
The Weather and Water formal performance objectives that are addressed most directly by <strong>HMT</strong> are<br />
- Increase development, application, and transition of advanced science and technology to operations<br />
and services<br />
- Increase lead time and accuracy for weather and water warnings and forecasts<br />
- Improve predictability of the onset, duration, and impact of hazardous and severe weather and water<br />
events<br />
Additional Weather and Water formal performance objectives addressed by <strong>HMT</strong> are:<br />
- Reduce uncertainty associated with weather and water decision tools and assessments<br />
- Increase application and accessibility of weather and water information as the foundation for creating<br />
and leveraging public (i.e., federal, state, local, tribal), private and academic partnerships<br />
- Increase coordination of weather and water information and services with integration of local,<br />
regional, and global observation systems
<strong>HMT</strong> Science & Services Implementation Plan Introduction<br />
- Enhance environmental literacy and improve understanding, value and use of weather and water<br />
information services<br />
Weather and Water Research Areas within <strong>NOAA</strong>’s Five-Year Research Plan FY2008–FY2012<br />
- Improve weather forecast and warning accuracy and amount of lead time<br />
- Improve water resources forecasting capabilities<br />
- Improve <strong>NOAA</strong>’s understanding and forecast capability in coasts, estuaries, and oceans<br />
<strong>NOAA</strong> Mission Requirements/<strong>Program</strong> Objectives Addressed by <strong>HMT</strong> (from <strong>Program</strong> Charters)<br />
Mission requirements related to the Integrated Water Forecasting (IWF) <strong>Program</strong>:<br />
- <strong>NOAA</strong>’s Role: Provide accurate and reliable water forecasts (where, when, and how much), including<br />
o Precipitation<br />
o Flash Flood<br />
o River flood<br />
o Estuarine water level and storm surge<br />
<strong>Program</strong> objectives for IWF (from NEC decisional briefing December 2008) addressed by <strong>HMT</strong>:<br />
- Advance and integrate observing systems for water resources<br />
- Reduce 1-7 day river forecast errors by 50% and quantify uncertainty<br />
- Provide seamless suite of summit-to-sea high resolution water quantity and quality forecasts<br />
- Provide flood inundation forecast maps for 100% of high-impact river and coastal communities<br />
- Couple modeling systems for rivers, lakes and estuaries<br />
Mission requirements related to the Weather and Water Science, Technology & Infusion <strong>Program</strong>:<br />
- Advance <strong>NOAA</strong> mission-oriented scientific understanding<br />
- Advance <strong>NOAA</strong> mission oriented technology development<br />
- Infuse new science and technology into <strong>NOAA</strong> forecast operations<br />
Performance Measures<br />
Table 1.1 Lists the current, applicable Government Performance Requirements Act (GPRA) measures<br />
(from <strong>NOAA</strong>’s Annual Operating Plan) and demonstration GPRA measures under development. The major<br />
R&D activity areas required to improve forecast and warning services (technical guidance from the <strong>HMT</strong><br />
Management Council, informed by the <strong>HMT</strong> Advisory Panel and Project Manager) are also listed.<br />
<strong>HMT</strong> Links Science and Technology Advances<br />
<strong>HMT</strong> links science and technology (S&T) advances and NWS forecast improvements by fostering missionoriented<br />
R&D and infusion of advances into operations. This section is from the draft “Capstone” document<br />
supporting the “NWS S&T Roadmap” currently under development.<br />
A core challenge for S&T is how to measure science and technology research performance, including both<br />
the underlying advances needed in S&T to enable future breakthroughs in <strong>NOAA</strong>’s services, as well as the<br />
3
<strong>HMT</strong> Science & Services Implementation Plan Introduction<br />
near-term incremental improvements that typically build on existing operational tools. Key constraints<br />
should be recognized in establishing appropriate measures, i.e., S&T advances are a foundation of <strong>NOAA</strong>’s<br />
service improvements, yet are often not initially measurable in the “service” GPRA scores. Improving<br />
“service” GPRA scores requires “service” programs to adopt new methods, yet this may have a cost and<br />
require services to let go of existing methods. Thus a balance must be struck: while research suggests fast<br />
improvements in GPRA scores may be possible, operational goals must be reasonably achievable or the<br />
risk of failure is increased. Standard measures of scientific and technical staff productivity include patents<br />
and formal publications that do not directly link to service improvements, and yet are critical to career<br />
advancement and are standards of productivity used broadly in the S&T community.<br />
To strike this balance, a mix of the following approaches in measuring progress on implementation of the<br />
S&T Roadmap is recommended:<br />
4<br />
Table 1.1 GPRA and Demonstration Performance Measures for Forecasts and Warnings Addressed by <strong>HMT</strong><br />
Type Forecast or warning Statistical form Issuing Offices Major R&D activities required<br />
GPRA 1 inch precipitation Threat score NCEP HPC A, F, G<br />
GPRA River flood warning Lead time, accuracy RFCs, WFOs A, B, C, D, F, G<br />
Demo Extreme precipitation POD/FAR/CSI/MAE NCEP, RFCs A, B, E, F, G<br />
Demo Snow level Altitude error RFCs A, D, F<br />
<strong>HMT</strong>’s Major Activity Areas for R&D and Service Improvements<br />
A Quantitative precipitation forecasting (QPF)<br />
B Quantitative precipitation estimation (QPE)<br />
C Snow information (snow level and snow on ground)<br />
D Hydrology (flooding, soil moisture, runoff and streamflow)<br />
E Debris flow<br />
F Verification<br />
G Forecaster decision support tools<br />
i. Internal measures suitable for state-of-the-art science & technology development; i.e., measure the<br />
innovation that underpins future breakthrough advances (the S&T “push”)<br />
ii. “Infusion-oriented” measures, including testbed demonstrations of proposed new GPRA measures<br />
iii. Internal measures in “service” programs tracking implementation of infusion; i.e., measure the<br />
services’ “pull” for science and technology<br />
iv. Internal measures tracking the rate at which innovation is assimilated into forecast operations and the<br />
rate at which outdated forecast tools are discontinued<br />
The overall concept is to use “demonstration” GPRA measures (i.e., “stretch” versions of current goals and<br />
entirely new goals) to measure potential service improvements and appropriate measures of science and<br />
technology progress (Figure 1.1). Key elements of this strategy are:<br />
• Internal “stretch” GPRA score goals can be set higher in testbeds than in full operations<br />
• Adoption of new methods for full operations requires proof of concept<br />
• Proof of concept can be demonstrated by limiting tests to small areas, times, and tools<br />
• By limiting the scope of tests, the costs can be kept within reasonable bounds
<strong>HMT</strong> Science & Services Implementation Plan Introduction<br />
Figure 1.1 A graphical depiction of the relationship between S&T performance<br />
measures, the transitional demonstration (or stretch) measures, and formal<br />
GPRA metrics.<br />
• Researchers and forecasters jointly define strategies to demonstrate impacts on the suitable<br />
“Demonstration GPRA” goal (e.g., QPF) during the tests<br />
• If tests show regional improvement, extend results nationally with follow-up testing<br />
1.2 <strong>NOAA</strong> and the Nation’s Water Resources<br />
Water Issues in the News<br />
Figure 1.2 Forecasting water correctly and incorrectly impacts<br />
society and appears in the local and national news every day.<br />
Forecasting water is central to <strong>NOAA</strong>’s mission and is of great societal impact as is evidenced by headlines<br />
that are routinely in the news (Figure 1.2) and by the significant number of socio-economic disasters that<br />
involve fresh water. These provide a focus for <strong>NOAA</strong>’s emphasis on water-related, high-impact events (Figure<br />
1.3).<br />
Examples of the many ways that <strong>NOAA</strong>’s water activities impact society and commerce include a variety of<br />
meteorological observation and numerical weather and river flow prediction modeling systems (Table 1.2).<br />
Figure 1.3 Over 80% of Presidential Disaster Declarations from 1965 to 2003 were related to some form of water<br />
hazard including floods, severe storms, and snow/ice events.<br />
5
<strong>HMT</strong> Science & Services Implementation Plan Introduction<br />
Table 1.2 Examples of <strong>NOAA</strong>’s Water Monitoring and Forecasting Systems<br />
In many cases, precipitation is the single greatest hydrologic forcing factor. While <strong>NOAA</strong> has made great<br />
strides in forecasting precipitation, extreme events remain a particular challenge. For example, in one year<br />
in California during the <strong>HMT</strong> (Figure 1.4), sixteen “extreme” 1 events occurred, yet only two were correctly<br />
predicted.<br />
Precipitation appears to be at the foremost of peoples concerns. In a nationwide survey, Lazo et al. (2009)<br />
found that:<br />
6<br />
River and Stream Forecasts (NWS) • Precipitation and snow pack<br />
• Flash floods<br />
• Streamflow<br />
• Water supply<br />
• Warnings and assessments<br />
Great Lakes (OAR) • Water levels<br />
• Ice conditions<br />
• Hazardous spill response<br />
Major Bays and Ports (NOS) • Water levels<br />
• Currents<br />
• Storm surge<br />
Numerical Weather Prediction (NWS, OAR) • Precipitation<br />
Research and Development (OAR, NWS,<br />
NOS, NESDIS)<br />
• Data assimilation<br />
• Mesoscale models<br />
• Observations<br />
• Land surface conditions<br />
• Data management<br />
• Hazards assessment<br />
• Coupled modeling systems<br />
“… precipitation and temperature information are the most important self-reported<br />
components of forecasts to respondents.”<br />
In fact, overall, out of fourteen different categories of information, six of the top seven were concerned with<br />
aspects of precipitation. The respondents’ responses rated “when precipitation will occur”, the “chance of<br />
precipitation”, and “where precipitation will occur” as the top three most important components in a weather<br />
forecast, in that order, with “high temperature” (ranked fifth) being the only non-precipitation component in<br />
the top seven.<br />
1.3 <strong>NOAA</strong>’s Water Guidance and Calls to Action<br />
<strong>NOAA</strong> has developed a number of high-level management documents, which provide guidance to efforts for<br />
improving forecasts of water-related issues (Table 1.3). These documents range from the fundamental charge<br />
for weather forecasting in the NWS Organic Act and the Inland Flood Forecasting and Warning Act. Several<br />
guidance documents emphasize the strategies for Regional Collaboration and the <strong>Hydrometeorology</strong> <strong>Testbed</strong>s<br />
(see section 2 for details on how the <strong>HMT</strong> addresses the regional deployment emphasis of these guidance<br />
documents).<br />
1 For these purposes, an extreme event was defined as five inches of rain, or more, in a 24-hour period.<br />
Figure 1.4 During the 2005-2006 <strong>HMT</strong><br />
season, sixteen extreme events occurred, yet<br />
only two were predicted. This is one of the<br />
key results from the <strong>HMT</strong> verification work,<br />
which is described in detail in section 4.
<strong>HMT</strong> Science & Services Implementation Plan Introduction<br />
Table 1.3 <strong>NOAA</strong> Makes Fresh Water a Priority: Guidance to Forecast Water<br />
<strong>NOAA</strong>’s NWS Organic Act<br />
The forecasting of water is mandated in the NWS Organic Act which states, “…forecasting of weather, the<br />
issue of storm warnings, display of weather and flood signals for the benefit of agriculture, commerce, and<br />
navigation, the gauging and reporting of rivers…”<br />
<strong>NOAA</strong>’s Inland Flood Forecasting and Warning Act<br />
Forecasting of water also appears in the <strong>NOAA</strong> Inland Flood Forecasting and Warning Act: “…improve the<br />
capability to accurately forecast inland flooding, and conduct research, outreach, and education activities<br />
regarding the dangers and risks associated with inland flooding…”<br />
<strong>NOAA</strong>’s NWS Hydrology STIP (2002)<br />
<strong>NOAA</strong>’s NWS Hydrology Science and Technology Infusion Plan (STIP) identifies hydrometeorology testbeds as<br />
a means to address key R&D needs before technology can be infused into operations.<br />
<strong>NOAA</strong> Creates Weather and Water Goal (2003)<br />
Science Technology & Infusion <strong>Program</strong> defines Water Resources R&D Capability (<strong>HMT</strong>), 2004<br />
<strong>NOAA</strong>’s NWS-OAR Summit (August 2006)<br />
One of the outcomes from the NWS-OAR Summit held in August 2006 was to identify the goal of generating<br />
support for testbeds to transfer technology from Research to Operation (R2O) and from Operation to Research<br />
(O2R).<br />
<strong>NOAA</strong>’s Regional Collaboration (2007)<br />
<strong>NOAA</strong>’s Regional Collaboration strategy has four crosscutting priority areas: <strong>HMT</strong> is a key activity of the<br />
Integrated Water Resource Services priority area.<br />
VADM Lautenbacher Underscores the Importance of Fresh Water as a <strong>NOAA</strong> Priority (October 2008)<br />
VADM Lautenbacher’s parting email notes: “The ability to provide clean, safe and available water - the single<br />
largest challenge for a world with expanding population and a changing climate - must play a unifying role<br />
within the <strong>NOAA</strong> organization and have the highest priority for <strong>NOAA</strong>’s leadership goals in interagency<br />
programs and integration. Bringing all the parts of the water cycle together in research and operations to<br />
provide sound science for developing national and worldwide water policies is another organizational<br />
challenge that I look forward to seeing <strong>NOAA</strong> tackle.”<br />
<strong>NOAA</strong>’s Annual Guidance Memorandum for FY 2010–2014<br />
In the <strong>NOAA</strong> Annual Guidance Memorandum for FY 2010 – 2014, two of the six Environmental Data and<br />
Information Services Priorities focus on water and the forecasting of water. The memorandum is in Appendix A<br />
and the two water topics are:<br />
o “High-impact weather and water events”<br />
o “Water information services”<br />
1.3.1 NRC Report: Flash Flood Forecasting over Complex Terrain<br />
The <strong>HMT</strong> addresses a recommendation made by a recent National Research Council report (NRC 2005)<br />
on deployment of NEXRAD radars. The report responded to concerns that NEXRAD radars are designed<br />
for long-range coverage and can be insufficient due to terrain-induced blockage at low altitudes. The report<br />
noted that some of these problems can be resolved by deploying additional radars, which could be smaller,<br />
cheaper, and more easily (and even adaptively) deployable than NEXRAD. This is what the <strong>HMT</strong> is doing<br />
through deployment of “gap-filling” radars, which are able to detect local severe weather conditions in areas<br />
of complex terrain. The report also recommended that the NWS continue its efforts to develop and evaluate<br />
hydrologic and coupled meteorological-hydrologic models. <strong>HMT</strong> is doing this to advance technologies useful<br />
for improved flash flood guidance and warnings. <strong>HMT</strong> has deployed the polarimetric radar modification<br />
to improve the data quality and quantitative precipitation estimation (QPE) measurement capabilities of<br />
NEXRAD. <strong>HMT</strong> has deployed real-time data assimilation systems that incorporate observations into highresolution<br />
mesoscale numerical models to provide rapidly updated wind and precipitation forecasts. <strong>HMT</strong> is<br />
demonstrating data fusion systems that incorporate all available observation datasets together with numerical<br />
model output to produce very short-range (0- to 2-h), site-specific forecasts. These advances are producing<br />
improved forecasts, including ensemble and probabilistic forecasts, of precipitation rate and accumulation<br />
that are essential for flash flood forecasting.<br />
7
<strong>HMT</strong> Science & Services Implementation Plan Introduction<br />
1.3.2 NRC Report: <strong>NOAA</strong> and the Global Precipitation Measurement (GPM) Mission<br />
Another NRC report (2007) “<strong>NOAA</strong>’s Role in Space-Based Global Precipitation Estimation and<br />
Application” recommends for <strong>NOAA</strong> <strong>HMT</strong>: “There will be a symbiotic relationship between GPM and the<br />
Hydrometeorological <strong>Testbed</strong>. The Hydrometeorological <strong>Testbed</strong> will use GPM data as an additional input for<br />
experimentation and demonstration, and GPM will obtain validation elements from the Hydrometeorological<br />
<strong>Testbed</strong>.”<br />
1.3.3 NRC Report: Observing Weather and Climate from the Ground Up: A<br />
Nationwide Network of Networks<br />
The recent NRC report (2009) makes the following recommendation regarding testbeds, in the context of the<br />
nation’s mesoscale observational capabilities, which “are highly variable in quantity, quality, accessibility,<br />
instrument set, site selection, and metadata.” The report makes a further call for testbeds, such as <strong>HMT</strong>, in the<br />
following recommendation: “Federal agencies and partners should employ testbeds for applied research and<br />
development to evaluate and integrate national mesoscale observing systems, networks thereof, and attendant<br />
data assimilation systems. Among other issues, testbeds should address the unique requirements of urbanized<br />
areas, mountainous terrain, and coastal zones, which currently present especially formidable deficiencies and<br />
challenges.”<br />
1.3.4 AMS Call to Action<br />
The need to understand and forecast water is clear in an AMS Policy Statement on Water Resources in the<br />
21st Century: “The provision of adequate freshwater resources for humans and ecosystems will be one<br />
of the most critical and potentially contentious issues facing society and governments at all levels during<br />
the 21st century. Water is fundamental to our lives … Water resource managers face daunting challenges<br />
with population growth and migration, land use changes, and pollution locally, nationally, and globally —<br />
problems likely to be exacerbated over the next several decades by climate change. In light of this developing<br />
water crisis, the American Meteorological Society (AMS) issues this statement as a call to action.”<br />
1.4 <strong>HMT</strong> History<br />
The first regional testbed in the national strategy, <strong>HMT</strong>-West, was established in the American River Basin<br />
near Sacramento, CA in 2005. However, the <strong>HMT</strong> concept evolved from a series of experiments known as<br />
CALJET and PACJET projects dating from 1997–2003 centered on the Pacific Coast (primarily around the<br />
Russian River Basin). While productive from a research standpoint, the CALJET and PACJET experiences<br />
also suggested a need for a new model to better engage operational communities in the research process. This<br />
transformation from a conventional research paradigm to a hydrometeorology testbed program, was fostered<br />
by a more formal recognition of the need for a better process to improve <strong>NOAA</strong>’s capabilities to monitor and<br />
predict precipitation and runoff in the community at large. For example the USWRP held a workshop on QPF<br />
and called for a <strong>Hydrometeorology</strong> <strong>Testbed</strong> (Dabberdt et al. 2005a).<br />
From this, preliminary, small-scale tests of prototypical <strong>HMT</strong> facilities were conducted in California's Coast<br />
Range in 2004 (Russian River Basin; “<strong>HMT</strong>-04”) and subsequently <strong>HMT</strong> moved to the western slopes of<br />
the Sierra Nevada for a second prototype testbed during the winter of 2004–2005, where the focus became<br />
the American River Basin (ARB) located between Sacramento and Reno 2 . Water from the American River<br />
Basin is a critical resource for California's economy and natural ecosystems, and the threat of flooding poses<br />
an extremely serious concern for the heavily populated downstream area (Figure 1.5; an early conceptual<br />
2 Note that while the focus shifted to the ARB, the sites in the Russian River Basin have been operated since, yielding a valuable climatology<br />
extending back for more than a decade.<br />
8
<strong>HMT</strong> Science & Services Implementation Plan Introduction<br />
rendering of the ARB testbed). The frequent<br />
impact of prolonged, heavy winter precipitation<br />
from concentrated "atmospheric rivers" of<br />
moisture, originating in the tropical Pacific,<br />
underscores the area's flood vulnerability. In<br />
fact, the Sacramento region is considered to be<br />
among the nation’s most at-risk communities<br />
due to severe flood threats (second only to New<br />
Orleans).<br />
The first full-scale deployment of <strong>HMT</strong> occurred<br />
during the winters of 2005–2006 (<strong>HMT</strong>-West<br />
2006). With each subsequent year, the testbed<br />
was improved based on lessons learned from<br />
the previous season, and additional resources<br />
were also brought to bear, thus growing the<br />
testbed considerably from its initial beginnings.<br />
Presently, the <strong>HMT</strong>-West 2009 season is the<br />
fourth and most comprehensive deployment in<br />
the American River Basin to date, and intense<br />
field operations in <strong>HMT</strong>-West are scheduled<br />
through at least 2010. Figure 1.6 graphically<br />
depicts this evolution and ramp-up of the testbed<br />
from its CALJET-PACJET origins. As the <strong>HMT</strong><br />
<strong>Program</strong> evolves, the <strong>HMT</strong>-West Project will<br />
transition to a legacy mode, with an ongoing,<br />
but reduced level of activity as other testbeds are<br />
established.<br />
A component of the <strong>HMT</strong> was established at the<br />
NCEP Hydrometeorological Prediction Center<br />
(HPC) in August 2005. Its collocation with HPC<br />
forecast operations facilitates R2O operations<br />
through the interaction of HPC forecasters and<br />
visiting scientists with the <strong>HMT</strong> staff. <strong>HMT</strong><br />
at HPC has worked closely with the <strong>HMT</strong>-<br />
West and <strong>HMT</strong>-Southeast (planning) regional<br />
projects, leading to the incorporation of several<br />
methodologies from <strong>HMT</strong>-West into HPC<br />
operations. The HPC component of the <strong>HMT</strong> also<br />
Figure 1.5 An early conceptual basin scale map of <strong>HMT</strong>-West illustrating<br />
the proximity of the American River Basin to the flood-prone Sacramento<br />
area.<br />
Figure 1.6 A graphical depiction of the origins and evolution of the <strong>NOAA</strong><br />
<strong>Hydrometeorology</strong> <strong>Testbed</strong>.<br />
works with other <strong>NOAA</strong> components and the academic community to identify additional candidates for R2O.<br />
Table 1.4 provides a tabular look at the history of the <strong>HMT</strong>, and includes reference to the key planning<br />
activities, meetings and milestones leading to the current state. Future plans and activities are addressed in<br />
the following section.<br />
9
<strong>HMT</strong> Science & Services Implementation Plan Introduction<br />
Table 1.4 History of <strong>HMT</strong> activities.<br />
1.5 <strong>HMT</strong> Accomplishments<br />
The <strong>HMT</strong> has evolved into an impactful program. To date, <strong>HMT</strong> has:<br />
• Created a critical mass of research effort on one of meteorology’s toughest challenges — QPF<br />
• Created partnerships between organizations within OAR and with NWS<br />
• Brought additional resources to bear on this mission-critical problem of precipitation<br />
• Generated new tools and physical understanding that are being transitioned into NWS operations<br />
• Served as an effective environment to develop and demonstrate prototypical systems<br />
While section 4 delves into the details of recent and current activities in <strong>HMT</strong>, the remainder of this section<br />
endeavors to provide a high-level summary of <strong>HMT</strong>’s achievements to date.<br />
10<br />
Date Location Event<br />
June 15–17, 2009 Chapel Hill, NC <strong>HMT</strong>-SE Research Planning Workshop<br />
February 3–5, 2009 Chapel Hill, NC <strong>HMT</strong>-SE Operational Needs & Requirements<br />
Workshop<br />
December 2008 to March 2009 American River Basin, California <strong>HMT</strong>-West 2009 Field Deployment,<br />
Building on <strong>HMT</strong>-West 2008 Deployment<br />
November 13-14, 2008 Boulder, CO <strong>HMT</strong> Mini-Workshop on FFMP<br />
May 22–23, 2008 Sacramento, CA Annual Meeting of the <strong>HMT</strong> Advisory Panel<br />
May 20–21, 2008 Sacramento, CA <strong>HMT</strong> Research to Operations (R-to-O)<br />
Workshop<br />
December 2007 to March 2008 American River Basin, California <strong>HMT</strong>-West 2008 Field Deployment,<br />
Building on <strong>HMT</strong>-West 2007 Deployment<br />
June 2007 Sacramento, California Meeting of <strong>HMT</strong> Advisory Panel [pdf]<br />
December 2006 to March 2007 American River Basin, California <strong>HMT</strong>-West 2007 Field Deployment,<br />
Building on <strong>HMT</strong>-West 2006 Deployment<br />
September 2006 National Full-time <strong>HMT</strong> Project Manager Appointed<br />
June 2006 Sacramento, California Third <strong>NOAA</strong> <strong>HMT</strong> Planning Meeting [pdf]<br />
December 2005 to March 2006 American River Basin, California <strong>HMT</strong>-West 2006 Field Deployment,<br />
First full-scale deployment for <strong>HMT</strong>-West<br />
August 2005 Camp Springs, MD Establishment of the NCEP HPC component of<br />
the <strong>HMT</strong><br />
March 2005 Washington, D. C. Second <strong>NOAA</strong> <strong>HMT</strong> Planning Meeting<br />
December 2004 to March 2005 American River Basin, California <strong>HMT</strong>-West 2005 Field Deployment,<br />
Preliminary deployment for <strong>HMT</strong>-West<br />
December 2003 to March 2004 Russian River Basin, California <strong>HMT</strong>-2004 Field Deployment,<br />
More Refined <strong>HMT</strong> Prototype<br />
December 2002 to March 2003 Russian River Basin, California PACJET-2003 Field Deployment,<br />
First <strong>HMT</strong> Prototype<br />
November 2002 Washington, D. C. First <strong>NOAA</strong> <strong>HMT</strong> Planning Meeting [pdf]<br />
December 2001 to March 2002 Offshore and along the Washington, Oregon<br />
and California coastlines--base of operations in<br />
Portland, Oregon<br />
PACJET-2002 Field Experiment<br />
October 2001 Monterey, California Workshop with West Coast operational<br />
forecasting and forecast end-user communities<br />
[pdf]<br />
December 2000 to March 2001 Offshore and along the California, Oregon and<br />
Washington coastlines--base of operations in<br />
Monterey, California<br />
PACJET-2001 Field Experiment<br />
September 1999 Monterey, California Workshop with West Coast operational<br />
forecasting community<br />
December 1997 to March 1998 Offshore and along the California coastline—<br />
base of operations in Monterey, California<br />
CALJET Field Experiment
<strong>HMT</strong> Science & Services Implementation Plan Introduction<br />
1.5.1 Scientific & Technical Accomplishments<br />
<strong>HMT</strong> has contributed to significant advances in our understanding of processes leading to extreme rainfall in<br />
complex terrain. In particular, <strong>HMT</strong> has:<br />
• Documented and characterized atmospheric river structure and its importance to flooding and water<br />
supply; and has identified associated moisture flux thresholds leading to heavy precipitation<br />
• Quantified non-bright-band rain, which produces ~25-35% of total precipitation in key areas and yet is<br />
very shallow, often beneath the current radar coverage<br />
• Developed a technique using normalized anomalies of precipitable water and moisture flux fields, as<br />
predictors of extreme precipitation<br />
A Coastal Atmospheric River Monitoring & Early Warning System has been developed. This system<br />
integrates state-of-the-art observations and modeling to provide a tool to monitor, predict and diagnose<br />
atmospheric river enhanced precipitation, and:<br />
• Uses advanced observations to monitor conditions<br />
• Uses specialized, high-resolution models for forecasts<br />
• Uses thresholds derived from scientific work on ARs for:<br />
o Low-level winds (observed by wind profilers)<br />
o Vertically integrated water vapor (from GPS-Met)<br />
o Derived “bulk moisture flux” threshold (combines GPS-Met and profiler observations)<br />
• Is available in real time<br />
<strong>HMT</strong> has developed state-of-the-art precipitation analyses in complex terrain, utilizing both standard and<br />
polarimetric radar observations; surface gauge data; and specific vertical profile of reflectivity (VPR)<br />
adjustments to correct for the bright band. These methodologies are required for:<br />
• DMIP-2 evaluations of various streamflow models; including and especially next- generation distributed<br />
hydrologic models<br />
• Verification of high-resolution QPF in complex terrain<br />
There have also been a number of observing system technology advances, including:<br />
• The development of low-cost, snow level radar<br />
• The invention of atmospheric river observatories (AROs)<br />
• Creation of a transportable ARO<br />
• Deployment of level loggers for stream depth (University of Washington-led)<br />
• Deployment of unique temperature sensor array (University of Washington-led)<br />
• Development of soil moisture measurement network methodologies<br />
• Automated rain sampler for isotope measurements (USGS-led); used to ascertain the origin and history<br />
of precipitation<br />
• Development of advanced radar techniques, including polarimetric QPE algorithms; polarimetric<br />
attenuation correction algorithms (for X-band radars); and VPR techniques to account for bright-band<br />
contamination and/or beams in the snow above the bright band<br />
Additionally, a number of observing system assessments have been conducted, leading to evaluations of:<br />
• The ability of the COSMIC satellite to measure AR conditions offshore (including profiles of moisture)<br />
• A new integrated IWV satellite product, which allows better tracking of ARs (useful for QPF)<br />
• Integrated ocean observing system evaluations of coastal profiler technology<br />
o 915 MHz versus 449 MHz profiler with RASS<br />
• Polarimetric radar testing (helps in preparation for dual-pole implementation on NEXRAD)<br />
11
<strong>HMT</strong> Science & Services Implementation Plan Introduction<br />
<strong>HMT</strong> research has shown that most extreme rainfall events on the West Coast are associated with ARs.<br />
Building on a variety of developments through <strong>HMT</strong>, a “Pacific Atmospheric River Threat Index” (PARTI)<br />
is under development. The PARTI will combine offshore (i.e. satellite) and/or near-shore observations with<br />
data from numerical weather prediction models, to provide a quantitative assessment of the risk for extreme<br />
precipitation. The prototype being developed, is analogous to current hurricane practices; the PARTI will<br />
give a numeric measure of risk (an index), as well as an indication of which areas are most likely to be<br />
affected and when.<br />
<strong>HMT</strong> has led to the development of prototype, or demonstration, performance measures: these measures<br />
provide:<br />
• A new measure for extreme QPF: Current verification of precipitation forecasts to not adequately<br />
account for extreme events. Initially developed on the West Coast, the technique is now applicable<br />
across the entire United States.<br />
• A new measure to track snow level forecasts: In complex terrain, small changes in the elevation at<br />
which rain turns into snow, can produce significant changes in runoff. Prior to this, a performance<br />
measure for snow level forecasts did not exist.<br />
Peer-reviewed publications are an important metric of success in any scientific endeavor, and they provide<br />
both documentation of and credibility to the effort. To date, there have been forty-four <strong>HMT</strong>-related peerreviewed<br />
journal articles published since the year 2000. Appendix B provides an analysis of the growing<br />
body of literature that comprises the <strong>HMT</strong> bibliography.<br />
1.5.2 Transition to Operations & Training<br />
Now in the fourth full year of operations, the <strong>HMT</strong> has produced a number of transition projects that are<br />
underway or are being initiated. A number of these have been enabled through the EFREP partnership with<br />
the State of California, which sought to implement key findings from <strong>HMT</strong>. They include:<br />
• Installation of new GPS-Met sites<br />
• Installation of soil moisture networks<br />
• A snow level radar network<br />
• The deployment of the a scanning radar system by the KPIX television station in San Francisco (driven<br />
by results from a <strong>NOAA</strong> gap-filling radar demonstration on the coast, north of San Francisco)<br />
• A mesoscale ensemble modeling system (distributed local modeling), providing basin scale, probabilistic<br />
forecasts of QPF<br />
• A decision support tool for extreme QPF<br />
• A Pacific Atmospheric River Threat Index (PARTI): a decision support tool, incorporating observations<br />
and model information providing guidance on the severity and land-falling track of atmospheric rivers<br />
• Normalized water vapor flux anomalies for extreme QPF<br />
• TIGGE ensemble QPF effort<br />
• Enabling DMIP-2 activities, through state of the art QPE products<br />
• Establishing new performance measure for extreme QPF<br />
• Establishing new performance measure for snow level<br />
There have also been a number of NRC reports and articles published in the Bulletin of the American<br />
Meteorological Society intertwined with <strong>HMT</strong> — i.e., either using or recommending <strong>HMT</strong> results, concepts<br />
or approaches.<br />
NRC:<br />
• Flash Flood Forecasting Over Complex Terrain: With an Assessment of the Sulphur Mountain NEXRAD<br />
in Southern California (2005)<br />
• <strong>NOAA</strong>'s Role in Space-Based Global Precipitation Estimation and Application (2007)<br />
12
<strong>HMT</strong> Science & Services Implementation Plan Introduction<br />
• Observing Weather and Climate From the Ground Up: A Nationwide Network of Networks (2009)<br />
BAMS:<br />
• Improving short-term (0-48 h) cool season quantitative precipitation forecasting: Recommendations<br />
from a USWRP workshop (Ralph et al. 2005)<br />
• Improving Quantitative Precipitation Forecasts in the Warm Season: A USWRP Research and<br />
Development Strategy (Fritsch and Carbone 2004)<br />
• Multifunctional Mesoscale Observing Networks (Dabberdt et al. 2005)<br />
• Research: The Helsinki Mesoscale <strong>Testbed</strong>: An Invitation to Use a New 3-D Observation Network<br />
(Dabberdt et al. 2005a)<br />
• Joint <strong>NOAA</strong>/NWS/USGS Prototype Debris Flow Warning System for Recently Burned Areas in Southern<br />
California (Restrepo et al. 2008)<br />
1.5.3 <strong>Program</strong>matic & Organizational Accomplishments<br />
The creation of <strong>HMT</strong> (as outlined in the previous section) is, in and of itself, a significant accomplishment:<br />
it represents one bridge across the gulf between operations and research. In the process of establishing the<br />
testbed, <strong>HMT</strong> strengthened ties between <strong>NOAA</strong> Line Offices and played an enabling role in a number of<br />
programmatic areas:<br />
• The American River Basin was selected for testing of next generation hydrologic models within the<br />
NWS/OHD-led Distributed Model Intercomparison Project-2 (DMIP-2) based on the recognized need<br />
to address conditions with complex terrain and snow, and the fact that <strong>HMT</strong> was being implemented on<br />
the American River and would provide unique "forcing" data for the testing of many models from the<br />
broader hydrologic community:<br />
• An OAR-NWS/OHD partnership was established on state-of-the-art hydrologic forcing data sets<br />
(precipitation, soil moisture and temperature, etc.) from <strong>HMT</strong> for DMIP-2<br />
• USWRP investments in QPF:<br />
o Develop new performance measure for extreme QPF<br />
o Provide grants via CSTAR for QPF<br />
o Provide grants leveraging NASA-<strong>NOAA</strong> Global Precipitation Measurements (GPM) Mission<br />
o Creates new focus at DTC on QPF in partnership with <strong>HMT</strong><br />
• <strong>HMT</strong>-West has triggered other regional efforts within <strong>HMT</strong>:<br />
o Mini <strong>HMT</strong>-Arizona soil moisture and temperature network operational Mini <strong>HMT</strong>-Upper<br />
Colorado soil moisture and temperature network is being deployed<br />
o <strong>HMT</strong>-Southeast actively being planned<br />
o <strong>HMT</strong>-Northwest being considered<br />
• <strong>HMT</strong> has helped elevate water resources research and forecasting as a <strong>NOAA</strong> Priority:<br />
o IWRS Priority Area established for all of <strong>NOAA</strong><br />
o Integrated Water Forecasting <strong>Program</strong> created within W&W<br />
• <strong>HMT</strong> has created a long-term approach to linking research and operations:<br />
o Redirected OAR lab base to focus long-term on precipitation<br />
o Built partnerships between OAR’s weather labs<br />
o Established a management system involving OAR and NWS<br />
• The traditional research field experiment had one major field season. <strong>HMT</strong> has established a new<br />
approach:<br />
o <strong>HMT</strong> is multiyear, rather than the typical 1–3 month duration<br />
o Instead of having everyone continuously in the field, <strong>HMT</strong> developed a forecast-based strategy<br />
for sending staff into the field only when weather conditions were suitable (captured 90% of<br />
the events at less than half the typical cost)<br />
13
<strong>HMT</strong> Science & Services Implementation Plan Introduction<br />
14<br />
• <strong>HMT</strong> uses field equipment that is mostly unattended and thus less expensive<br />
• SHARE experiment designed and proposed to NSF<br />
• Debris flow prediction pilot study built on <strong>HMT</strong>-W experience, tools and teams<br />
• CalWater experiment to determine the impact of aerosols on precipitation and the role of atmospheric<br />
rivers in water supply and flooding (sponsored by <strong>NOAA</strong> and California Energy Commission)<br />
• The California Department of Water Resources, Enhanced Flood Response and Emergency Preparedness<br />
(EFREP) project is implementing key results and findings from <strong>HMT</strong> in CA (an <strong>HMT</strong> Legacy activity)<br />
• ARkStorm emergency preparedness scenario being developed with USGS<br />
• <strong>NOAA</strong>’s UAS project is testing applications for west coast storms and associated atmospheric rivers<br />
• <strong>NOAA</strong> UAS project is sponsoring development of a dropsonde capability for NASA’s Global Hawk<br />
partly to monitor ARs in connection with <strong>HMT</strong><br />
1.6 Lessons Learned from <strong>HMT</strong>-West<br />
The <strong>HMT</strong>-Southeast planning process has benefited from the “lessons learned” in <strong>HMT</strong>-West. These lessons<br />
about developing and executing a testbed are summarized below:<br />
• Seek to gain a clear vision for a successful outcome up front, and firmly control testbed activities from<br />
the beginning, with a clear connection to operations defined for each activity – i.e. how that information<br />
would potentially be utilized and what specific deliverables may result<br />
• Establish performance metrics and clear baselines for improvement<br />
• Staff involvement and buy-in at the operational level are very important for success, so they should be<br />
involved early i.) to help identify where improvements are needed and current performance baselines;<br />
ii.) to vet proposed testbed activities; iii.) and to engage the operational staff in the instrument<br />
deployments and experimental design, etc., whenever/where possible<br />
• Frequently re-evaluate progress and the viability of existing subprojects, don’t hesitate to cease efforts<br />
when circumstances dictate<br />
• Keep a focused scope and don’t be tempted to overreach: it is better to do a few things well than to take<br />
on overly ambitious projects<br />
• As appropriate, concentrate or focus on the observational network, targeting specific basins<br />
• Transition issues have been <strong>HMT</strong>’s biggest challenge – a “Research-to-Operations (R2O) Workshop”,<br />
held in May, 2008 was a very important follow-up activity, allowing us to weave insights/successes from<br />
<strong>HMT</strong>-West into operations<br />
• A long-term (multiyear) commitment is required to allow the research and development cycle to mature<br />
and for sufficient demonstration efforts to be conducted<br />
• While daily communications are important during field operations, calls should be kept focused and of<br />
minimum duration. Interesting or otherwise important cases should be debriefed within a short period<br />
of time after an IOP concludes. Scientific staff should visit NWS field offices during operations to gain<br />
an understanding and appreciation of operational pressures and procedures. Focused “mini workshops”<br />
(with a dozen or so people), have been an effective method of exchange between research and operations<br />
staff<br />
• Engaging other federal partners, state and local agencies and stakeholders has been important to the<br />
success of <strong>HMT</strong>
<strong>HMT</strong> Science & Services Implementation Plan Science Plan and Management<br />
2 <strong>HMT</strong> Science Plan & Management<br />
2.1 Goals and Objectives<br />
<strong>HMT</strong> is founded on the vision that a water-aware public will benefit from improved water resource services.<br />
One aspect of the <strong>HMT</strong> mission is to demonstrate that the development and regional deployment of advanced<br />
sensors and monitoring technologies, coupled with numerical models and decision support systems, can<br />
improve <strong>NOAA</strong>’s capacity for providing earlier and more accurate forecasts. These forecasts would yield<br />
increased flood warning lead times and result in better water resource management and drought mitigation.<br />
The general goal is to develop, test, and demonstrate new methods and tools that improve <strong>NOAA</strong>'s<br />
hydrometeorological services, including quantitative precipitation estimation (QPE) and forecasting (QPF),<br />
streamflow predictions, flood warnings and drought monitoring. Those prototypes that prove effective in<br />
focused demonstrations, both technically and practically, are then transitioned into <strong>NOAA</strong> forecast operations<br />
and information services. Accurate, high-resolution precipitation and soil moisture information are common<br />
denominators required for each of these services and they represent a major focus of <strong>HMT</strong>, along with<br />
improved understanding of the physical processes governing precipitation.<br />
<strong>HMT</strong> yields research findings and field-tested methods that can be implemented into <strong>NOAA</strong>'s operational<br />
forecast and information services. These include improved algorithms, better models, new observations<br />
or better use of existing observations, and forecaster training modules describing new tools or physical<br />
understanding. A key output of <strong>HMT</strong> is an accurate description of the spatio-temporal distribution of<br />
precipitation over carefully selected pilot study watersheds. These observations are then used to evaluate<br />
existing and new forecast models (e.g., the WRF model; being developed for use at ERSL, NCEP and<br />
elsewhere) and other forecast tools (e.g., Mountain Mapper; used at River Forecast Centers to downscale<br />
NCEP/HPC's QPF products over mountains), as well as those needed for the NWS Watch-Warning System<br />
(e.g., QPE SUMS; being tested at River Forecast Centers) and streamflow forecasting system (e.g., DMIP; a<br />
study to assess candidates for <strong>NOAA</strong>'s next-generation streamflow forecast model).<br />
<strong>HMT</strong> is linked to research activities external to <strong>NOAA</strong>, including partners in Joint Institutes, such as the<br />
"Water-in-the-West" effort at CIRES, and through interagency partners such as in the USWRP (e.g., the<br />
USWRP Cool-Season QPF Implementation Plan identifies the establishment of a national <strong>HMT</strong> infrastructure<br />
at <strong>NOAA</strong> as a leading priority). Two other examples where <strong>NOAA</strong> is extending its suite of services are<br />
the development of water quality forecasts (jointly with EPA) and a debris flow watch-warning system<br />
(jointly with USGS). A common denominator of these needs is the requirement for accurate water quantity<br />
information, a need that <strong>HMT</strong> helps <strong>NOAA</strong> meet.<br />
The <strong>HMT</strong> payoffs include:<br />
• Accelerated development of those prototype methods and tools that hold the greatest promise to<br />
improve <strong>NOAA</strong>'s hydrological and hydrometeorological services<br />
• Pilot studies to accelerate the transition of proven methods into forecast operations and information<br />
services. The tests and demonstrations are planned and conducted jointly by research and operations<br />
partners, in collaboration with external forecast users.<br />
• Improvements in scores on <strong>NOAA</strong>'s operational Government Performance Requirements Act (GPRA)<br />
goals in QPF and flood warnings, after a transition to operations<br />
• New or improved baselines and performance measures to provide a more accurate assessment of<br />
<strong>NOAA</strong>’s ability to monitor and predict precipitation and runoff.<br />
• Socio-economic benefits accrued through improved decision making, e.g., better QPF can help<br />
15
<strong>HMT</strong> Science & Services Implementation Plan Science Plan and Management<br />
16<br />
reservoir operators balance flood control against competing needs for water resources. Development<br />
of forecast-based reservoir operations on one key watershed alone is projected to save 60,000 acre feet<br />
of water for later use, without compromising flood control.<br />
2.1.1 Goals<br />
The primary goals of the <strong>HMT</strong> <strong>Program</strong> are to:<br />
• Provide a foundation of technology and experience that will improve <strong>NOAA</strong>’s capabilities for flood<br />
warnings and water management<br />
• Evaluate the viability of advanced technologies deployed at the regional scale for precipitation<br />
estimation and forecasting<br />
• Demonstrate the effectiveness of coordinated multiagency operations (federal, state and local) for<br />
flood warnings and water management<br />
• Create a framework so that interdisciplinary and inter- and intra-agency collaborative research and<br />
demonstration can be conducted<br />
2.1.2 Objectives<br />
Specific objectives of the <strong>HMT</strong> <strong>Program</strong> are derived from the major activity (or application) areas, and<br />
include the following:<br />
• Quantitative precipitation estimation (QPE)<br />
o Provide a more complete picture of extreme precipitation events through deployment of an<br />
expanded rain gauge network, a disdrometer network, profiling and scanning radars, and<br />
implementation of intensified upper-air observations<br />
o Test new methods for deriving precipitation from more commonly available remote observing<br />
platforms<br />
o Determine the impact of these QPEs in hydrologic models<br />
• Quantitative precipitation forecasts (QPF)<br />
o Develop and demonstrate procedures for high spatial and temporal resolution ensemble<br />
mesoscale models covering the <strong>HMT</strong> operations domain<br />
o Determine the impact of these QPFs in hydrologic models<br />
o Deploy and evaluate methods for remote access to large data sets across NWS and partner<br />
agencies<br />
• Snow Level and Surface Snow Information<br />
o Characterize snow level (SL) and snow-water equivalent (SWE) to help deal with the issues of<br />
hydrometeorological forecasting, water management, and flood control<br />
o Design and deploy advanced sensors for snow level (SL) nowcasting and forecast verification<br />
• Hydrologic Application<br />
o Provide hydrologic evaluation of advanced observations of rain and snow, temperature, soil<br />
moisture, and other variables in the context of real-time operational forecasting at CNRFC<br />
o Provide a venue to address broader science questions for hydrologic forecasting in<br />
mountainous areas based on R&D in the North Fork American River, including the Distributed<br />
Model Intercomparison Project – Phase 2 (DMIP-2)<br />
o Support the Integrated Water Resources Services (IWRSS) project in Arizona through<br />
deployment of soil moisture and meteorological sensors.<br />
o Provide <strong>HMT</strong> QPF and other data sets to the southern California WFOs Flash Flood<br />
Monitoring <strong>Program</strong> (FFMP) in support of debris flow warnings in fire burn areas<br />
• Debris Flow<br />
o Provide <strong>HMT</strong> enhanced QPE, QPF and associated observations and high-resolution modeling
<strong>HMT</strong> Science & Services Implementation Plan Science Plan and Management<br />
products to support debris flow guidance for the FFMP application<br />
• Verification<br />
o Develop and apply verification methods that allow quantifiable assessments of improvements<br />
in forecast skill for QPF, hydrologic, and snow level forecasts<br />
o Develop baseline performance measures of precipitation and related processes<br />
• Decision Support Tools<br />
o Demonstrate the efficacy of decision support tools placed in actual forecasting and hazardous<br />
event warning operations. This category of <strong>HMT</strong> activities includes:<br />
• Flash Flood Monitoring and Prediction (FFMP)<br />
• Forecaster Workstation Upgrades Using Advanced Linux Prototype System (ALPS)<br />
• Gridded Forecast Editor (GFE)<br />
• Integrated Water Resources Science and Services (IWRSS)<br />
2.2 Implementation Strategy<br />
The success of <strong>HMT</strong> depends on the quality of research conducted, the number and quality of publications<br />
and reports produced (thus building credibility), and the number of systems prototyped and demonstrated<br />
in an operational setting. <strong>HMT</strong> also seeks to transfer and integrate this leading edge technology and<br />
understanding from <strong>NOAA</strong>’s research centers to <strong>NOAA</strong>’s operation centers. While many aspects of this<br />
transfer remain beyond the control of <strong>HMT</strong>’s partners, <strong>HMT</strong> will endeavor to facilitate and enable this<br />
process.<br />
Thus the research-to-operations (R-to-O), and related operations-to-research (O-to-R), paradigm is the<br />
backbone of <strong>HMT</strong>’s Implementation Strategy. The scope of this effort engages expertise that resides both<br />
within <strong>NOAA</strong> Research and the National Weather Service and outside of the immediate <strong>NOAA</strong> community.<br />
2.2.1 Building Partnerships Across <strong>NOAA</strong><br />
ESRL provides the home base for <strong>HMT</strong> with major involvement of the Physical Sciences Division (PSD) and<br />
the Global Systems Division (GSD).<br />
• Physical Sciences Division: QPE, QPF, observing systems, model diagnostics, physical processes,<br />
Weather-Climate Connection, extreme events research and microphysics<br />
• Global Systems Division: Data assimilation and coupling with models<br />
<strong>HMT</strong> integrates ESRL capabilities in the following areas: use of experimental field data to diagnose errors<br />
in operational models, forecaster training, observing systems, mesoscale numerical modeling, and weatherclimate<br />
connections.<br />
The diversity of talent and expertise across <strong>NOAA</strong> is being harnessed in <strong>HMT</strong> by building partnerships<br />
that break down traditional ‘stovepipes’. The problems that <strong>HMT</strong> addresses require creative thinking with<br />
innovative solutions. The cross-discipline structure of <strong>HMT</strong> includes researchers and forecasters talking on<br />
equal ground and overcoming constraining administrative structures to achieve new working relationships<br />
that are time efficient and effective in realizing improved water services.<br />
Other partners in OAR, NWS, and NESDIS complement and enhance ESRL capabilities. There is a critical<br />
need for coordination of these diverse capabilities and roles across <strong>NOAA</strong>. The existence of <strong>HMT</strong> as an<br />
integrating theme at ESRL helps fill this gap, through both leadership and technical expertise, and provides an<br />
important capability to help <strong>NOAA</strong> address the critical area of water resources.<br />
Examples of building partnerships across <strong>NOAA</strong> are summarized below. Of primary significance are the<br />
17
<strong>HMT</strong> Science & Services Implementation Plan Science Plan and Management<br />
strong partnership relations established with the <strong>NOAA</strong> agencies charged with operations responsibilities –<br />
the River Forecast Centers (RFC) and Weather Forecast Offices (WFO)<br />
18<br />
• <strong>NOAA</strong> Coastal Services Center (CSC)<br />
• NWS Office of Hydrologic Development (OHD: Leadership on hydrology research and system<br />
development (CHPS), Distributed Model Intercomparison Project (DMIP), Debris Flow <strong>Program</strong><br />
• NWS NCEP/Hydrometeorological Prediction Center, Environmental Modeling Center: QPF,<br />
including precipitation amount and type<br />
• NWS OCWWS: Snow cover, and hydrometeorology requirements<br />
• NWS OST: FFMP and debris flow<br />
• NWS Western, Eastern and Southern Region Headquarters: for regional coordination<br />
• NWS California/Nevada River Forecast Center: QPE/QPF, observing system and decision support<br />
evaluation<br />
• NWS Monterrey, Sacramento, Reno, and Eureka WFOs: Watch-warning program/flash flooding, QPE/<br />
QPF, observing system and decision support evaluation<br />
• NESDIS: Satellite data records for model initialization: clouds, radiation, ice phase<br />
• National Severe Storms Lab: QPE, observing systems<br />
Matrix Planning<br />
Coordination within <strong>NOAA</strong>, is facilitated by <strong>NOAA</strong>’s Planning, <strong>Program</strong>ming, Budgeting, and Execution<br />
System (PPBES). <strong>HMT</strong> resides within the Weather & Water Goal, Science, Technology and Infusion (ST&I)<br />
<strong>Program</strong>. These programmatic activities have been coordinated with the Integrated Water Forecasting (IWF,<br />
formerly Hydrology) <strong>Program</strong> and with a mutual awareness of the Local Forecasts and Warning <strong>Program</strong>.<br />
Regional coordination has occurred through the <strong>NOAA</strong> Integrated Water Resource Services-Priority Area<br />
Task Team (IWRS-PATT), and more recently with the Southeast and Caribbean Regional Team (SECART).<br />
2.2.2 The <strong>HMT</strong> Concept: <strong>Testbed</strong> as a Process<br />
The <strong>HMT</strong> concept consists of a process of continuously iterating around a test and refinement loop as<br />
diagramed in Figure 2.1, to improve and eventually make new methods operational. This embodies the<br />
R-to-O, O-to-R philosophy articulated above. The test and refinement loop includes these steps:<br />
• Develop and introduce new ideas, data, etc.<br />
• Experiment, prototype, and demonstrate<br />
• Verify<br />
• Assess impact<br />
• Revise and iterate the “good”; terminate some<br />
activities*<br />
Ultimately, the outputs of the testbed process are<br />
methods or technologies that can be put into operation by<br />
NWS, NOS, OAR, and state and local agencies. *Note<br />
that there are a number of reasons why an activity should<br />
be ended, such as reprioritization of resources, costeffectiveness,<br />
feasibility, negative results, or when a new<br />
solution presents itself and replaces old capabilities, etc.<br />
This applies to both research and to operations.<br />
Figure 2.1 <strong>Testbed</strong>s are a process to get ideas off of the drawing<br />
table and into operations (Dabberdt et al. 2005b). This feedback<br />
process encapsulates both the R-to-O and the O-to-R aspects of<br />
this problem.
<strong>HMT</strong> Science & Services Implementation Plan Science Plan and Management<br />
2.2.3 National <strong>Testbed</strong> Strategy with Regional Implementations<br />
Each region of the country is characterized<br />
by unique hydrometeorological issues<br />
and therefore poses unique challenges.<br />
<strong>NOAA</strong> has more generally embraced<br />
this concept of regional environmental<br />
issues through its Regional Collaboration<br />
effort and crosscutting task teams (http://<br />
www.ppi.noaa.gov/PPI_Capabilities/<br />
regional_collaboration.html). However,<br />
with limited resources, it is not possible<br />
to address all of the regionally driven<br />
hydrologic forecasting problems facing the<br />
nation simultaneously. Therefore, the <strong>HMT</strong><br />
<strong>Program</strong> is a national testbed strategy with<br />
regional implementation of testbed projects.<br />
Figure 2.2 The <strong>HMT</strong> <strong>Program</strong> is a national testbed strategy that is being<br />
implemented through regional testbed projects across the U.S.<br />
In practice, this means that resources are focused in one, representative region of the country to solve the<br />
hydrometeorology problems in that region for several years. Then, the focus is shifted to another region of<br />
the country while maintaining a continued (or legacy) effort in the original focus region. The legacy mode of<br />
testbed operations ensures that there is cross-pollination between testbeds and helps to facilitate transitions to<br />
operations. Figure 2.2 shows a map of the U.S. identifying three focus Projects: <strong>HMT</strong>-West, <strong>HMT</strong>-Southeast,<br />
and <strong>HMT</strong>-“Next”. The <strong>HMT</strong>-West region has been defined and the ongoing operations have been conducted<br />
for several years. The <strong>HMT</strong>-Southeast project is currently in the planning phase, and will be located in the<br />
region anchored by the Carolinas (e.g. the Tar and the Neuse River Basins in North Carolina); and the <strong>HMT</strong>-<br />
“Next” Project is presented in the north-central US to illustrate the concept, but the specific region of this<br />
testbed remains to be determined.<br />
2.2.4 Other Partnerships and Interagency Synergism<br />
The partnership approach is extended to other federal, state, and local agencies. For example, on the federal<br />
level, <strong>HMT</strong>-West has developed working relations with the U.S. Army Corps of Engineers and the U.S.<br />
Bureau of Reclamation who are the primary agencies charged with operations of the major reservoirs in the<br />
Sacramento River Basin. The Folsom Dam and reservoir is the primary flood control facility located on the<br />
American River just upstream of Sacramento, CA. Partnerships are now being established in the Southeast<br />
as well. In addition to the aforementioned, some of the key external collaborations that have been established<br />
are:<br />
• California Department of Water Resources (DWR)<br />
• California Energy Commission (CEC)<br />
• Renaissance Computing Institute (RENCI) of North Carolina<br />
• Sacramento Area Flood Control Administration (SAFCA)<br />
• Scripps Institute of Oceanography<br />
• Sea Grant<br />
• US Army Corps of Engineers<br />
• U.S. Bureau of Reclamation<br />
• US Geological Survey<br />
A number of collaborations have arisen amongst various academic institutions as well.<br />
19
<strong>HMT</strong> Science & Services Implementation Plan Science Plan and Management<br />
EFREP – An <strong>HMT</strong> Legacy<br />
At the state level, <strong>HMT</strong> has joined with the California<br />
Department of Water Resources (DWR) to conduct<br />
the Enhanced Flood Response and Emergency<br />
Preparedness (EFREP) effort, a partnership between<br />
the CA Department of Water Resources, <strong>NOAA</strong> and<br />
the Scripps Institute of Oceanography, helping to<br />
implement several key findings from the <strong>NOAA</strong> <strong>HMT</strong>-<br />
West project in California:<br />
Observing Networks:<br />
• GPSMet sensors to track moisture as it moves<br />
inland off of the Pacific Ocean – the fuel for<br />
extreme precipitation<br />
• Snow level radars to monitor the elevation of<br />
the rain-snow line<br />
Figure 2.3 <strong>HMT</strong> EFREP ensemble-based system workflow.<br />
• Soil moisture sensors to track antecedent<br />
conditions for flooding and monitor surface<br />
conditions during droughts<br />
Modeling:<br />
• High-resolution ensemble (probabilistic) forecasts of precipitation<br />
• Coupled to hydrologic models<br />
These are key elements from tier-one of a four-tiered proposal. This is the vision for the ensemble-based<br />
hydromet decision support system described by Schneider, et al. (2008) for the EFREP (Figure 2.3). The<br />
Project Manager for EFREP, is Dr. Allen White.<br />
The five-year EFREP plan builds on the <strong>HMT</strong> <strong>Program</strong> and is enabling part of the <strong>HMT</strong>-West Legacy.<br />
CalWater<br />
Another developing partnership with the California Energy Commission and Scripps Institute of<br />
Oceanography, called CalWater, is seeking to understand key elements of the impacts of climate change on<br />
weather and water. CalWater builds on the <strong>HMT</strong>-West framework examining the fundamental roles that (1)<br />
atmospheric aerosols (chemistry) and (2) atmospheric rivers (physical processes) play in changing patterns<br />
and intensity of precipitation in California.<br />
2.2.5 Linkages to Demonstration Performance Measures<br />
As discussed in section 1.1, performance measures help <strong>NOAA</strong> testbeds link science and technology<br />
advances to service improvements. By virtue of the Government Performance Requirements Act (GPRA),<br />
<strong>NOAA</strong> is required to report to Congress annually on a specified set of corporate performance measures.<br />
By their very nature, these measures tend to be conservative in nature and limited in scope, and are thus<br />
inadequate metrics for research programs. Nevertheless they remain important corporate metrics, and must<br />
be considered. <strong>Testbed</strong>s provide a framework within which formal GPRA measures can coexist with new<br />
or refined demonstration measures; <strong>NOAA</strong> testbeds are designed to address requirements of the GPRA in a<br />
pyramid manner founded on “Science” and “Technology” performance measures, building to “Infusion” and<br />
“Demo” measures, and ultimately supporting formal <strong>NOAA</strong> GPRA performance measures (Figure 2.4a).<br />
<strong>HMT</strong> provides a framework to accelerate improvements in existing <strong>NOAA</strong> Corporate GPRA measures and to<br />
develop new GPRA measures. For example, consider Figure 2.4b which is stated here in terms specific to the<br />
science and technologies for QPF. The work described under each of the seven major activity areas in section<br />
4, is building towards specific performance measures for the various <strong>HMT</strong> demonstration activities.<br />
20
<strong>HMT</strong> Science & Services Implementation Plan Science Plan and Management<br />
a b<br />
Figure 2.4 (a) Performance measures help <strong>NOAA</strong> testbeds link science and technology advances to service improvements. (b) An example<br />
of research, demonstration and formal GPRA performance measures.<br />
2.3 Research to Operations and<br />
Technology Infusion<br />
Research to operations (R-to-O) is one of the more<br />
challenging aspects of <strong>HMT</strong> for a number of welldocumented<br />
reasons, including the wide scope of<br />
tools and knowledge to be transitioned (ranging from<br />
a simple algorithm to a complex piece of equipment<br />
to be deployed in the field), cultural differences and/<br />
or differences in roles and responsibilities between<br />
the research and operations communities, and<br />
considerations of funding.<br />
The intent of R-to-O and technology infusion is to<br />
transition experimentally mature hydrometeorology<br />
information tools, methods, and processes, including<br />
computer-related applications (e.g. web interfaces,<br />
visualization tools), from research mode into settings<br />
where they may be applied in an operational and<br />
sustained manner. At present, the role of <strong>HMT</strong> in<br />
R-to-O is to develop prototypical systems, iteratively<br />
improve them with feedback from the operational<br />
community, and in some cases stakeholders, and<br />
demonstrate them in an operational setting, while<br />
building the business and requirements drivers to<br />
justify the new tool or technique. Presently a set of<br />
terms of references (TOR) are being developed that<br />
will further clarify and define <strong>HMT</strong>’s role in R-to-O,<br />
as well as how OAR and the NWS can better partner<br />
on <strong>HMT</strong> transition issues.<br />
2.4 <strong>HMT</strong> Management<br />
The <strong>HMT</strong> management structure combines a broad<br />
national view with focused regional views to address<br />
<strong>NOAA</strong> Partnering with KPIX TV Station, San<br />
Francisco, CA<br />
Posted: March 13, 2007<br />
<strong>NOAA</strong> has partnered with KPIX-TV (CBS-5) to pave new<br />
ground. KPIX, the San Francisco area CBS television<br />
owned and operated station, has installed the first private<br />
weather radar in the region. This radar fills a critical<br />
gap in the <strong>NOAA</strong> NEXRAD coverage in this region. The<br />
"gap" exists because of the complex terrain in this area,<br />
which obstructs radar beams, the location of existing<br />
operational radars and the minimum scanning elevation<br />
allowed on the operational radars. The weather that<br />
affects this region comes in low off the Pacific Ocean,<br />
literally under the radar. Because of its location and<br />
its ability to scan at low elevation angles, the KPIX<br />
radar can "see" the incoming weather. This augments<br />
the region's NEXRAD network and gives the National<br />
Weather Service (NWS) forecasters in the Monterey<br />
office a big advantage.<br />
An <strong>HMT</strong> pilot study helped to demonstrate the need<br />
for gap-filling radars in this region. These developments<br />
surrounding the KPIX radar constitute another first: this<br />
can be considered the first research to operations success<br />
story for a major observational facility from the <strong>HMT</strong>, a<br />
fitting outcome from the <strong>HMT</strong> Pilot Study.<br />
The first 0-degree<br />
elevation reflectivity<br />
data from the KPIX<br />
radar on Feb. 22,<br />
2007. The San<br />
Francisco Bay is<br />
in the center of the<br />
image.<br />
21
<strong>HMT</strong> Science & Services Implementation Plan Science Plan and Management<br />
the multidimensional nature of the water cycle. Executive<br />
oversight of <strong>HMT</strong> is provided by the <strong>HMT</strong> Management<br />
Council, whereas the <strong>HMT</strong> Project Manager provides dayto-day<br />
leadership on the program. Given the growth of the<br />
program, it was recognized that a new advisory structure was<br />
needed to support the management team (Figure 2.5). New<br />
developments include a smaller, but more broadly focused<br />
<strong>HMT</strong> Advisory Panel; Regional Implementation Teams,<br />
enabling regional focus areas to be developed and studied<br />
and facilitating R2O; the identification of an <strong>HMT</strong> Chief<br />
Scientist; and finally the creation of a new position, the <strong>HMT</strong><br />
Field Operations Coordinator (FOC). As of this writing, the<br />
Advisory Panel is being reformulated, the FOC is being filled,<br />
and the <strong>HMT</strong>-West Regional team is largely formed (with a<br />
lead to be announced soon).<br />
The following sections describe the membership and<br />
responsibilities of the proposed <strong>HMT</strong> management structure.<br />
2.4.1 <strong>HMT</strong> Management Council (MC)<br />
The <strong>HMT</strong> Management Council is composed of two <strong>NOAA</strong><br />
<strong>Program</strong> Managers that provide overall guidance and funding<br />
for the <strong>HMT</strong> project:<br />
22<br />
<strong>NOAA</strong> Agency Representative Title<br />
OHD Gary Carter IWF <strong>Program</strong><br />
Mgr.<br />
ESRL Marty Ralph ST&I <strong>Program</strong><br />
Mgr.<br />
2.4.2 <strong>HMT</strong> Project Manager (PM)<br />
The <strong>HMT</strong> Project Manager is a <strong>NOAA</strong> employee responsible for day-to-day management of the <strong>HMT</strong><br />
project:<br />
<strong>NOAA</strong> Agency Representative Title<br />
OAR/ESRL Timothy Schneider <strong>HMT</strong> Project Mgr.<br />
Supporting the <strong>HMT</strong> Project Manager are the <strong>HMT</strong> Chief Scientist and the newly formed <strong>HMT</strong> Field<br />
Operations Coordinator. The Chief Scientist works closely with the Project Manager to provide scientific<br />
leadership to <strong>HMT</strong> and guides the experimental design of the <strong>HMT</strong> field operations. The <strong>HMT</strong> FOC works<br />
closely with the Chief Scientist and is primarily responsible for coordinating and executing the field studies,<br />
with support from the <strong>HMT</strong> field team. This recently identified position is in the process of being filled.<br />
<strong>NOAA</strong> Agency Representative Title<br />
OAR/ESRL; CU/CIRES Dave Kingsmill <strong>HMT</strong> Chief Scientist<br />
OAR/ESRL; CSU/CIRA Rob Cifelli <strong>HMT</strong> FOC<br />
Figure 2.5 Organizational chart showing <strong>HMT</strong> management<br />
structure.
<strong>HMT</strong> Science & Services Implementation Plan Science Plan and Management<br />
2.4.3 <strong>HMT</strong> National Advisory Panel (NAP)<br />
The <strong>HMT</strong> National Advisory Panel (NAP) has a national perspective and provides guidance to the Project<br />
Manager and the Management Council. The <strong>HMT</strong> Project Manager is the Chair of the NAP and all members<br />
represent different offices within <strong>NOAA</strong>. Membership to the NAP is determined by recommendation by<br />
the <strong>HMT</strong> Project Manager to the <strong>HMT</strong> Advisory Council who either accepts or rejects the recommendation.<br />
Pending approval by the <strong>HMT</strong> Management Council, the following <strong>NOAA</strong> Agencies will likely be<br />
represented on the NAP, with individual representatives to be announced in the fall of calendar year 2009:<br />
• <strong>HMT</strong> Project Manager (chair)<br />
• RIT-West Lead (regional representation)<br />
• RIT-SE Lead (regional representation)<br />
• NWS/OHD (hydrology representation)<br />
• NWS/NCEP-HPC (national operational representation)<br />
• NWS/OCWWS (requirements)<br />
• OAR/HQ (transition person)<br />
• NWS/MDL, NWS/OST (transition person)<br />
• NESDIS-STAR (satellites/global precip)<br />
2.4.4 <strong>HMT</strong> Regional Implementation Teams (RIT)<br />
The <strong>HMT</strong> Regional Implementation Teams (RIT) focus on the needs and requirements of the different <strong>HMT</strong><br />
regions (<strong>HMT</strong>-West, <strong>HMT</strong>-Southeast). In addition to providing regionally specific expertise and input to<br />
the experimental design of the testbed, and participating in and contributing to the conduct of the testbed,<br />
the RITs will also play a role in facilitating the transition of research to operations. Each RIT is independent<br />
of the other RITs. Membership is open to <strong>NOAA</strong> and non-<strong>NOAA</strong> Stakeholders and members can be on<br />
multiple RITs. Each RIT will have a Lead that works closely with, and reports activities to the <strong>HMT</strong> Project<br />
Manager. The appointment of the RIT Leads is made by recommendation by the <strong>HMT</strong> Project Manager to<br />
the <strong>HMT</strong> Advisory Council who either accepts or rejects the recommendation. Membership in the RITs is to<br />
be determined by the <strong>HMT</strong> Project Manager with consultation from the appropriate RIT Lead and the <strong>HMT</strong><br />
Chief Scientist. As testbeds are established, new Regional Implementation Teams will be formed.<br />
2.4.4.1 RIT-West<br />
By definition, the RIT is a somewhat larger group and the composition is somewhat dynamic. Also some<br />
organizations have multiple members. At this time there are approximately 28 members on the Regional<br />
Implementation Team-West (RIT-West). The following <strong>NOAA</strong> and non-<strong>NOAA</strong> organizations are currently<br />
represented:<br />
• OAR ESRL/PSD<br />
• OAR ESRL/GSD<br />
• OAR NSSL<br />
• NWS Western Region HQ<br />
• NWS CBRFC<br />
• NWS CNRFC<br />
• NWS Eureka WFO<br />
• NWS Monterey WFO<br />
• NWS Reno WFO<br />
• NWS Sacramento WFO<br />
• NWS OHD<br />
• NWS NCEP/HPC<br />
• NESDIS-STAR<br />
• NOHRSC (NWS OCWWS)<br />
• USACE<br />
• CA-DWR<br />
• Scripps Institute of<br />
Oceanography<br />
• University of Washington<br />
• Private Water Consultants<br />
23
<strong>HMT</strong> Science & Services Implementation Plan Science Plan and Management<br />
2.4.4.2 RIT-Southeast<br />
Currently, <strong>HMT</strong>-Southeast is being considered as the next<br />
testbed. To date, two workshops have been held (February<br />
and June of 2009) to facilitate the planning process. The<br />
<strong>HMT</strong> Project Manager is leading this process with support<br />
from the <strong>HMT</strong> Southeast Ad Hoc Planning Committee. The<br />
Regional Implementation Team-Southeast (RIT-Southeast) will<br />
be established approximately one year ahead of the testbed<br />
initiation.<br />
2.4.5 Integrated Water Resource Services-<br />
Priority Area Task Team (IWRS-PATT)<br />
Priority Area Task Teams (PATTs) form a part of the <strong>NOAA</strong>'s<br />
Regional Collaboration Effort. The PATTs exist on the<br />
national level to help develop a <strong>NOAA</strong>-wide strategy for<br />
addressing several priority areas. Current PATTs include one<br />
for Hazard Resilient Coastal Communities, one for Integrated<br />
Water Resource Services, and one for Integrated Ecosystems<br />
Assessment. The IWRS-PATT is directed to the long-range<br />
objective of “Summit to the Sea” life cycle water modeling.<br />
The <strong>HMT</strong> program is a key component of the IWRS-PATT<br />
in addressing state-of-the-art precipitation, soil moisture and<br />
snow- level estimations as inputs to distributed hydrologic<br />
models in complex terrain.<br />
2.5 Operating Plan<br />
2.5.1 Communication<br />
Interactions within the <strong>HMT</strong> community take on a number<br />
of forms, depending upon whether or not field operations are<br />
occurring. The <strong>HMT</strong> web page (http://hmt.noaa.gov) is a<br />
primary source of information for both <strong>HMT</strong> participants as<br />
well as the public at large. News stories are added to the front<br />
page as frequently as possible to keep the pages current and to<br />
convey what is happening to the community. The web page<br />
also serves as a portal to much of the <strong>HMT</strong> data, and as an<br />
archive of key documents.<br />
Off Season<br />
Traditionally, annual meetings of the <strong>HMT</strong> Advisory Panel<br />
have been held in the spring. It is also common to conduct 1–2<br />
“mini” <strong>HMT</strong> workshops; small groups focused on a narrow<br />
topic.<br />
During Field Operations<br />
During field operations (in the west this is typically from the<br />
24<br />
<strong>HMT</strong> Research to Operations (R20)<br />
Workshop<br />
Posted May 14, 2008<br />
The <strong>NOAA</strong> Hydrometeorological Test Bed<br />
(<strong>HMT</strong>) program sponsored a <strong>HMT</strong> Research to<br />
Operations (R2O) Workshop, 20-21 May 2008<br />
and the <strong>HMT</strong> Annual Meeting 22-23 May in<br />
Sacramento, CA at the Joint Operations Center<br />
(home to the California-Nevada River Forecast<br />
Center (CNRFC) and the Sacramento Weather<br />
Forecast Office (WFO) and other federal/state<br />
agencies). Participants included researchers<br />
from <strong>NOAA</strong>;s Earth System Research<br />
Laboratory, National Severe Storms Laboratory,<br />
and the National Weather Service. Attendees<br />
will identify "technologies" developed in<br />
<strong>HMT</strong>, which are ready to be transitioned into<br />
operations in the near term, and develop an<br />
execution plan. Intended outcomes include<br />
an exchange of knowledge leading to a better<br />
understanding of NWS operational procedures,<br />
pressures and gaps at the CNRFC and in the<br />
WFOs, and a clear sense of <strong>HMT</strong>’s scientific<br />
and technological developments to date.<br />
A report will be developed that identifies one or<br />
more candidate technologies for infusion into<br />
NWS operations, long-term prospects, and an<br />
implementation strategy to achieve it.<br />
<strong>HMT</strong> is a <strong>NOAA</strong> demonstration program<br />
designed to improve flood forecasting by<br />
accelerating the infusion of new technologies,<br />
forecast models, and scientific results from the<br />
research community into daily operations of the<br />
National Weather Service, including Weather<br />
Forecast Offices, River Forecast Centers and the<br />
National Centers for Environmental Prediction.<br />
<strong>NOAA</strong>'s Weather and Water Mission includes<br />
goals for improving the predictability of floods<br />
to better protect the public from losses of life<br />
and property. <strong>HMT</strong> provides a laboratory for<br />
NWS hydrologists and meteorologists to work<br />
closely with researchers from OAR to develop<br />
and evaluate new methods of monitoring and<br />
predicting extreme precipitation, which can<br />
be transitioned to operations. Lessons learned<br />
during <strong>HMT</strong> in the American River Basin can<br />
be applied elsewhere, in particular to the West<br />
Coast of the U.S.
<strong>HMT</strong> Science & Services Implementation Plan Science Plan and Management<br />
beginning of December into mid-March), operations directors and lead forecasters are identified and each<br />
serves on one or more two-week shifts. The operations director is responsible for deciding when to conduct<br />
intensive operations periods (IOPs; i.e., both when to begin an IOP and when to terminate it), how to utilize<br />
available resources (sondes; field personnel, etc), and to write an IOP summary in a timely fashion. The<br />
operations director works closely with the lead forecaster, as well as the professional NWS forecasters to keep<br />
abreast of developing weather.<br />
A number of blogs are also maintained on the web page on a daily basis (or more frequently as needed)<br />
during the field season. The two most important and useful blogs are the daily status and the daily forecast.<br />
However the most important form of communication during the field season is a daily conference call. It is<br />
important to keep these calls as brief as possible. During periods of relatively calm weather, it is common<br />
for these calls to last approximately five minutes. When a storm is imminent, the calls are more involved,<br />
and run somewhat longer. Long-range weather discussions are held as well, approximately on a bi-weekly<br />
schedule. These typically last on the order of one-half hour. After important IOPs (i.e., a “significant” event),<br />
a longer debrief call may be scheduled.<br />
2.5.2 <strong>HMT</strong> <strong>Program</strong> Overview<br />
2.5.2.1 <strong>HMT</strong>-West<br />
<strong>HMT</strong>-West activities started in FY05 with a focus in the American River Basin because of the potential<br />
flooding of the Sacramento Valley due to critical management of Folsom Dam. The level of effort and<br />
activities in <strong>HMT</strong>-West increased from FY06 through FY08 with more field observations, more analyses,<br />
Figure 2.6 The <strong>HMT</strong> timeline spans over a decade and phases from one regional<br />
activity to another regional activity.<br />
more modeling, and more communication between researchers and forecasters. As shown in Figure 2.6, the<br />
level of effort in <strong>HMT</strong>-West for FY09-FY11 will be comparable with FY08 and will decrease thereafter when<br />
there will be an <strong>HMT</strong>-West Legacy level of effort to maintain the lessons learned from the testbeds.<br />
Given current resources, <strong>HMT</strong>-West will need to reduce its level of effort in order for <strong>HMT</strong>-Southeast to<br />
begin and succeed. The regional hydrological problems that <strong>HMT</strong>-Southeast will address are still being<br />
defined and the requirements and scope of <strong>HMT</strong>-Southeast are being developed in FY09.<br />
2.5.2.2 <strong>HMT</strong>-Southeast<br />
The <strong>HMT</strong>-Southeast regional application project is being planned. Kickoff workshops were held in February<br />
and June 2009 in Chapel Hill, NC. The workshops involved the major stakeholders in a process of planning<br />
25
<strong>HMT</strong> Science & Services Implementation Plan Science Plan and Management<br />
and project design; it will yield commitments for participation in more detailed planning and regional<br />
implementation activities.<br />
2.5.3 Legacy Outcomes<br />
The <strong>HMT</strong> testbed concept is founded on a regional deployment strategy. Given successful demonstration<br />
of advanced precipitation, snow level and soil moisture estimation techniques, selected components of the<br />
installed systems will likely remain as a legacy when the <strong>HMT</strong> experiments are completed.<br />
2.5.3.1 EFREP<br />
One example of an <strong>HMT</strong> legacy outcome is the Enhanced Flood Response and Emergency Preparedness<br />
(EFREP) project. The California Department of Water Resources (DWR) has signed a five-year agreement<br />
with <strong>NOAA</strong>'s Earth System Research Laboratory (ESRL) to bring 21st century observation and modeling<br />
capabilities to bear on the state’s water resource and flood protection issues. EFREP is joint project between<br />
DWR, <strong>NOAA</strong>, and the Scripps Institute for Oceanography. The underlying goal of the project is to improve<br />
precipitation forecasts, especially during extreme events. The planned statewide deployment builds on<br />
<strong>NOAA</strong>'s <strong>Hydrometeorology</strong> <strong>Testbed</strong> (<strong>HMT</strong>) project carried out in the North Fork of the American River over<br />
the past three years. Recent research indicates that extreme precipitation in California is often associated<br />
with land-falling atmospheric rivers. Over the ocean the moisture content of these rivers can be tracked by<br />
weather satellites, however, over land ground-based instruments are needed. The planned deployment of<br />
instrumentation represents the first tier of a proposed multitier program. Taking full advantage of the new<br />
measurements will require a complementary effort in data assimilation, modeling and display. Decision<br />
support tools to integrate this new information into flood forecasts will also be developed.<br />
2.5.4 Timeline and Milestones<br />
The previous section defined the three regional efforts of <strong>HMT</strong>, limited resources (which include time and<br />
money) dictates that the regional efforts be implemented in stages with lessons learned from previous field<br />
campaigns used to improve future campaigns. Figure 2.6 shows a general timeline of <strong>HMT</strong> activities starting<br />
with the conceptual phase of isolated field campaigns focused on addressing specific scientific questions.<br />
The first <strong>HMT</strong> activities involved prototype field campaigns in FY03 and FY04. These activities focused<br />
on hydrometeorological processes on the West Coast and the Russian River Basin with efforts to improve<br />
communication between <strong>NOAA</strong> researchers and <strong>NOAA</strong> forecasters.<br />
2.6 Training<br />
The <strong>HMT</strong> effort takes long-standing, and/or newly developing science and technology, and places it in<br />
an operational setting to demonstrate and evaluate prototypes, and for proof of concept for weather and<br />
hydrology forecasts, warnings, and products. To this end, well-developed training, with inputs from the<br />
science and research communities as well as the operational communities, will provide a solid foundation for<br />
skilled operational use of the techniques, data, and decision-making in the operational warning and forecast<br />
process and products.<br />
Training efforts will be focused on the proven and end-to-end usage of various tools, data, and techniques<br />
developed during the <strong>HMT</strong> focus area studies. The first of such areas, involving the west coast of the US,<br />
has already shown and proven the operational value of new data sets and modeling tools to operational<br />
forecasters. Those proven operational improvements are a substantial justification to invest in the widespread<br />
implementation and usage of <strong>HMT</strong>-developed resources/techniques in the operational settings such as the<br />
NWS.<br />
26