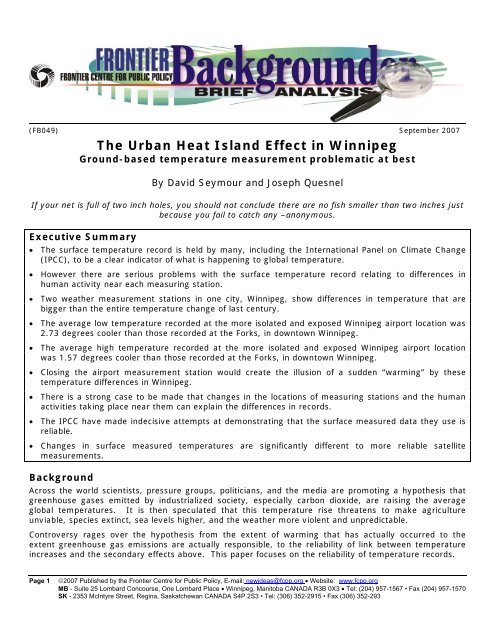
The Urban Heat Island Effect in Winnipeg - Frontier Centre for Public ...

You also want an ePaper? Increase the reach of your titles
YUMPU automatically turns print PDFs into web optimized ePapers that Google loves.
(FB049) September 2007<br />
<strong>The</strong> <strong>Urban</strong> <strong>Heat</strong> <strong>Island</strong> <strong>Effect</strong> <strong>in</strong> W<strong>in</strong>nipeg<br />
Ground-based temperature measurement problematic at best<br />
By David Seymour and Joseph Quesnel<br />
If your net is full of two <strong>in</strong>ch holes, you should not conclude there are no fish smaller than two <strong>in</strong>ches just<br />
because you fail to catch any –anonymous.<br />
Executive Summary<br />
• <strong>The</strong> surface temperature record is held by many, <strong>in</strong>clud<strong>in</strong>g the International Panel on Climate Change<br />
(IPCC), to be a clear <strong>in</strong>dicator of what is happen<strong>in</strong>g to global temperature.<br />
• However there are serious problems with the surface temperature record relat<strong>in</strong>g to differences <strong>in</strong><br />
human activity near each measur<strong>in</strong>g station.<br />
• Two weather measurement stations <strong>in</strong> one city, W<strong>in</strong>nipeg, show differences <strong>in</strong> temperature that are<br />
bigger than the entire temperature change of last century.<br />
• <strong>The</strong> average low temperature recorded at the more isolated and exposed W<strong>in</strong>nipeg airport location was<br />
2.73 degrees cooler than those recorded at the Forks, <strong>in</strong> downtown W<strong>in</strong>nipeg.<br />
• <strong>The</strong> average high temperature recorded at the more isolated and exposed W<strong>in</strong>nipeg airport location<br />
was 1.57 degrees cooler than those recorded at the Forks, <strong>in</strong> downtown W<strong>in</strong>nipeg.<br />
• Clos<strong>in</strong>g the airport measurement station would create the illusion of a sudden “warm<strong>in</strong>g” by these<br />
temperature differences <strong>in</strong> W<strong>in</strong>nipeg.<br />
• <strong>The</strong>re is a strong case to be made that changes <strong>in</strong> the locations of measur<strong>in</strong>g stations and the human<br />
activities tak<strong>in</strong>g place near them can expla<strong>in</strong> the differences <strong>in</strong> records.<br />
• <strong>The</strong> IPCC have made <strong>in</strong>decisive attempts at demonstrat<strong>in</strong>g that the surface measured data they use is<br />
reliable.<br />
• Changes <strong>in</strong> surface measured temperatures are significantly different to more reliable satellite<br />
measurements.<br />
Background<br />
Across the world scientists, pressure groups, politicians, and the media are promot<strong>in</strong>g a hypothesis that<br />
greenhouse gases emitted by <strong>in</strong>dustrialized society, especially carbon dioxide, are rais<strong>in</strong>g the average<br />
global temperatures. It is then speculated that this temperature rise threatens to make agriculture<br />
unviable, species ext<strong>in</strong>ct, sea levels higher, and the weather more violent and unpredictable.<br />
Controversy rages over the hypothesis from the extent of warm<strong>in</strong>g that has actually occurred to the<br />
extent greenhouse gas emissions are actually responsible, to the reliability of l<strong>in</strong>k between temperature<br />
<strong>in</strong>creases and the secondary effects above. This paper focuses on the reliability of temperature records.<br />
Page 1 ©2007 Published by the <strong>Frontier</strong> <strong>Centre</strong> <strong>for</strong> <strong>Public</strong> Policy, E-mail: newideas@fcpp.org • Website: www.fcpp.org<br />
MB - Suite 25 Lombard Concourse, One Lombard Place • W<strong>in</strong>nipeg, Manitoba CANADA R3B 0X3 • Tel: (204) 957-1567 • Fax (204) 957-1570<br />
SK - 2353 McIntyre Street, Reg<strong>in</strong>a, Saskatchewan CANADA S4P 2S3 • Tel: (306) 352-2915 • Fax (306) 352-293
Measurement of global average temperatures is central to the hypothesis. Only with reliable records can<br />
we say that temperature is ris<strong>in</strong>g or that these rises co<strong>in</strong>cide with causes like greenhouse gas emissions,<br />
or effects like dramatic weather events.<br />
Estimates of past and present temperatures come from three sources. For periods prior to the 1860’s<br />
‘proxy’ <strong>in</strong>dicators, like the thickness of tree r<strong>in</strong>gs, sedimentary soil layers, and layers of ice that are said to<br />
reflect temperatures. S<strong>in</strong>ce 1860, the records also come from ground based thermometers, while s<strong>in</strong>ce<br />
the late 1970’s more sophisticated satellite methods have been used to measure the temperatures of air<br />
<strong>in</strong> the Earth’s atmosphere.<br />
It is worth not<strong>in</strong>g that the surface temperature record is widely touted as an important <strong>in</strong>dicator of global<br />
temperature. For example, the 2007 IPCC report claims “<strong>The</strong> warmest years <strong>in</strong> the <strong>in</strong>strumental record of<br />
global surface temperatures are 1998 and 2005… Eleven of the last 12 years…rank among the 12 warmest<br />
years on record s<strong>in</strong>ce 1850.” 1<br />
This <strong>Frontier</strong> Backgrounder<br />
Temperature averages 1.5 degrees celsius higher at Forks<br />
takes a look at the reality of<br />
2.5<br />
measur<strong>in</strong>g temperature from<br />
the ground close to home, at<br />
two weather stations located<br />
2<br />
<strong>in</strong> W<strong>in</strong>nipeg, Manitoba. <strong>The</strong><br />
differences between<br />
temperatures measured <strong>in</strong><br />
1.5<br />
two parts of W<strong>in</strong>nipeg, at<br />
the more isolated and<br />
exposed airport and <strong>in</strong> the<br />
1<br />
densely populated centre<br />
city, are greater than the<br />
entire temperature rise<br />
0.5<br />
be<strong>in</strong>g claimed s<strong>in</strong>ce the<br />
surface temperature records<br />
began.<br />
Average temperature difference (Forks m<strong>in</strong>us Airport) <strong>for</strong> month 1999-2007<br />
0<br />
January February March April May June July August September October November December<br />
Figure 1 Monthly mean temperature differences between Forks and International<br />
Airport. Data is sourced from Environment Canada and listed <strong>in</strong> Appendix A.<br />
Further, dramatic changes<br />
and reductions <strong>in</strong> the<br />
number and location of<br />
measurement stations<br />
around the world is mean<strong>in</strong>g that someth<strong>in</strong>g similar to clos<strong>in</strong>g one of the W<strong>in</strong>nipeg stations then claim<strong>in</strong>g<br />
the average temperature has changed is occurr<strong>in</strong>g all over the world.<br />
Measur<strong>in</strong>g temperature close to home<br />
W<strong>in</strong>nipeg has two major weather stations. One is located at the Forks, <strong>in</strong> the centre of the city. In l<strong>in</strong>e<br />
with the theory of the <strong>Urban</strong> <strong>Heat</strong> <strong>Island</strong> <strong>Effect</strong>, this location is protected from the w<strong>in</strong>d by the city and<br />
heated by the vehicles, build<strong>in</strong>gs, and sun trapp<strong>in</strong>g tarmac nearby.<br />
<strong>The</strong> other location is at the W<strong>in</strong>nipeg Airport. While one might expect the tarmac and traffic activity there<br />
to have similar effects, there are dramatic differences <strong>in</strong> recorded temperatures. Because few, if any,<br />
geographical features dist<strong>in</strong>guish the Forks from the Airport –both are ultimately on the undulat<strong>in</strong>g Prairiehuman<br />
land use differences must expla<strong>in</strong> this difference. <strong>The</strong> Forks are significantly warmer, a fact stated<br />
by environment Canada when they unveiled the new station <strong>in</strong> 1999. 2<br />
If the weather station at W<strong>in</strong>nipeg International Airport were to suddenly close down, temperature<br />
read<strong>in</strong>gs would show the city had warmed, as the city would be rely<strong>in</strong>g on the measurements from one<br />
weather station rather than two.<br />
<strong>The</strong> impact of the urban heat island effect on temperature is widely documented. A recent study by the<br />
American Geophysical Union found that temperatures <strong>in</strong> urban areas like Atlanta, Georgia and Houston,<br />
Texas were artificially raised by as much as 10 degrees <strong>in</strong> the summer due to concrete and concentrations<br />
Page 2 ©2007 Published by the <strong>Frontier</strong> <strong>Centre</strong> <strong>for</strong> <strong>Public</strong> Policy, E-mail: newideas@fcpp.org • Website: www.fcpp.org<br />
MB - Suite 25 Lombard Concourse, One Lombard Place • W<strong>in</strong>nipeg, Manitoba CANADA R3B 0X3 • Tel: (204) 957-1567 • Fax (204) 957-1570<br />
SK - 2353 McIntyre Street, Reg<strong>in</strong>a, Saskatchewan CANADA S4P 2S3 • Tel: (306) 352-2915 • Fax (306) 352-293
of human activity. In fact, it has been shown that the urban heat island effect can artificially raise<br />
temperatures <strong>in</strong> communities with populations as small as 1,000 people. 3<br />
Rather than be<strong>in</strong>g an objective reality, temperature is whatever we measure it to be. It is a reflection of<br />
our measur<strong>in</strong>g equipment as much as the actual temperatures. Like a fisherman’s catch depends on the<br />
holes <strong>in</strong> his net, a meteorologist’s temperature depends on the location of her weather stations.<br />
Measurement difficulties across the world<br />
It seems difficult to believe that the scientific community would make such an elementary error. While we<br />
will cover their attempts to account <strong>for</strong> it <strong>in</strong> the next section, it is worth not<strong>in</strong>g just how common the<br />
open<strong>in</strong>g and clos<strong>in</strong>g of weather stations <strong>in</strong> different areas is.<br />
In a previous <strong>Frontier</strong> Policy Series Paper, Dr V<strong>in</strong>cent Gray, an expert reviewer <strong>for</strong> the Intergovernmental<br />
Panel on Climate Change (IPCC), made the case that all of the changes <strong>in</strong> the surface record could be<br />
expla<strong>in</strong>ed by changes <strong>in</strong> the placement of weather stations:<br />
• From 1860 to 1910 the system was becom<strong>in</strong>g established <strong>in</strong> the large <strong>in</strong>dustrial cities and spread<strong>in</strong>g<br />
over the globe. Equipment was be<strong>in</strong>g moved from the sides and roofs of build<strong>in</strong>gs to protected<br />
enclosures, lead<strong>in</strong>g to a slight fall <strong>in</strong> the average.<br />
• From 1910 to 1940 the cities expanded, together with their energy use. <strong>The</strong>rmometers still suffered<br />
from an upwards bias because of the shr<strong>in</strong>kage of the thermometer glass. <strong>The</strong> First World War closed<br />
many stations which were rebuilt with better facilities, still ma<strong>in</strong>ly <strong>in</strong> large cities.<br />
• From 1940 to 1975 many stations were moved to airports and others were set up <strong>in</strong> rural areas, so<br />
caus<strong>in</strong>g an average fall <strong>in</strong> temperature.<br />
• From 1975 to 2000 airports expanded to become “heat islands” and better heat<strong>in</strong>g took place<br />
everywhere. 4 Measured temperature <strong>in</strong>creases and number of measur<strong>in</strong>g stations change dramatically after 1990<br />
13<br />
16<br />
13<br />
12<br />
14<br />
Global Average Temperature (C)<br />
12<br />
11<br />
11<br />
10<br />
10<br />
12<br />
10<br />
8<br />
Number of Weather Stations (000's)<br />
9<br />
6<br />
9<br />
8<br />
4<br />
1950 1960 1970 1980 1990 2000<br />
Average Temp<br />
Number of Stations<br />
Figure 2 Average global temperature measured by surface stations (bars) and number of<br />
weather stations (l<strong>in</strong>e) from 1950-2000. <strong>The</strong> greatest change <strong>in</strong> recorded temperature occurs<br />
at the same time as the greatest change <strong>in</strong> the number of stations used to record it.<br />
Page 3 ©2007 Published by the <strong>Frontier</strong> <strong>Centre</strong> <strong>for</strong> <strong>Public</strong> Policy, E-mail: newideas@fcpp.org • Website: www.fcpp.org<br />
MB - Suite 25 Lombard Concourse, One Lombard Place • W<strong>in</strong>nipeg, Manitoba CANADA R3B 0X3 • Tel: (204) 957-1567 • Fax (204) 957-1570<br />
SK - 2353 McIntyre Street, Reg<strong>in</strong>a, Saskatchewan CANADA S4P 2S3 • Tel: (306) 352-2915 • Fax (306) 352-293
While Gray alludes to several trends <strong>in</strong> the placement of weather stations s<strong>in</strong>ce 1860, this chart captures a<br />
dramatic shift <strong>in</strong> the number of stations around 1990. Some of this can be attributed to political upheaval<br />
around the collapse of the <strong>for</strong>mer Soviet Union. Environmental Economist Ross McKitrick and<br />
Environmental Scientist Patrick Michaels identify costs, lack of skilled meteorologists, particularly <strong>in</strong><br />
remote locations, as hav<strong>in</strong>g led to the decl<strong>in</strong>e <strong>in</strong> the number of weather stations. 5<br />
With these considerations <strong>in</strong> m<strong>in</strong>d, it seems plausible that the rise <strong>in</strong> measured temperature reflects<br />
isolated weather stations clos<strong>in</strong>g, leav<strong>in</strong>g proportionately more <strong>in</strong> urban areas affected by human activity.<br />
Figure 3 This picture shows how a weather station <strong>in</strong> Marysville, CA is affected by nearby<br />
human activity as well as changes <strong>in</strong> global temperature. (Picture courtesy of<br />
www.surfacestations.org)<br />
Are these difficulties be<strong>in</strong>g accounted <strong>for</strong> <strong>in</strong> the surface temperature record?<br />
It is natural to assume that such dramatic differences <strong>in</strong> location would somehow be accounted <strong>for</strong> by the<br />
scientific community with the billions of dollars that have gone <strong>in</strong>to climate change research <strong>in</strong> the past<br />
two decades.<br />
A number of studies claim to have debunked the <strong>Urban</strong> <strong>Heat</strong> <strong>Island</strong> <strong>Effect</strong>, f<strong>in</strong>d<strong>in</strong>g that when overall<br />
statistics are compiled, the read<strong>in</strong>gs from urban environments are not noticeably warmer than those from<br />
rural areas, so the land use affects can be ignored.<br />
However the McKitrick and Michaels’ paper is a more comprehensive study of how local factors nearby to<br />
weather stations affect the temperatures recorded. By sampl<strong>in</strong>g 218 <strong>in</strong>dividual stations from 93 countries,<br />
they were able to explore whether patterns <strong>in</strong> temperature results bore any resemblance to patterns of<br />
wealth, literacy, humidity levels, economic activity and other factors across the globe.<br />
<strong>The</strong>y found:<br />
Surface temperature data, <strong>in</strong>clud<strong>in</strong>g the IPCC gridded cell series, should not be <strong>in</strong>terpreted as if they only<br />
measure ‘climate.’ <strong>The</strong>y reflect the <strong>in</strong>fluence of many th<strong>in</strong>gs, <strong>in</strong>clud<strong>in</strong>g a complex blend of local economic and<br />
social factors. Some of these exert an <strong>in</strong>direct <strong>in</strong>fluence on local temperatures but have noth<strong>in</strong>g to do with the<br />
global climate, while others have noth<strong>in</strong>g to do with temperature at all but <strong>in</strong>stead affect data quality control.<br />
This study provides evidence that after controll<strong>in</strong>g <strong>for</strong> these, the observed rate of temperature change is<br />
Page 4 ©2007 Published by the <strong>Frontier</strong> <strong>Centre</strong> <strong>for</strong> <strong>Public</strong> Policy, E-mail: newideas@fcpp.org • Website: www.fcpp.org<br />
MB - Suite 25 Lombard Concourse, One Lombard Place • W<strong>in</strong>nipeg, Manitoba CANADA R3B 0X3 • Tel: (204) 957-1567 • Fax (204) 957-1570<br />
SK - 2353 McIntyre Street, Reg<strong>in</strong>a, Saskatchewan CANADA S4P 2S3 • Tel: (306) 352-2915 • Fax (306) 352-293
noticeably lower <strong>in</strong> a global sample, and depend<strong>in</strong>g on how economic <strong>in</strong>fluences are removed, could be as low<br />
as that observed <strong>in</strong> the satellite record. 6<br />
In other words, different temperatures are recorded <strong>in</strong> different places partly because different human<br />
activities mean that the temperatures near weather stations are different, and partly because social<br />
economic conditions affect the chances of gett<strong>in</strong>g accurate read<strong>in</strong>gs. However, if we could take these<br />
differences away, the observed warm<strong>in</strong>g would be much less.<br />
This is significant because they used IPCC data to arrive at these f<strong>in</strong>d<strong>in</strong>gs. <strong>The</strong> same data that the IPCC<br />
has claimed is immune to localized biases <strong>in</strong> temperature record<strong>in</strong>g.<br />
<strong>The</strong> 2007 IPCC report attempts to brush McKitrick and Michaels’ study aside with the assertion that other<br />
effects relat<strong>in</strong>g to human activity trump the causes that McKitrick and Michaels cite, 7 this is exactly the<br />
po<strong>in</strong>t that the study makes, it is not clear that the IPCC has grasped its sophistication.<br />
More tell<strong>in</strong>g is the difference between satellite and surface temperature measurements.<br />
What about the satellite measurements?<br />
Regardless of whether McKitrick and Michaels or the IPCC are right about the true cause of the recent rise<br />
<strong>in</strong> temperature from surface records, we should expect the surface records to be the same as the satellite<br />
records.<br />
Satellite record<strong>in</strong>gs are a recent phenomenon, dat<strong>in</strong>g back to 1979, compared to 1860 <strong>for</strong> surface<br />
temperature. <strong>The</strong>re are also reasons to believe that they would give more reliable results than ground<br />
stations. <strong>The</strong>y are <strong>in</strong>dependent of civilization, be<strong>in</strong>g equally able to fly over land and sea, <strong>in</strong>habited and<br />
un<strong>in</strong>habited locations.<br />
Figure 4 Temperature figures from surface, weather balloon and satellite. 8<br />
As this chart from V<strong>in</strong>cent Gray’s earlier paper shows, there has been significant divergence between<br />
surface and satellite measurements s<strong>in</strong>ce 1990, when we know there was a dramatic change <strong>in</strong> the<br />
number of stations available to record data.<br />
Moreover, Gray also established that other ways of measur<strong>in</strong>g global temperature have been shown to be<br />
<strong>in</strong>accurate. Read<strong>in</strong>gs from proxy measurements (tree r<strong>in</strong>gs, sediments, etc), weather balloons<br />
(radiosondes) and satellites (MSU Units) have not been shown to conclusively <strong>in</strong>dicate global warm<strong>in</strong>g<br />
(Gray, 2001).<br />
Page 5 ©2007 Published by the <strong>Frontier</strong> <strong>Centre</strong> <strong>for</strong> <strong>Public</strong> Policy, E-mail: newideas@fcpp.org • Website: www.fcpp.org<br />
MB - Suite 25 Lombard Concourse, One Lombard Place • W<strong>in</strong>nipeg, Manitoba CANADA R3B 0X3 • Tel: (204) 957-1567 • Fax (204) 957-1570<br />
SK - 2353 McIntyre Street, Reg<strong>in</strong>a, Saskatchewan CANADA S4P 2S3 • Tel: (306) 352-2915 • Fax (306) 352-293
Conclusion<br />
This paper ties together a number of observations of what scientific experts are say<strong>in</strong>g <strong>in</strong> the field.<br />
Despite clamour<strong>in</strong>g cries that there is a consensus and the science of climate change is settled, we have<br />
not had to peel the debate back very far to f<strong>in</strong>d that there is ample room to be skeptical about this<br />
‘consensus.’<br />
We have found that the temperature <strong>in</strong> W<strong>in</strong>nipeg varies more than the entire global variation claimed <strong>for</strong><br />
last century, depend<strong>in</strong>g on where you measure it. Worse, the locations where temperature is measured<br />
have changed dramatically over the past fifty years. Over two thirds of the surface weather stations<br />
operat<strong>in</strong>g <strong>in</strong> 1970 are no more, while new ones have opened <strong>in</strong> places like down town W<strong>in</strong>nipeg by people<br />
who know that higher temperatures will be recorded there.<br />
<strong>The</strong> pre-em<strong>in</strong>ent body responsible <strong>for</strong> climate science appears either unable or unwill<strong>in</strong>g to remove these<br />
biases from the data that they use to arrive at their conclusions and drive the multi-billion dollar research,<br />
lobby<strong>in</strong>g and media <strong>in</strong>dustry that has become modern climate change concern.<br />
However, when we see the variation between recently available satellite data and that recorded by the<br />
surface stations we have described, it appears they should.<br />
In the mean time it appears that the consensus and authority of science on the subject of climate change<br />
is a very th<strong>in</strong> veneer. <strong>Public</strong> policy should recognize this and acknowledge the possibility that the man<br />
made global warm<strong>in</strong>g hypothesis is wrong, and all the sacrifices many would like to see us make to our<br />
economy will be <strong>in</strong> va<strong>in</strong>.<br />
If land-based temperatures can be biased so easily by the urban heat island effect, it would be logical that<br />
the data upon which proponents of human-caused global warm<strong>in</strong>g reply <strong>for</strong> their arguments is seriously<br />
flawed and cannot be relied upon to prove their case.<br />
As temperature <strong>in</strong> W<strong>in</strong>nipeg has been shown to have been distorted by as much as two degrees Celsius by<br />
the urban heat island effect, then the cumulative effect of disregard<strong>in</strong>g this bias<strong>in</strong>g effect on the IPCC<br />
report is a massively biased sample that erroneously shows warm<strong>in</strong>g on a global scale.<br />
Clearly, policy makers should not make policy decisions on global warm<strong>in</strong>g us<strong>in</strong>g this flawed data.<br />
About the Authors<br />
David Seymour BA BE -jo<strong>in</strong>s the <strong>Centre</strong> from New Zealand as a policy analyst work<strong>in</strong>g out of the<br />
<strong>Centre</strong>'s Reg<strong>in</strong>a office. He holds degrees <strong>in</strong> Electrical Eng<strong>in</strong>eer<strong>in</strong>g and Philosophy from the University<br />
of Auckland, where he also taught Economics. After work<strong>in</strong>g as an eng<strong>in</strong>eer <strong>in</strong> New Zealand he is<br />
apply<strong>in</strong>g his passion <strong>for</strong> high per<strong>for</strong>mance government to policy issues on the Prairies.<br />
Joseph Quesnel is the 2007 Mann<strong>in</strong>g Intern at the <strong>Frontier</strong> <strong>Centre</strong> <strong>for</strong> <strong>Public</strong> Policy. He is from the<br />
Sudbury region of Northern Ontario, and has Metis ancestry from Quebec. He graduated from McGill<br />
University <strong>in</strong> 2001, major<strong>in</strong>g <strong>in</strong> political science and history. He specialized <strong>in</strong> Canadian and<br />
American politics, with an emphasis on constitutional law. In 2004, he completed a master of<br />
journalism degree at Carleton University <strong>in</strong> Ottawa, where he specialized <strong>in</strong> political report<strong>in</strong>g.<br />
Currently, he is a writer at the Drum/First Perspective newspaper, a nationally-distributed Aborig<strong>in</strong>al<br />
publication.<br />
Page 6 ©2007 Published by the <strong>Frontier</strong> <strong>Centre</strong> <strong>for</strong> <strong>Public</strong> Policy, E-mail: newideas@fcpp.org • Website: www.fcpp.org<br />
MB - Suite 25 Lombard Concourse, One Lombard Place • W<strong>in</strong>nipeg, Manitoba CANADA R3B 0X3 • Tel: (204) 957-1567 • Fax (204) 957-1570<br />
SK - 2353 McIntyre Street, Reg<strong>in</strong>a, Saskatchewan CANADA S4P 2S3 • Tel: (306) 352-2915 • Fax (306) 352-293
Mean Maximum Temperature (Degrees Celsius)<br />
Month<br />
International Airport Forks Difference<br />
January -10.64 -9.74 0.91<br />
February -8.39 -8.15 0.24<br />
March -0.50 -0.19 0.31<br />
April 11.92 11.34 -0.58<br />
May 17.56 17.24 -0.31<br />
June 22.84 22.74 -0.10<br />
July 26.44 26.76 0.32<br />
August 25.09 25.09 0.00<br />
September 19.34 19.89 0.54<br />
October 10.33 10.26 -0.07<br />
November 2.50 2.54 0.04<br />
Table 1 Mean of maximum monthly temperatures<br />
Mean Average Temperature (Degrees Celsius)<br />
Month<br />
International Airport Forks Difference<br />
January -15.82 -13.78 2.05<br />
February -13.87 -11.93 1.94<br />
March -5.98 -4.74 1.24<br />
April 5.32 5.99 0.67<br />
May 10.87 11.83 0.96<br />
June 15.81 17.89 2.07<br />
July 19.86 21.66 1.79<br />
August 18.53 20.00 1.48<br />
September 13.13 14.79 1.66<br />
October 4.69 6.07 1.38<br />
November -3.11 -1.19 1.93<br />
December -11.59 -9.95 1.64<br />
Average 3.15 4.72 1.57<br />
Table 2 Mean of average monthly temperatures<br />
Mean M<strong>in</strong>imum Temperature (Degrees Celsius)<br />
Month<br />
International Airport Forks Difference<br />
January -20.9444 -17.75 3.19<br />
February -19.2889 -16.3 2.99<br />
March -11.4111 -9.3 2.11<br />
April -1.32222 0.6125 1.93<br />
May 4.155556 6.385714 2.23<br />
June 10.3 12.97143 2.67<br />
July 13.2625 16.51429 3.25<br />
August 11.925 14.88571 2.96<br />
September 6.7875 9.642857 2.86<br />
October -0.975 1.857143 2.83<br />
November -7.8625 -4.91429 2.95<br />
December -16.6 -13.8125 2.79<br />
Average -2.66 0.07 2.73<br />
Appendix A<br />
Each table conta<strong>in</strong>s<br />
average temperatures <strong>for</strong><br />
the two W<strong>in</strong><strong>in</strong>ipeg<br />
weather stations, one at<br />
the Forks downtowwn<br />
and one at the Airport.<br />
Table 2 was used <strong>for</strong> the<br />
chart <strong>in</strong> Figure 1.<br />
<strong>The</strong> temperatures are<br />
‘averages of averages’<br />
where<strong>in</strong> the average<br />
monthly temperature <strong>for</strong><br />
given a month is<br />
calculated then comb<strong>in</strong>ed<br />
with averages from the<br />
same month from other<br />
years to give an eight<br />
year (1999-2006)<br />
average <strong>for</strong> that month.<br />
For example the figure<br />
<strong>for</strong> September Mean<br />
M<strong>in</strong>imum at the Forks is<br />
the average of the<br />
m<strong>in</strong>imum temperatures<br />
on all the days <strong>in</strong> the<br />
eight Septembers from<br />
1999-2006.<br />
<strong>The</strong> difference column<br />
gives the difference<br />
between the two<br />
stations. Positive values<br />
<strong>in</strong>dicate<br />
warmer<br />
temperatures at the<br />
Forks, negative values<br />
<strong>in</strong>dicate<br />
warmer<br />
temperatures at the<br />
airport.<br />
With the exception of<br />
four months where the<br />
maximum temperature is<br />
higher at the airport, all<br />
figures <strong>in</strong>dicate warmer<br />
temperatures at the<br />
airport.<br />
Table 3 Mean m<strong>in</strong>imum monthly temperatures<br />
Page 7 ©2007 Published by the <strong>Frontier</strong> <strong>Centre</strong> <strong>for</strong> <strong>Public</strong> Policy, E-mail: newideas@fcpp.org • Website: www.fcpp.org<br />
MB - Suite 25 Lombard Concourse, One Lombard Place • W<strong>in</strong>nipeg, Manitoba CANADA R3B 0X3 • Tel: (204) 957-1567 • Fax (204) 957-1570<br />
SK - 2353 McIntyre Street, Reg<strong>in</strong>a, Saskatchewan CANADA S4P 2S3 • Tel: (306) 352-2915 • Fax (306) 352-293
Trenberth, K.E., P.D. Jones, P. Ambenje, R. Bojariu, D. Easterl<strong>in</strong>g, A. Kle<strong>in</strong> Tank, D. Parker, F. Rahimzadeh, J.A.<br />
Renwick, M. Rusticucci,B. Soden and P. Zhai, 2007: Observations: Surface and Atmospheric Climate Change. In: Climate<br />
Change 2007: <strong>The</strong> Physical Science Basis. Contribution of Work<strong>in</strong>g Group I to the Fourth Assessment Report of the<br />
Intergovernmental Panel on Climate Change [Solomon, S., D. Q<strong>in</strong>, M. Mann<strong>in</strong>g, Z. Chen, M. Marquis, K.B. Averyt, M.<br />
Tignor and H.L. Miller (eds.)]. Cambridge University Press, Cambridge, United K<strong>in</strong>gdom and New York, NY, USA<br />
2 “New Weather Station at the Forks,” (1999) Environment Canada news release retrieved September 23, 2007 from Web<br />
site: http://www.mb.ec.gc.ca/<strong>in</strong>fo/news/cc00s01.en.html<br />
3 Taylor, James M. (2004). <strong>Urban</strong> <strong>Heat</strong> <strong>Island</strong>s: Scientists dispute the accuracy of ground-based temperature read<strong>in</strong>gs<br />
used to support the theory of global warm<strong>in</strong>g. Retrieved September 2007 from <strong>Frontier</strong> <strong>Centre</strong> <strong>for</strong> <strong>Public</strong> Policy Web site:<br />
http://www.fcpp.org/ma<strong>in</strong>/publication_detail.php?PubID=709.<br />
4 Gray, V<strong>in</strong>cent (2001). <strong>The</strong> Cause of Global Warm<strong>in</strong>g. Retrieved September 23, 2007, from <strong>Frontier</strong> <strong>Centre</strong> <strong>for</strong> <strong>Public</strong><br />
Policy. Web site: http://www.fcpp.org/pdf/<strong>The</strong>_Cause_of_Global_Warm<strong>in</strong>g_Policy_Series_7.pdf<br />
5 McKitrick, Ross and Patrick J. Michaels (2004). A Test of Corrections <strong>for</strong> Extraneous Signals <strong>in</strong> Gridded Surface<br />
Temperature Data. Climate Research, Vol. 2 160-161<br />
6 Ibid, 172<br />
7 Trenberth, K.E., P.D. Jones, P. Ambenje, R. Bojariu, D. Easterl<strong>in</strong>g, A. Kle<strong>in</strong> Tank, D. Parker, F. Rahimzadeh, J.A.<br />
Renwick, M. Rusticucci,B. Soden and P. Zhai, 2007: Observations: Surface and Atmospheric Climate Change. In: Climate<br />
Change 2007: <strong>The</strong> Physical Science Basis. Contribution of Work<strong>in</strong>g Group I to the Fourth Assessment Report of the<br />
Intergovernmental Panel on Climate Change [Solomon, S., D. Q<strong>in</strong>, M. Mann<strong>in</strong>g, Z. Chen, M. Marquis, K.B. Averyt, M.<br />
Tignor and H.L. Miller (eds.)]. Cambridge University Press, Cambridge, United K<strong>in</strong>gdom and New York, NY, USA, 244<br />
8 From earlier <strong>Frontier</strong> paper<br />
Page 8 ©2007 Published by the <strong>Frontier</strong> <strong>Centre</strong> <strong>for</strong> <strong>Public</strong> Policy, E-mail: newideas@fcpp.org • Website: www.fcpp.org<br />
MB - Suite 25 Lombard Concourse, One Lombard Place • W<strong>in</strong>nipeg, Manitoba CANADA R3B 0X3 • Tel: (204) 957-1567 • Fax (204) 957-1570<br />
SK - 2353 McIntyre Street, Reg<strong>in</strong>a, Saskatchewan CANADA S4P 2S3 • Tel: (306) 352-2915 • Fax (306) 352-293