Bendigo Art Gallery Annual Report 2017-2018
Bendigo Art Gallery Annual Report 2017/2018 outlines the activities of the Bendigo Art Gallery Board of Directors during 2017/18
Bendigo Art Gallery Annual Report 2017/2018 outlines the activities of the Bendigo Art Gallery Board of Directors during 2017/18

You also want an ePaper? Increase the reach of your titles
YUMPU automatically turns print PDFs into web optimized ePapers that Google loves.
28<br />
29<br />
FINANCIAL REPORT<br />
FINANCIAL REPORT<br />
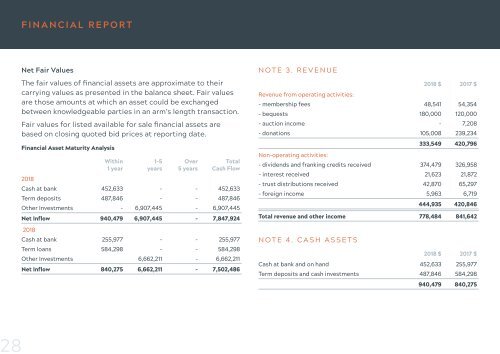
Net Fair Values<br />
NOTE 3. REVENUE<br />
NOTE 5. TRADE AND OTHER RECEIVABLES<br />
NOTE 7. FINANCIAL ASSETS<br />
The fair values of financial assets are approximate to their<br />
carrying values as presented in the balance sheet. Fair values<br />
are those amounts at which an asset could be exchanged<br />
between knowledgeable parties in an arm’s length transaction.<br />
Fair values for listed available for sale financial assets are<br />
based on closing quoted bid prices at reporting date.<br />
Financial Asset Maturity Analysis<br />
<strong>2018</strong><br />
Within 1-5 Over Total<br />
1 year years 5 years Cash Flow<br />
Cash at bank 452,633 - - 452,633<br />
Term deposits 487,846 - - 487,846<br />
Other Investments - 6,907,445 - 6,907,445<br />
Net Inflow 940,479 6,907,445 - 7,847,924<br />
<strong>2018</strong><br />
Cash at bank 255,977 - - 255,977<br />
Term loans 584,298 - - 584,298<br />
Other Investments 6,662,211 - 6,662,211<br />
Net Inflow 840,275 6,662,211 - 7,502,486<br />
<strong>2018</strong> $ <strong>2017</strong> $<br />
Revenue from operating activities:<br />
- membership fees 48,541 54,354<br />
- bequests 180,000 120,000<br />
- auction income - 7,208<br />
- donations 105,008 239,234<br />
333,549 420,796<br />
Non-operating activities:<br />
- dividends and franking credits received 374,479 326,958<br />
- interest received 21,623 21,872<br />
- trust distributions received 42,870 65,297<br />
- foreign income 5,963 6,719<br />
444,935 420,846<br />
Total revenue and other income 778,484 841,642<br />
NOTE 4. CASH ASSETS<br />
<strong>2018</strong> $ <strong>2017</strong> $<br />
Cash at bank and on hand 452,633 255,977<br />
Term deposits and cash investments 487,846 584,298<br />
Related party receivable 61,952 61,952<br />
Other debtors 111,510 96,399<br />
173,462 158,351<br />
NOTE 6. PROPERTY, PLANT & EQUIPMENT<br />
Plant & equipment at cost 26,427 26,427<br />
Less accumulative depreciation (15,720) (12,427)<br />
10,707 14,000<br />
Non-current<br />
<strong>2018</strong> $ <strong>2017</strong> $<br />
Available-for-sale financial assets 6,907,445 6,662,211<br />
Available for sale financial assets comprise:<br />
Listed investments, at fair value<br />
shares in listed corporations / trusts 6,907,445 6,662,211<br />
Available-for-sale financial assets comprise<br />
investments in the ordinary issued capital of<br />
various entities. There are no fixed returns or<br />
fixed maturity dates attached to these investments.<br />
Reconciliation of investments:<br />
Opening balance 6,662,211 6,060,307<br />
Investment purchases 1,529,534 1,308,829<br />
Revaluation of investments (153,608) 3,009<br />
Profit on sale of investments (7,553) 438,050<br />
Investment sales (1,123,139) (1,147,984)<br />
Closing balance 6,907,445 6,662,211<br />
940,479 840,275