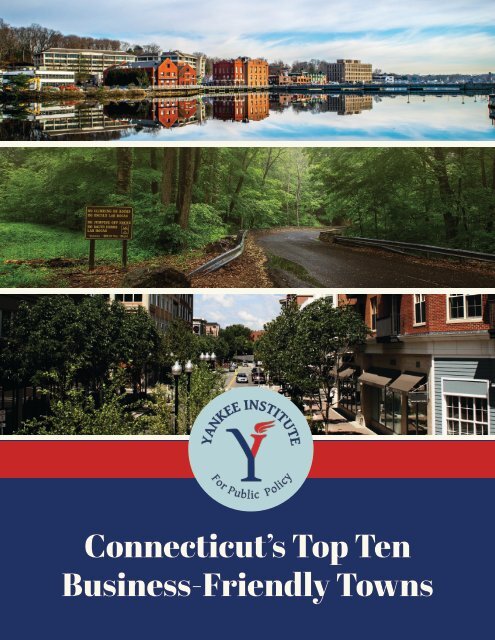
Connecticut's Top Ten Business-Friendly Towns
Find out which Connecticut towns are truly open for business!
Find out which Connecticut towns are truly open for business!
Create successful ePaper yourself
Turn your PDF publications into a flip-book with our unique Google optimized e-Paper software.
Connecticut’s <strong>Top</strong> <strong>Ten</strong><br />
<strong>Business</strong>-<strong>Friendly</strong> <strong>Towns</strong>
Yankee Letter<br />
Connecticut has so many advantages for businesses: an educated population and<br />
some of the country’s best schools a prime location midway between Manhattan<br />
and Boston in the beautiful heart of New England, and a rich history of research<br />
and innovation. “A Connecticut Yankee” has for centuries been a byword for a<br />
shrewd, clever and successful business person.<br />
In spite of her natural advantages and charm, Connecticut has in recent decades<br />
become a state riddled with high taxes and regulatory burdens—ingredients for a<br />
bleak economic future. State-level policies play a massive role in defining the state’s<br />
overall economic health. But Connecticut’s economic policy is not solely defined at<br />
the state level.<br />
Indeed, Connecticut’s 169 towns are especially adept at meeting the specific needs<br />
of local commerce and community. It is at the town level where we see encouraging<br />
economic development in Connecticut. Across the state, various towns of varying<br />
sizes are embracing free-market principles—often unknowingly—and creating a<br />
more hospitable landscape for businesses and entrepreneurs.<br />
This study examines and measures data collected from Connecticut’s 50 most<br />
populous towns. We have ranked the towns based how thoroughly they represent<br />
various criteria that ensure business success and protection of the entrepreneurial<br />
spirit. The four categories ranked are: Community Allure, Economic Vitality, Tax<br />
Burden and Transportation Infrastructure.<br />
Our aim is to bring a new statewide focus to the potentially positive power of local<br />
decision-making. We applaud the efforts of those Connecticut towns that are<br />
creating business-friendly economies.
1<br />
Fairfield 71.02%<br />
Even with higher taxes, Fairfield’s economic vitality and<br />
transportation infrastructure push it to No. 1 on our list.<br />
In September 2014, Money magazine ranked Fairfield the<br />
44th-best place to live in the United States and the best<br />
place to live in Connecticut. R.C. Bigelow and Sturm Ruger<br />
& Co. are headquartered in Fairfield. The coastal town also<br />
boasts two universities, multiple railroad stations and easy<br />
access to highways.<br />
Photo by Joe S. on Flickr<br />
2<br />
Greenwich 66.49%<br />
Famous for affluence, hedge funds and financial service<br />
companies, Greenwich—the largest town on Connecticut’s<br />
Gold Coast and wealthiest town in the state—was recognized<br />
as No. 12 by Money magazine in their “100 Best<br />
Places to Live in the United States.” Apart from higher taxes,<br />
which brought down its score, Greenwich scored well in<br />
the community allure, economic vitality and infrastructure<br />
categories. Greenwich is served by the Metro-North Railroad’s<br />
New Haven line, providing easy access to New York<br />
City. Greenwich is home to many parks, country clubs, and<br />
beach clubs as well as Greenwich Avenue’s many shops and<br />
restaurants.<br />
Photo by James Kirkikis on Shutterstock<br />
3<br />
Westport 66.32 %<br />
Another famous member of Connecticut’s Gold Coast,<br />
Westport—like Greenwich—is heavily reliant on financial<br />
service companies, with over 7,000 financial-sector employees.<br />
Major companies include Bridgewater Associates<br />
and Canaan Partners from the financial services area, but<br />
Westport is also home to Terex, a Fortune 500 industrial<br />
equipment manufacturing company. Westport’s score was<br />
lowered by its high tax burden, but impressive community<br />
allure, economic vitality and transportation infrastructure<br />
kept it high on our list. Westport is home to 234 acres of<br />
Sherwood Island State Park and the Wakeman Town Farm<br />
Sustainability Center, as well as many beaches, parks and a<br />
vibrant downtown area with shops and restaurants.<br />
Photo by Wendell Guy on Shutterstock
4<br />
Ridgefield 65.54%<br />
Part of affluent Fairfield County, Ridgefield sits at the foot of the<br />
Berkshire Mountains and serves as a family-friendly suburban<br />
community. Boutiques, stores and restaurants on Main Street<br />
and Danbury Road as well as the popular Ridgefield Playhouse<br />
attract visitors year-round. In fact, around half of business<br />
revenues are generated from Ridgefield visitors. Ridgefield’s<br />
high community allure and economic vitality outweighed the<br />
town’s low transportation infrastructure score and high tax<br />
burden, making it No. 4 on our list.<br />
Photo by Nancy Kennedy on Shutterstock<br />
5<br />
Simsbury 64.41%<br />
Simsbury, a suburb of Hartford, has been ranked as one of the<br />
best places to live in the state and in the nation by Connecticut<br />
Magazine and Time magazine, respectively. It has a highly<br />
recognized educational system and houses several well-known<br />
private schools. Simsbury is home to historic houses, working<br />
farms, miles of hiking trails, rivers, bike paths and golf courses.<br />
Simsbury’s economic vitality and community allure outweighed<br />
the town’s limited transportation infrastructure and higher<br />
taxes, securing its spot in the top five.<br />
Photo by Shanshan0312 on Shutterstock<br />
6<br />
West Hartford 61.06%<br />
Another Hartford suburb, West Hartford is more urban than<br />
Simsbury and boasts a popular downtown area. West Hartford<br />
Center and Blue Back Square together make up the town’s<br />
center and are home to restaurants, retail shopping, apartment<br />
buildings and offices. Recognized as a family-friendly suburb,<br />
West Hartford has a nationally ranked school system, several<br />
private schools and frequent town-wide events in the town<br />
center and various parks. Across the board, West Hartford<br />
scores well, although low marks for the town’s tax burden and<br />
infrastructure slightly bring down its overall score.<br />
Photo by Ragesoss on Wikimedia Commons
7<br />
South Windsor 60.97%<br />
A former rural farming community, South Windsor has<br />
quickly transformed into a suburban town with industrial<br />
and commercial districts. South Windsor’s high economic<br />
vitality and community allure scores, paired with more<br />
average tax burden and transportation infrastructure scores,<br />
put it in the top ten. Another family-friendly town, South<br />
Windsor is quieter than nearby Manchester or West Hartford,<br />
but still has shopping and restaurants, including the popular<br />
Promenade Shops at Evergreen Walk.<br />
Photo by John Phelan on Wikimedia Commons<br />
8<br />
Shelton 59.98%<br />
Shelton ranks eighth in our survey of Connecticut’s most<br />
business-friendly cities. Located in affluent Fairfield County,<br />
Shelton is home to major corporations including Black &<br />
Decker, Sikorsky Aircraft and Gama Aviation. Easy access<br />
to Route 8, coupled with low business costs relative to other<br />
Fairfield county towns, make it no wonder that Shelton lands<br />
in the top 10. Shelton’s historic downtown area, home to the<br />
city’s central business district, has recently been restored. The<br />
town also boasts the development of over 2 million square<br />
feet of corporate office space.<br />
Photo by LBSimms Photography on Shutterstock<br />
9<br />
Glastonbury 59.48%<br />
Located in central Connecticut, Glastonbury is an affluent<br />
town located along the Connecticut River. High economic<br />
vitality and community allure values make up for a lower<br />
transportation infrastructure score and compensates for an<br />
average tax burden score. Glastonbury is home to several<br />
parks, farms and historic sites, and hosts several annual<br />
community festivals and events. Glastonbury also offers<br />
shopping and dining at The Shops at Somerset Square.<br />
Photo by John Phelan on Wikimedia Commons
10<br />
Branford 58.61%<br />
Branford is located along the Long Island Sound and has<br />
great proximity to railroads, ports and highways. Over 20<br />
percent of Branford’s 22 square miles is water, including<br />
the Bradford River, Queach Brook, Branford Supply Ponds<br />
and two harbors. Branford is home to technology and<br />
pharmaceutical companies, several manufacturing spaces and<br />
three breweries. Branford’s 7-acre downtown area has coffee<br />
shops, restaurants and shops, and the town green frequently<br />
hosts events, fairs and concerts.<br />
Photo by Good Streets on Flickr<br />
Methodology<br />
In constructing a municipal index of business-friendliness, our research team surveyed existing business<br />
friendliness indexes to establish commonly used variables and weights. We included three indexes as primary<br />
references: “How <strong>Business</strong>-<strong>Friendly</strong> are <strong>Ten</strong>nessee’s Cities?,” “How Enterprise-<strong>Friendly</strong> are South Carolina’s 50<br />
Largest Cities?” and “Building <strong>Business</strong> in Alabama: How <strong>Business</strong>-<strong>Friendly</strong> are Alabama’s 50 Largest Cities?”<br />
These indices each use three-to-four major categories for assessing the business-friendliness of a town: tax<br />
burden, community allure, economic vitality and transportation infrastructure. Each major category consists of<br />
several subsidiary variables, normalized by percentile rank. The weighting and type of each variable and category<br />
varies depending on the unique attributes of the state studied and the relevant data available. Our research team’s<br />
index deviates from the primary references in the same way they deviate from one another, by reflecting the<br />
unique qualities and challenges of Connecticut.
Community allure 35%<br />
In the context of this report, “community allure” does not refer to the local charms and ambiance that make<br />
our favorite places special – such as an appreciation of Long Island Sound or a taste for New Haven-style<br />
pizza. Here, we use the term exclusively to refer to factors that draw businesses to an area and keep them there<br />
once they’ve established themselves. An educated population, low rates of crime and a low cost of living are<br />
particularly likely to foster entrepreneurship and attract expansion or relocation of existing businesses.<br />
Education is a strong signal for human capital, which is vital in today’s tech- and information-driven economy.<br />
And not just education in the broad sense: the type and extent of education matter as well. With the data<br />
available to our research team, we focused on the extent of the local population with educational attainment<br />
in two specific categories. The first category captures the educational achievements of young members of the<br />
community in the form of average SAT scores earned by residents. The second category captures older, more<br />
established workers (aged 25 and older) who have earned at least an associates’ degree. The first of these inputs<br />
carries a one-quarter weight in the community allure assessment; the latter carries 30 percent.<br />
Crime, and particularly violent crime, can have a negative impact on the allure of a community. Connecticut is<br />
a low-crime state, ranking 9th lowest in property crimes and 5th lowest in violent crimes nationally in 2016.1<br />
Statewide figures, though, hide the distribution of crime rates throughout the state. These vary widely, ranging<br />
from Hartford’s high of 1,058.7 violent crimes per 100,000 residents to lows of no violent crime whatsoever<br />
in several small, rural towns. And crime can matter in more than absolute terms; sometimes relatively small<br />
variations between towns with relatively low absolute crime can create the impression that the towns with mildly<br />
higher crime rates suffer significantly more crime. For these reasons, we include violent crimes, the most salient<br />
and attention-grabbing type of crime, in our index and weight it at 30 percent of the community allure category.<br />
Finally, we consider cost of living. In this study, we measure cost of living using a proxy measurement, the<br />
median home value in a locale. We would ideally have used a more direct measure, such as real purchasing<br />
power as defined by the Bureau of Economic Analysis.2 The way municipalities are aggregated by metro areas<br />
and non-metro areas in that data set, though, erases important differences between municipalities that were<br />
vital to our analysis in this study. (This anomaly in the data set is particularly relevant to Connecticut, where our<br />
suburbs have an extremely wide range of costs of living.) Cost of living thus measured bears 15 percent of the<br />
weight in the community allure category.<br />
Economic vitality 35%<br />
<strong>Business</strong>es care greatly about the prospect of future growth in a region when they weigh decisions such as<br />
opening, moving or expanding. While there are no crystal balls for economic growth, past performance tends<br />
to predict future performance and thus businesses look for trends in historic data in evaluating a community’s<br />
vitality.<br />
We have undertaken that analysis in this study. Our economic vitality category considers median household<br />
income and three-year population and job growth using five-year American Citizen Survey (ACS) data. These<br />
inputs give us a sense of both how affluent a municipality is and in what direction it has trended in the past three<br />
years relative to its peers.<br />
1 https://www.usnews.com/news/best-states/rankings/crime-and-corrections/public-safety<br />
2 https://taxfoundation.org/real-value-100-metro-2017/
Median income per household was selected over average income per capita or per household to better control for<br />
outliers and the unusually high Gini coefficient of many Connecticut towns.3 Municipalities with affluence spread<br />
broadly across their populations have strong middle classes that can support new and more intense economic<br />
activity. Meanwhile, the trends selected help to suggest the likely fate of the municipalities’ relative affluence.<br />
In Connecticut, job opportunities have been relatively scarce in recent years, prompting many residents to move<br />
out of state, retire or both. The decline of population in suburban and rural towns has created significant budget<br />
problems, causing fixed costs to rise relative to the number of remaining residents. This creates an impetus to<br />
raise and impose new taxes, which can then cause additional retirements and dislocation, raising the specter<br />
of a self-perpetuating vicious cycle of decay and decline. Lack of job opportunity also leads to workers of preretirement<br />
age leaving the workforce without moving out of state, which in many ways multiplies the problems<br />
already highlighted, as these residents both fail to contribute to the local economy and require a higher level of<br />
social-support services. The three-year trends are constructed by taking the percent change in total population,<br />
total population in the labor force, and unemployment between 2013 and 2016.<br />
For the economic vitality category, median household income accounted for 40 percent of the weight, acting as<br />
an anchor for the trend variables. The three-year changes in the labor force and in unemployment were weighted<br />
at 25 percent each, with changes in aggregate population accounting for the remaining 10 percent.<br />
Tax burden 20%<br />
Connecticut has a well-earned reputation for imposing extremely high tax burdens at both state and local levels.<br />
The majority of state taxes are on personal income, sales and corporate income, in descending order. Nearly all<br />
local revenue, meanwhile, comes from residential, commercial, commercial inventory and car property taxes.<br />
While other indices focus more narrowly on municipal sales and corporate income taxes, our index takes a more<br />
holistic approach by using total municipal tax burden per household, mill rate, and long-term obligation score,<br />
as defined in the “Warning Signs: Assessing Municipal Fiscal Health in Connecticut” study.<br />
Total taxes collected – as defined by the Connecticut Office of Policy and Management – divided by household<br />
is a rough estimate of the tax burden experienced at the municipal level. This figure aggregates the various types<br />
of property taxes, combining commercial and residential burdens. The aggregation of the tax burden is not<br />
accidental, as high residential taxes can reduce disposable income and suppress economic activity. Furthermore,<br />
attracting skilled, high-demand talent to a given area is much harder when residential taxes are high, forcing<br />
employers to offer premiums over their competitors in low-tax states.<br />
The per-household responsibility for all taxes levied, however, does not account for the relative ability of these<br />
households to carry their portion of the municipalities’ total tax bill. Therefore, our calculation of tax burden<br />
also considers the millage rates of the property taxes assessed by the community. Furthermore, each household’s<br />
ability to pay is partially captured by the economic vitality score through median household income.<br />
Unfunded pension liabilities have grown dramatically across the country since 2001 due to a mixture of asset<br />
underperformance and deferred or partial contributions to pension funds. In Connecticut, pensions never<br />
received proper annual funding until the 2010s, even at the state level, creating massive unfunded backlogs.<br />
Today, these unfunded liabilities have largely crippled state and municipal governments in Connecticut, as<br />
governments have run out of budget gimmicks to avoid inevitable debt-service and unfunded-liability payments.<br />
Residents experience either high taxes with subpar government services or even higher taxes and standard<br />
services.<br />
3 http://ctbythenumbers.info/2016/01/05/income-inequality-in-cts-4th-congressional-district-is-4th-largest-gap-in-nation-2nd-district-has-least-income-inequality-in-state/
The business community, having dealt with the collapse of private-sector pensions over the past 40 years, is<br />
aware that these large unfunded liabilities represent a mortgage on the future of the states and municipalities that<br />
owe them; this goes a long way toward explaining Connecticut’s feeble growth rate in recent years.<br />
In our index, total taxes and future pension obligations per household receive one-third weight in our tax burden<br />
assessment. Millage rates and the total bonded and unfunded liabilities, as determined by Joffe (2017), also each<br />
contribute one-third weight.<br />
Transportation Infrastructure 10%<br />
Connecticut’s transportation infrastructure has fallen into disrepair, despite high gas taxes.4 For the business<br />
community, the mismanagement of transportation funds creates serious problems: Commerce is largely<br />
dependent on businesses’ ability to acquire parts or services from elsewhere, and consumers’ ability to access<br />
goods and services. Without strong transportation infrastructure, the transactions that make commerce possible<br />
are more expensive and potentially prohibitive.<br />
Our research team selected three primary forms of transportation infrastructure: ports of entry, interstate<br />
highways and rail lines. We considered the distance from the center of a municipality to the nearest of each<br />
available mode of transportation, using a variety of indexes and taking averages where minor discrepancies<br />
arose.<br />
Highways like I-95 and I-84 are weighted at 50 percent of the infrastructure category, as they are the main way in<br />
which consumers, commuters and many pre-retail products and services move around the state. The rail system<br />
in Connecticut is not as extensive as it is in other states, but it is used intensively, particularly between Stamford<br />
and Grand Central Station in New York City. For this reason, distance to the nearest rail line is weighted at 30<br />
percent. Lastly, distance to the nearest port of entry, as defined by the U.S. Customs and Border Protection,<br />
attempts to measure a business’ ease of access to larger shipments, often for pre-retail goods like heavy<br />
machinery or raw materials, and is weighted at 20 percent of this category.<br />
<strong>Business</strong>-friendliness index<br />
The four component categories are combined to create an overall business-friendliness index.<br />
The tax burden, community allure and economic vitality categories are weighted at 35 percent each with tax<br />
burden at 20 percent and the transportation infrastructure category making up the final 10 percent. This<br />
weighting reflects both the needs of the current Connecticut economy, which is heavily dependent on the<br />
financial services sector, and the future economy, which will add information technology and 21st century<br />
manufacturing sectors.<br />
4 http://www.connecticutmag.com/the-connecticut-story/connecticut-roads-among-the-nation-s-worstbut-who-pays/article_f20704b0-39c5-11e7-beef-fb00b1bc6ced.html
Connecticut’s <strong>Top</strong> 50 <strong>Business</strong> <strong>Friendly</strong> <strong>Towns</strong>
Citations<br />
Boyd, Lindsay and Westmoreland, Riley. “How <strong>Business</strong> <strong>Friendly</strong> are <strong>Ten</strong>nessee’s Cities?” The Beacon Center.<br />
November, 18, 2013.<br />
Hill, John, Smith, Oran and Crain, Adam. “How Enterprise-<strong>Friendly</strong> are South Carolina’s 50 Largest Cities?”<br />
Palmetto Promise Institute. March, 2017.<br />
Hill, John. “Building <strong>Business</strong> in Alabama: How <strong>Business</strong>-<strong>Friendly</strong> are Alabama’s 50 Largest Cities?” The Alabama<br />
Policy Institute. March, 2014.<br />
Joffe, Marc. Doubly Bound: The Cost of Credit Rates. Haas Institute for a Fair and Inclusive Society. April, 2017.<br />
Total taxes collected, “Municipal Fiscal Indicators, 2016”. Office of Policy and Management, Connecticut.<br />
Retrieved from https://data.ct.gov/Government/Municipal-Fiscal-Indicators-2012-2016-MS-Access-Da/x5e2-<br />
4aw5<br />
In labor force, ACS 5-Year estimate 2016. Census Bureau. United States. Retrieved from https://factfinder.census.<br />
gov/faces/nav/jsf/pages/index.xhtml<br />
Median income (dollars); Estimate; Households. ACS 5-Year estimate 2016. Census Bureau. United States.<br />
Retrieved from https://factfinder.census.gov/faces/nav/jsf/pages/index.xhtml<br />
Total violent crime per 100,000. Uniform Crime Report. Department of Public Safety, Connecticut. Retrieved<br />
from https://www.dpsdata.ct.gov/dps/ucr/ucr.aspx<br />
Total Households, estimate. ACS 5-Year estimate 2016. Census Bureau. United States. Retrieved from https://<br />
factfinder.census.gov/faces/nav/jsf/pages/index.xhtml<br />
Median home value (owner occupied). “Municipal Fiscal Indicators, 2016”. Office of Policy and Management,<br />
Connecticut. Retrieved from https://data.ct.gov/Government/Municipal-Fiscal-Indicators-2012-2016-MS-<br />
Access-Da/x5e2-4aw5<br />
Net pension liability. “Municipal Fiscal Indicators, 2016”. Office of Policy and Management, Connecticut.<br />
Retrieved from https://data.ct.gov/Government/Municipal-Fiscal-Indicators-2012-2016-MS-Access-Da/x5e2-<br />
4aw5<br />
Total population, estimate. ACS 5-Year estimate 2016. Census Bureau. United States. Retrieved from https://<br />
factfinder.census.gov/faces/nav/jsf/pages/index.xhtml<br />
Population (3 year growth), estimate. Authors calculation based on ACS 5-Year estimate 2013 and 2016. Census<br />
Bureau. United States. Retrieved from https://factfinder.census.gov/faces/nav/jsf/pages/index.xhtml<br />
Employed (3 year growth), estimate. Authors calculation based on ACS 5-Year estimate 2013 and 2016. Census<br />
Bureau. United States. Retrieved from https://factfinder.census.gov/faces/nav/jsf/pages/index.xhtml<br />
Percent; Estimate; Population 18 to 24 years - Some college or associate’s degree. ACS 5-Year estimate 2016.<br />
Census Bureau. United States. Retrieved from https://factfinder.census.gov/faces/nav/jsf/pages/index.xhtml<br />
Percent; Estimate; Population 25 years and over - Bachelor’s degree. ACS 5-Year estimate 2016. Census Bureau.<br />
United States. Retrieved from https://factfinder.census.gov/faces/nav/jsf/pages/index.xhtml
Contributors<br />
Suzanne Bates<br />
Isabel Blank<br />
John Hill<br />
Thurston Powers<br />
Scott Shepard


