
You also want an ePaper? Increase the reach of your titles
YUMPU automatically turns print PDFs into web optimized ePapers that Google loves.
CAGR (%)<br />
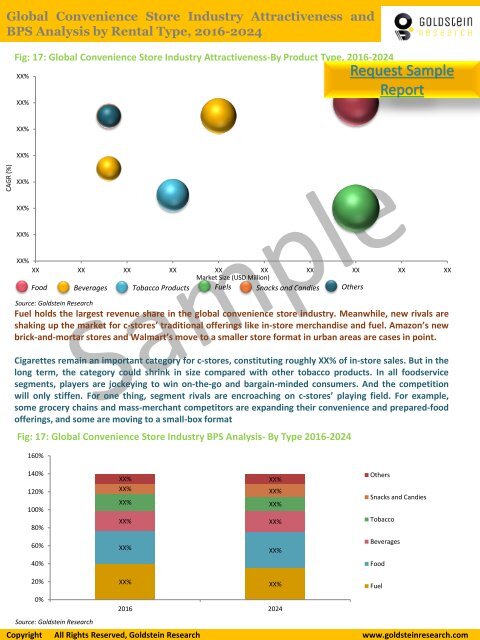
Global <strong>Convenience</strong> <strong>Store</strong> <strong>Industry</strong> Attractiveness and<br />
BPS Analysis by Rental Type, <strong>2016</strong>-<strong>2024</strong><br />
Fig: 17: Global <strong>Convenience</strong> <strong>Store</strong> <strong>Industry</strong> Attractiveness-By Product Type, <strong>2016</strong>-<strong>2024</strong><br />
XX%<br />
XX%<br />
Request S<strong>amp</strong>le<br />
Report<br />
XX%<br />
XX%<br />
XX%<br />
XX%<br />
XX%<br />
XX%<br />
XX XX XX XX XX XX XX XX XX XX<br />
<strong>Market</strong> Size (USD Million)<br />
Food Beverages Tobacco Products Fuels Snacks and Candies Others<br />
Source: Goldstein Research<br />
Fuel holds the largest revenue share in the global convenience store industry. Meanwhile, new rivals are<br />
shaking up the market for c-stores’ traditional offerings like in-store merchandise and fuel. Amazon’s new<br />
brick-and-mortar stores and Walmart’s move to a smaller store format in urban areas are cases in point.<br />
Cigarettes remain an important category for c-stores, constituting roughly XX% of in-store sales. But in the<br />
long term, the category could shrink in size compared with other tobacco products. In all foodservice<br />
segments, players are jockeying to win on-the-go and bargain-minded consumers. And the competition<br />
will only stiffen. For one thing, segment rivals are encroaching on c-stores’ playing field. For ex<strong>amp</strong>le,<br />
some grocery chains and mass-merchant competitors are expanding their convenience and prepared-food<br />
offerings, and some are moving to a small-box format<br />
Fig: 17: Global <strong>Convenience</strong> <strong>Store</strong> <strong>Industry</strong> BPS Analysis- By Type <strong>2016</strong>-<strong>2024</strong><br />
160%<br />
140%<br />
120%<br />
100%<br />
80%<br />
XX%<br />
XX%<br />
XX%<br />
XX%<br />
XX%<br />
XX%<br />
XX%<br />
XX%<br />
Others<br />
Snacks and Candies<br />
Tobacco<br />
60%<br />
XX%<br />
XX%<br />
Beverages<br />
40%<br />
Food<br />
20%<br />
XX%<br />
XX%<br />
Fuel<br />
0%<br />
<strong>2016</strong> <strong>2024</strong><br />
Source: Goldstein Research<br />
Copyright All Rights Reserved, Goldstein Research www.goldsteinresearch.com