

Chapter 2 Rainwater Analysis (Phân tích nước mưa) - Practical Environmental Analysis, 2nd Edition - M. Radojevic, V. Bashkin
https://app.box.com/s/xse2wn3eson14p2iefjpryednq896xhy
https://app.box.com/s/xse2wn3eson14p2iefjpryednq896xhy

Create successful ePaper yourself
Turn your PDF publications into a flip-book with our unique Google optimized e-Paper software.
CHAPTER 2<br />
<strong>Rainwater</strong> <strong>Analysis</strong><br />
2.1 ACID RAIN<br />
<strong>Rainwater</strong>, being an essential component of the hydrologic cycle, plays an<br />
important role in the global cycling of water-soluble chemicals. <strong>Rainwater</strong><br />
serves as a source of many essential nutrients in terrestrial and aquatic<br />
ecosystems. It also acts as a cleanser of the atmosphere, washing out pollutants<br />
from the air and introducing them into surface waters and soils where<br />
they can have damaging effects on natural ecosystems.<br />
One of the major environmental concerns of the present day is the phenomenon<br />
of acid rain. Unpolluted, pure rain is slightly acidic due to the<br />
absorption of atmospheric CO 2 . The pH of water in equilibrium with atmospheric<br />
CO 2 is approximately 5.6 (see Example 2.1) and hence only rain<br />
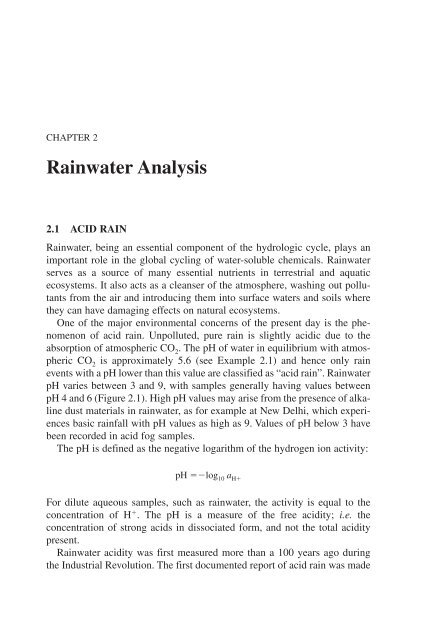
events with a pH lower than this value are classified as “acid rain”. <strong>Rainwater</strong><br />
pH varies between 3 and 9, with samples generally having values between<br />
pH 4 and 6 (Figure 2.1). High pH values may arise from the presence of alkaline<br />
dust materials in rainwater, as for example at New Delhi, which experiences<br />
basic rainfall with pH values as high as 9. Values of pH below 3 have<br />
been recorded in acid fog samples.<br />
The pH is defined as the negative logarithm of the hydrogen ion activity:<br />
pH log 10 a H<br />
For dilute aqueous samples, such as rainwater, the activity is equal to the<br />
concentration of H . The pH is a measure of the free acidity; i.e. the<br />
concentration of strong acids in dissociated form, and not the total acidity<br />
present.<br />
<strong>Rainwater</strong> acidity was first measured more than a 100 years ago during<br />
the Industrial Revolution. The first documented report of acid rain was made
46 <strong>Chapter</strong> 2<br />
Figure 2.1 The pH scale showing typical pH ranges of rainwater and other environmental<br />
samples<br />
by a French scientist, Ducros, who in 1845 published a paper entitled<br />
“Observation d’une pluie acide”. Robert Angus Smith, the world’s first air<br />
pollution inspector, reported acid rain in the city of Manchester in his book<br />
“Air and Rain” published in 1872. However, it is only in the last 35 years that<br />
widespread concern has been expressed over acid rain. In the 1960s,<br />
Scandinavian scientists began to link the mysterious disappearance of fish<br />
from lakes and streams to the wind blown pollution from the United<br />
Kingdom and central Europe. This led to a renewed interest in the phenomenon<br />
of acid rain. Nowadays, the term “acid rain” encompasses not only<br />
rainwater but also the deposition of all acidic pollutants, whether as rain, fog,<br />
cloud, dew, snow, dust particles, or gases.<br />
Although first recognised as a regional problem in Europe and North<br />
America, where many of the effects have been extensively studied and documented,<br />
acid rain is now observed throughout the world, even at sites far<br />
removed from industrial sources of pollution, such as the polar ice caps and<br />
tropical rainforests. Within one generation, acid rain has grown from being a<br />
local and regional nuisance to a major global environmental problem.
<strong>Rainwater</strong> <strong>Analysis</strong> 47<br />
Example 2.1<br />
Calculate the pH of rainwater in equilibrium with atmospheric CO 2 (CO 2<br />
0.036%) at 25°C given that K H 0.031 mol L 1 atm 1 ; K 1 4.3 <br />
10 7 mol L 1 ; and K 2 5 10 11 mol L 1 .<br />
The relevant equilibria to consider are the dissolution of CO 2 gas in<br />
water and the dissociation of dissolved CO 2 in aqueous solution:<br />
CO 2 H 2 O CO 2 . H 2 O K H [CO 2<br />
. H2 O]/pCO 2<br />
CO 2<br />
. H2 O HCO 3 H K 1 [HCO 3 ][H ]/[CO 2<br />
. H2 O]<br />
HCO 3<br />
<br />
CO 3 2 H K 2 [CO 3<br />
2<br />
][H ]/[HCO 3 ]<br />
We can set up the following electroneutrality balance:<br />
[H ] [OH ] [HCO 3 ] 2[CO 3<br />
2<br />
]<br />
We can assume that the solution will be acidic due to the above dissociation<br />
reactions:<br />
[OH ][H ]<br />
Also, since K 2 K 1 , we can assume that the concentration of CO 3<br />
2<br />
will<br />
be insignificantly small:<br />
[CO 3<br />
2<br />
] [HCO 3 ]<br />
Eliminating OH and CO 3<br />
2<br />
from the electroneutrality balance, we are left<br />
with:<br />
[H ] [HCO 3 ]<br />
Substituting into the expression for K 1 , we get:<br />
and<br />
K 1 <br />
[H ] 2<br />
HpCO2<br />
[H ] (K H K 1 pCO 2 ) 1/2<br />
Substituting the values of K H , K 1 , and pCO 2 expressed in atmospheres<br />
(since 0.036% is the partial pressure of CO 2 , and the total pressure is 1<br />
atm, 0.036% 0.036/100 atm 3.6 10 4 atm).<br />
[H ] (0.031 4.3 10 7 3.6 10 4 ) 1/2 2.19 10 6 mol L 1<br />
pH log 10 [H ] log 10 2.19 10 6 5.66
48 <strong>Chapter</strong> 2<br />
2.1.1 Causes of Acid Rain<br />
A simplified illustration of the acid rain phenomenon is given in Figure 2.2.<br />
Acid rain originates from the conversion of pollutant gases emitted from the<br />
chimney stacks of coal- and oil- burning power stations, smelters, refineries,<br />
chemical plants, and motor vehicles. In the past, SO 2 was the major contributor<br />
to acid rain, however, the contribution of NO x to acid rain has been<br />
increasing steadily. Nowadays, the contribution of these two pollutants to<br />
rainwater acidity is roughly equal, due to the increasing number of cars on<br />
the roads and the reduction in SO 2 emissions, and in some urbanised areas<br />
the contribution of NO x exceeds that of SO 2 .<br />
Sulfur dioxide gas is oxidised in the atmosphere to sulfuric acid, which is<br />
readily absorbed by rain. The oxidation proceeds via a variety of mechanisms.<br />
In the gas phase, SO 2 is oxidised predominantly by hydroxyl (OH • )<br />
radicals. Sulfur dioxide may also dissolve in cloud droplets according to the<br />
following equilibria to produce dissolved SO 2 , bisulfite (HSO 3 ), and sulfite<br />
2<br />
(SO 3 ) ions:<br />
SO 2 H 2 O SO 2·H 2 O K H [SO 2 . H 2 O]/pSO 2<br />
SO 2<br />
. H2 O HSO 3 H K 1 [HSO 3 ][H ]/[SO 2·H 2 O]<br />
HSO 3<br />
<br />
SO 3 2 H K 2 [SO 3<br />
2<br />
][H ]/[HSO 3 ]<br />
where K H is Henry’s law constant for SO 2 and K 1 and K 2 the first and second<br />
dissociation constants. At pH values typical of rainwater (3–6), dissolved<br />
SO 2 is present mainly as the bisulfite ion (Figure 2.3). The total of dissolved<br />
species is designated by S(IV):<br />
[S(IV)] [SO 2<br />
. H2 O] [HSO 3 ] [SO 3<br />
2<br />
]<br />
In the droplets, S(IV) can be oxidised to sulfate (SO 4<br />
2<br />
) by dissolved hydrogen<br />
peroxide (H 2 O 2 ) and ozone (O 3 ). In polluted air, trace metals such as iron and<br />
manganese may catalyse the oxidation of SO 2 by oxygen in the cloud drops.<br />
The reaction is pH dependent; the rate of oxidation increases with the increasing<br />
pH. Oxides of nitrogen, produced during combustion, are converted to<br />
nitric acid in the atmosphere mainly by gas-phase reactions. Hydrochloric<br />
acid, present in power station plumes at low concentrations, makes only a<br />
minor contribution to acid rain.<br />
Natural processes can also give rise to rainwater acidity. Many of the precursor<br />
gases are produced during volcanic eruptions and forest fires. Also,<br />
reduced sulfur compounds such as hydrogen sulfide and dimethyl sulfide are<br />
emitted by planktons and by biological degradation in coastal and inland<br />
marshes and soils. These compounds are oxidised to SO 2 in the atmosphere.
<strong>Rainwater</strong> <strong>Analysis</strong> 49<br />
Figure 2.2 Illustration of the pathways of acid rain
50 <strong>Chapter</strong> 2<br />
Figure 2.3 Mole fraction of S(IV) species as a function of pH<br />
In addition, weak organic acids such as formic and acetic acids, originating<br />
from natural sources, can make a significant contribution to the rainwater<br />
acidity, especially at unpolluted rural and remote sites. Currently, about half<br />
of the global emissions of sulfur and NO x compounds originate from anthropogenic<br />
sources. Some 68% of anthropogenic emissions of SO 2 and NO x<br />
originate in Europe and North America, but the contribution of developing<br />
countries, especially in Asia is rapidly rising. Plumes of pollutants can travel<br />
hundreds or even thousands of kilometers from their source before being<br />
converted to acid rain. This so-called long-range transport of air pollution<br />
(LRTAP) has become a major political issue because of the trans-boundary<br />
movement of pollution between countries.<br />
Sulfur compounds are removed from the atmosphere by deposition<br />
processes. Gases dissolve in cloud droplets whereas dust particles are incorporated<br />
into cloud droplets either as cloud condensation nuclei (CCN)<br />
around which the droplets grow, or by scavenging mechanisms. These<br />
processes are referred to as rainout. The incorporation of dust particles and<br />
gaseous molecules into falling raindrops is called washout. Both rainout and<br />
washout are termed wet deposition. Dry deposition involves sedimentation of<br />
dust particles and diffusion of gaseous molecules onto surfaces. Dry deposition<br />
processes are generally more important because they are closer to the<br />
source of pollution.<br />
2.1.2 Effects of Acid Rain<br />
Since the initial link between acid rain and dying fish was made some 30<br />
years ago, a number of other harmful effects of acid rain have been uncovered.<br />
Some of these effects, given in Table 2.1, have been conclusively
<strong>Rainwater</strong> <strong>Analysis</strong> 51<br />
Table 2.1 The harmful effects of acid rain<br />
Effect Mechanism Evidence<br />
Fish deaths Toxicity is mainly due to the Salmon and brown trout have<br />
release of Al from sediments. disappeared from thousands of<br />
The Al causes clogging of<br />
weakly buffered lakes and rivers in<br />
the gills with mucus<br />
Scandinavia, Canada, USA and<br />
lochs in Scotland<br />
Forest decline Poorly understood. Various First observed in Germany in the<br />
hypotheses have been proposed, mid-1970s. Nearly 25% of all the<br />
one of which is that the acid rain trees in Europe have been classified<br />
releases toxic Al from soil, which as damaged. Typically, fir trees<br />
damages the roots and interferes lose needles and the crowns of<br />
with the uptake of nutrients. Other Norway spruce become thinner<br />
contributing stresses include and needles turn brown. Deciduous<br />
drought, cold, disease, and trees are also affected<br />
other pollutants (e.g. O 3 )<br />
Building SO 2 reacts with limestone (CaCO 3 ) Air pollution damage of historical<br />
damage to form gypsum (CaSO 4·H 2 O), monuments has been documented<br />
which is more soluble and can in Europe, North America, and<br />
readily be washed off by rain Asia. Notable cases are the city of<br />
Cracow in Poland, the Acropolis in<br />
Athens, and the Taj Mahal in India<br />
Health Accelerates heavy metal migration Uncertain<br />
damage in food chains and accumulation<br />
of heavy metals in drinking<br />
water and foodstuffs<br />
proven while others still remain a source of controversy due to the poor<br />
understanding of some of the mechanisms of damage.<br />
Acid rain can acidify lakes and rivers, leading to the mobilisation of soluble<br />
aluminium which, together with low pH, has been implicated in fish<br />
deaths, although the mechanism is far from simple. The toxic effects are<br />
dependent upon the species of fish, the concentration of calcium in the water,<br />
and the pH. Acid rain can also accelerate the corrosion of limestone and iron<br />
thus damaging important historical monuments and other building structures;<br />
it may adversely affect plant growth, leading to forest decline and crop<br />
damage; and it could even lead to increasing levels of toxic metals in water<br />
supplies.<br />
Recently, the concept of critical loads has been developed in order to<br />
quantify and assess the potential of damage to sensitive receptor areas. A<br />
critical load is the threshold concentration of a pollutant at which harmful<br />
effects begin to be observed and it is usually determined using sophisticated<br />
models. Weakly buffered soils, such as those found in Scandinavia, exhibit<br />
particularly low critical loads for acidity. Maps of critical loads of various<br />
regions of the world have been prepared in order to predict effects and assist<br />
in the control of acidic pollution.
52 <strong>Chapter</strong> 2<br />
2.1.3 Control of Acid Rain<br />
As a consequence of the widespread scientific and public concern over the<br />
harmful effects of acid rain, national governments and international organisations<br />
have instituted numerous research studies of acid rain, and legal and<br />
technological measures have been taken to reduce the problem.<br />
The United Nations Economic Commission for Europe (UNECE)<br />
Convention on LRTAP which went into force in 1983 and the UNECE protocols<br />
of 1985 and 1994 aim to greatly reduce the emissions of SO 2 and NO x .<br />
Legislation aimed at reducing emissions of SO 2 and NO x was also passed in<br />
the USA.<br />
Emissions of precursor gases can be reduced by taking measures before,<br />
during, or after fuel combustion. These measures include:<br />
●<br />
●<br />
●<br />
●<br />
●<br />
●<br />
Fuel switching (i.e. changing from high sulfur coals to low sulfur coals<br />
or natural gas).<br />
Fuel desulfurisation (e.g. washing of coal to remove sulfur or coal gasification).<br />
Cleaner combustion technologies (e.g. fluidised bed combustion (FBC)<br />
and low-NO x burners).<br />
Flue gas desulfurisation (e.g. scrubbing of the flue gas with limestone<br />
slurry, seawater, or some other solution that absorbs SO 2 ).<br />
Selective reduction of NOx to N 2 (e.g. injection of NH 3 into the flue<br />
gases over a bed of catalyst).<br />
Three-way catalytic converter to reduce NOx emissions from motor<br />
vehicles.<br />
Introduction of these control measures has led to reduction in emissions in<br />
many of the developed nations; however, emissions in many developing<br />
countries are rising. Post-emission controls include liming of affected lakes<br />
and soils to neutralise the acidity. This does not, however, represent a longterm<br />
solution to the problem since liming has to be repeated as the water<br />
becomes acidic again with time.<br />
2.2 SAMPLING AND ANALYSIS<br />
The growing concern over acid rain has led to the establishment of many<br />
national and international monitoring programmes that analyse rainwater on<br />
a regular basis. One such world-wide network is operated as part of the<br />
Global Atmosphere Watch (GAW) by the World Meteorological<br />
Organisation (WMO). The main chemical parameters, which are determined<br />
in these surveys are: pH, conductivity, sulfate, nitrate, chloride, ammonium,<br />
sodium, potassium, calcium, and magnesium concentrations. Increasingly,
<strong>Rainwater</strong> <strong>Analysis</strong> 53<br />
organic acids (formic and acetic) and trace metals are also being determined.<br />
Common techniques of acid rain analysis are summarised in Table 2.2.<br />
Concentration ranges of the various ions in rainwater are given in Table 2.3.<br />
Although rainwater analysis may appear to be fairly straightforward, it is<br />
in fact quite problematic. Sources of error common with other types of environmental<br />
samples are present and these are greatly exacerbated because of<br />
the low concentrations of ions present in rainwater. Many rainwater samples,<br />
especially at remote locations are almost as pure as laboratory-grade waters.<br />
Therefore, great care must be taken when handling, storing, and analysing<br />
rainwater samples in order to maintain sample integrity.<br />
Sources of error in acid rain analysis include:<br />
●<br />
●<br />
●<br />
●<br />
●<br />
●<br />
contamination by biological materials (e.g. insects) during sampling;<br />
evaporation from samples;<br />
absorption/desorption of gases during sampling or in the laboratory;<br />
chemical or biological reactions during sampling or storage;<br />
interaction with bottle materials; and<br />
inadvertent contamination during sample handling, treatment, or analysis.<br />
Table 2.2 Common techniques of rainwater analysis<br />
Analytical technique<br />
Analyte<br />
Conductivity meter<br />
Conductivity<br />
Ion chromatograph (IC) Cl 2<br />
,NO 3 ,SO 4 ,NH 4 ,Na ,K ,Mg 2 ,Ca 2 ,<br />
formate, acetate<br />
Flame atomic absorption<br />
Na ,K ,Mg 2 ,Ca 2<br />
spectroscopy (FAAS)<br />
Flame atomic emission<br />
Na ,K ,Mg 2 ,Ca 2<br />
spectroscopy (FAES)<br />
Inductively coupled plasma (ICP) Na ,Mg 2 ,Ca 2 , trace metals<br />
Graphite furnace atomic absorption Trace metals<br />
spectroscopy (GFAAS)<br />
Ion selective electrodes (ISE) H ,Cl ,NO 3 ,Na ,K ,NH 4 ,<br />
some trace metals<br />
Voltammetry<br />
Trace metals<br />
Table 2.3 Concentrations of major ions in rainwater<br />
Ion Concentration (mg L 1 )<br />
Chloride 0.02–60<br />
Nitrate 0.1–20<br />
Sulfate 0.1–30<br />
Sodium 0.02–30<br />
Potassium 0.02–2<br />
Magnesium 0.005–2<br />
Calcium 0.02–4<br />
Ammonium 0.03–4
54 <strong>Chapter</strong> 2<br />
Ammonia and organic acids are especially prone to reaction during storage<br />
and the use of additives such as chloroform or thymol is recommended<br />
for preserving samples for these analyses.<br />
<strong>Rainwater</strong> samples can be of two types: wet-only or bulk. Wet-only samples<br />
are collected using specialised automatic samplers, which open only during the<br />
shower and close during the dry periods, therefore eliminating contamination<br />
by falling dust particles during the dry periods. Samples collected with such<br />
samplers are termed wet deposition or rainwater-only samples. Originally,<br />
rainwater was collected into buckets or funnels inserted in bottles, the so-called<br />
bulk collectors, and these samplers are still in use today, especially at remote<br />
or inaccessible sites. These collectors sample not only rainwater (wet deposition)<br />
but also dust particles and gases during dry periods between rainfalls (dry<br />
deposition) and are said to collect bulk deposition. These samplers have the<br />
advantage that they do not require electric power and they can be placed at<br />
remote and inaccessible locations. The effect of dry deposition may be minimised<br />
by exposing the collectors in the field just before the shower and<br />
removing them just after the shower. However, in many instances it is desirable<br />
to sample both the wet and dry deposition in order to get an estimate of the<br />
total deposition of a substance. In this case, bulk samplers are left exposed in<br />
the field for periods from 1 day to 1 month. In many surveys it is common to<br />
leave the samplers exposed a week at a time. However, the use of bulk samplers<br />
to evaluate total deposition has been criticised, and it is recommended<br />
that the dry deposition be evaluated on the basis of airborne concentrations.<br />
The pH of rainwater is one of the most difficult measurements to perform<br />
accurately, and doubts have been expressed about many measurements<br />
reported in the literature. This is illustrated in Table 2.4, which summarises<br />
the measurements of pH in a dilute acid solution as carried out by the<br />
National Bureau of Standards in the USA. Even in these controlled experiments<br />
performed by well-trained technicians under best conditions, the<br />
Table 2.4 Response of new, research grade combination pH electrodes in 10 4 mol<br />
L 1 HCl<br />
(From a study by the National Bureau of Standards, Washington, adapted<br />
from Ref. 1)<br />
Recorded pH value<br />
Electrode Quiescent Stirred Difference<br />
1 3.944 3.816 0.128<br />
2 3.864 3.661 0.203<br />
3 3.908 3.741 0.167<br />
4 3.899 3.841 0.058<br />
5 3.875 3.755 0.120<br />
Range 0.080 0.180 0.145
<strong>Rainwater</strong> <strong>Analysis</strong> 55<br />
measurements vary by as much as 50% when expressed as H concentrations.<br />
The problems of pH analysis are due to:<br />
● difference in ionic strength between samples and buffers used to standardise<br />
pH electrodes;<br />
● stirring errors;<br />
● absorption of laboratory gases (e.g. NH3 ,CO 2 );<br />
● chemical reactions (e.g. dissolution of alkaline dust particles in suspension);<br />
and<br />
● biological reactions (e.g. degradation of weak acids such as formic and<br />
acetic acids).<br />
2.3 DATA ANALYSIS AND INTERPRETATION<br />
Theoretically, the sum of cations must equal the sum of the anions when<br />
expressed in equivalents, if all the components have been analysed correctly.<br />
This is called the electroneutrality balance and it can be used as a check on<br />
the validity of an analysis:<br />
cations anions<br />
If the ratio of cations:anions is less than 0.85 and greater than 1.15, the data<br />
are considered questionable, in which case the results are rejected and the<br />
sample analysed again. When performing an ion-balance calculation it is<br />
important to use the H concentrations based on pH measurements made at<br />
the time of the chemical analysis and not on field pH values or pH measurements<br />
made after sample collection, unless the chemical analyses were performed<br />
immediately upon collection. This is because there can be<br />
considerable changes in pH during storage as a result of reaction.<br />
An additional check on the analysis involves calculating the conductivity<br />
of the sample on the basis of the measured concentrations:<br />
κ c λ i C i<br />
where κ c is the conductivity in µmho cm 1 , λ i the equivalent conductance of<br />
the ith ion adjusted for units (see Table 2.5), and C i the concentration in µeq<br />
L 1 of the ith ion. The calculated conductivity is compared to the measured<br />
value, κ m , to give the conductivity difference, %CD:<br />
%CD 100(κ c κ m /κ m )<br />
The US EPA criteria for rejection of results and re-analysis of samples are<br />
given in Table 2.6 (see Example 2.2).
56 <strong>Chapter</strong> 2<br />
Table 2.5 Equivalent conductance at infinite dilution and 25°C<br />
adjusted for the units specified<br />
Ion<br />
H 0.35<br />
Cl 0.076<br />
<br />
NO 3 0.071<br />
2<br />
SO 4 0.08<br />
<br />
NH 4 0.074<br />
Na 0.050<br />
K 0.074<br />
Mg 2 0.053<br />
Ca 2 0.060<br />
<br />
HCO 3 0.044<br />
Equivalent conductance (µmho cm 1 ) per µeq L 1<br />
Table 2.6 US EPA criteria for re-analysis of samples<br />
Measured conductance (µmhos cm 1 )<br />
%CD<br />
5<br />
50<br />
5–30 30<br />
30<br />
20<br />
Samples collected in rainwater surveys generally exhibit a negative relationship<br />
between ion concentration and precipitation amount. This typical<br />
dilution effect is illustrated in Figure 2.4 for one component. Generally, low<br />
rainfall amounts result in high concentrations whereas heavy rains result in<br />
more dilute samples. Also, initial stages of rainfall exhibit higher concentrations<br />
of ions than later stages due to the initial washout of the dust and gases<br />
in the atmosphere below cloud base. A typical profile of some ions in one<br />
particular storm is shown in Figure 2.5 to illustrate this effect. The lower<br />
concentrations associated with the later stages of rainstorms are generally<br />
considered to reflect cloudwater concentrations as they result primarily from<br />
rainout.<br />
Example 2.2<br />
A rainwater sample was analysed and the following concentrations determined<br />
(in mg L 1 ): 0.34 Na , 0.14 K , 0.08 Mg 2 , 0.44 Ca 2 , 0.78 Cl ,<br />
2<br />
0.72 NO 3 , 0.86 SO 4 , and 0.015 NH 4 . The pH was 5.03 and the conductivity<br />
10.9 µmho cm 1 . Calculate the conductivity and compare to the<br />
measured conductivity. Does the sample need to be re-analysed?<br />
First of all, convert the concentrations to units of µeq L 1 as follows:<br />
(µeq L 1 ) 1000 (mg L 1 )/equivalent mass
<strong>Rainwater</strong> <strong>Analysis</strong> 57<br />
where the equivalent mass is the same as the ionic mass for monovalent<br />
ions, but half the ionic mass for divalent ions, as illustrated in the table<br />
below:<br />
H Na K Mg 2 Ca 2 Cl NO 3<br />
<br />
SO 4<br />
2<br />
NH 4<br />
<br />
mg L 1 — 0.34 0.14 0.08 0.44 0.78 0.72 0.86 0.015<br />
eq mass 1.01 22.99 39.10 12.15 20.04 35.45 62.01 48.04 18.05<br />
µeq L 1 9.33 14.79 3.58 6.58 21.96 22.00 11.61 17.90 0.83<br />
Calculate the conductivity, κ c by multiplying the concentrations in µeq<br />
L 1 with the appropriate factor in Table 2.5:<br />
κ c λ i C i (9.33 0.35) (14.79 0.05) (3.58 0.074) <br />
(6.58 0.053) (21.96 0.06) (22.00 0.076) (11.61 0.071)<br />
(17.9 0.08) (0.83 0.074) 9.93 µmho cm 1<br />
Comparing to the measured value, we can calculate the conductivity difference<br />
in % as:<br />
%CD 100(κ c κ m )/κ m 100(9.93 10.9)/10.9 8.9%<br />
The US EPA criteria (see Table 2.6) stipulate that if %CD is 30 for<br />
samples having measured conductivities in the range of 5–30 µmho cm 1 ,<br />
they should be re-analysed. Since, for the sample in this example, %CD<br />
8.9%, we can conclude that there is good agreement between the<br />
measured and calculated conductivities and the results can be accepted as<br />
valid.<br />
Questions and Problems<br />
1. Discuss the chemical processes that lead to the formation of acid rain.<br />
2. Discuss the effects of acid rain.<br />
3. How can the acid rain problem be minimised?<br />
4. Why is liming not an effective long-term solution to surface water<br />
acidification?<br />
5. Outline the main analytical techniques and sampling methods that are<br />
used in rainwater surveys. List the major analytes and suggest appropriate<br />
analytical techniques for each analyte.<br />
6. Calculate the concentrations of HSO 3 and SO 3<br />
2<br />
in equilibrium with 5<br />
ppbv SO 2 at: (a) pH 4, (b) pH 7, and (c) pH 9. Use the following equilibrium<br />
constants for SO 2 : K H 1.24 mol L 1 atm 1 , K 1 1.74 10 2<br />
mol L 1 , and K 2 6.24 10 8 mol L 1 .
58 <strong>Chapter</strong> 2<br />
Figure 2.4 Concentration versus rainfall amount<br />
7. Calculate the pH of water in equilibrium with 10 ppbv SO 2 using the<br />
equilibrium constants given in the previous question.<br />
8. Convert the following concentrations to µeq L 1 :<br />
(a) 3.5 mg L 1 SO 4<br />
2<br />
(b) 25 mg L 1 PO 4<br />
3<br />
(c) 18 mg L 1 NO 3<br />
<br />
(d) 98 µg L 1 Ca 2<br />
9. A rainwater sample was analysed and found to have the following<br />
composition in mg L 1 : 1.47 Na , 1.53 K , 0.29 Mg 2 , 2.56 Ca 2 ,<br />
0.39 Cl , 2.01 NO 3 , 0.38 SO 4<br />
2<br />
, and 0.12 NH 4 . The pH of the sample<br />
was 5.01 and the conductivity was 17.2 µmho cm 1 . Check the correctness<br />
of the analysis by means of the electroneutrality balance and<br />
conductivity calculation. Should the results of the analysis be rejected<br />
or not?<br />
10. Bicarbonate (HCO 3 ) is not normally included in checks of validity as<br />
it is not normally determined in rainwater. Calculate the concentration<br />
of HCO 3 in the above example (question 9) assuming the sample is in<br />
equilibrium with the atmospheric CO 2 . What difference would inclusion<br />
of HCO 3 in the electroneutrality balance and the conductivity<br />
calculation make to your conclusions (use equilibrium constants given<br />
in Example 2.1)?
<strong>Rainwater</strong> <strong>Analysis</strong> 59<br />
Figure 2.5 Concentrations of some ions in rainwater during a tropical rainstorm as a function<br />
of time from the beginning of the shower<br />
2.4 pH, CONDUCTIVITY, AND MAJOR ANIONS<br />
2.4.1 Methodology<br />
The pH and conductivity are determined immediately on fresh samples using<br />
electrochemical methods. Major ions may be determined in stored samples.<br />
In the present experiment, chloride, nitrate, and sulfate concentrations are<br />
determined by IC at the same time as the pH and conductivity. The samples<br />
are stored at 4°C in a refrigerator for subsequent cation analysis by AAS.<br />
2.4.2 Bottle Preparation<br />
2.4.2.1 Materials.<br />
● Polypropylene bottles (any size between 150 mL and 1 L)
60 <strong>Chapter</strong> 2<br />
2.4.2.2 Experimental Procedure. Take several polypropylene bottles<br />
(150–1000 mL), label them, and weigh them on an open top balance. Record<br />
the weights of the empty bottles. Before sampling rainwater it is necessary<br />
to clean the sampling bottles. Take the weighed 150 mL polypropylene bottles<br />
and repeatedly rinse them with laboratory-grade water. Then fill the<br />
cleaned bottles with laboratory grade water to the brim and cap. Some bottles<br />
may be filled with water and analysed as blanks. You should take these<br />
blank bottles into the field and back to the laboratory, and store in the same<br />
way as your samples. An analysis of these blanks may reveal just how rigorous<br />
you are in your work; if any contamination shows up, it means that you<br />
are being sloppy!<br />
Although chemical-cleaning reagents such as chromic acid or DECON 90<br />
may be used for cleaning bottles, extreme care must be taken to avoid contamination<br />
of the bottles by the cleaning reagent itself. Due to the great<br />
purity of many rainwater samples even minute traces of contaminants could<br />
lead to errors.<br />
2.4.3 Sampling<br />
2.4.3.1 Materials.<br />
● Polypropylene funnel 15–25 cm in diameter or a plastic bucket<br />
● Retort stand and clamp<br />
2.4.3.2 Experimental Procedure. The main objective is to obtain a representative<br />
sample and to avoid any contamination. Find a suitable sampling<br />
location, giving consideration to the following criteria. The sampler should<br />
be placed in an open area with no obstructions above or near the sampler<br />
which may impede the flow of falling rain, or contaminate the sample (i.e.<br />
do not place the sampler under or near trees, near tall buildings, next to walls,<br />
etc.). Good locations for placing samplers are flat roofs of building or in a<br />
clearing such as a field. The sampler should be placed at a height of 1 m<br />
above the surface if possible.<br />
Take a 150–1000 mL sampling bottle, empty out the water, and shake it<br />
to dislodge any droplets of water. Insert into the bottle the polypropylene<br />
funnel and expose the sampler in the field at your chosen sampling site. You<br />
may have to use a retort stand and clamp, or some other method, to hold the<br />
bottle and the funnel firm and prevent the sampler from toppling over in the<br />
wind. If you do not have a funnel you may use a bucket to collect the sample<br />
and transfer it to a bottle after collection. Be sure to note exactly the time<br />
and date when you expose the sampler in the field as well as the time and<br />
date when you remove the sampler from the site or change over the sampling<br />
bottle. Ideally, you should expose the sampler just before a shower and
<strong>Rainwater</strong> <strong>Analysis</strong> 61<br />
bring it indoors immediately after the shower, but this may not be always<br />
practical. During very heavy showers, the bottle may fill up very quickly. In<br />
this case, do not allow the bottle to overflow but keep changing the bottles<br />
over, recording exactly the time of exposure of each bottle. During slight<br />
drizzle, you may have to expose the sampler through several rain events to<br />
collect sufficient sample volume for analysis (i.e. ca. 100 mL). Remember<br />
to note the location and time of sampling as well as any other observations<br />
that may help you in interpreting your results (e.g. meteorological factors<br />
relating to the time of your sampling as reported in the local newspapers or<br />
on television; visual observations of nearby forest fires; proximity of any air<br />
pollution sources; presence of insects or bird droppings in your sample;<br />
presence of dust particles in your sample, etc.). You may use larger sampling<br />
bottles (1 or 2 L) and leave the bottles exposed for longer periods<br />
(1 day, 1 week, etc.) if you are carrying out long-term deposition surveys<br />
rather than studying individual rain events. If you are using an automatic<br />
wet-only collector to sample rain, then follow the appropriate operating<br />
instructions.<br />
Ideally, you should bring the collected samples immediately to the laboratory<br />
for pH and conductivity analysis. If this is not possible, leave the sampling<br />
bottle in your home refrigerator until such time as you can take it to the<br />
laboratory (keeping samples in a refrigerator used for food is not a good idea<br />
if you are carrying out a research project into organic contaminants in rainwater).<br />
Ensure that your samples are labelled in such a way that they will not<br />
be confused with samples of other students.<br />
Before carrying out any analysis, weigh the bottle with the rainwater sample<br />
on an open-top balance. From the difference between the weights of the<br />
bottle containing the sample and the same bottle when it was empty, calculate<br />
the volume of the rainwater collected.<br />
2.4.4 Conductivity<br />
2.4.4.1 Materials.<br />
● Conductivity meter<br />
● Potassium chloride (KCl)<br />
2.4.4.2 Experimental Procedure. Prepare a standard solution for calibration<br />
of the conductivity meter as follows. Weigh out accurately 5.1 g of KCl<br />
and dilute to 1 L with pure water in a 1 L volumetric flask. Dilute 10 mL of<br />
this solution to 1 L with pure water in a 1 L volumetric flask. This is your<br />
working standard which has a conductivity of 100 µmho cm 1 .<br />
Read the instruction manual for the conductivity meter or ask the demonstrator<br />
to explain the operation of the instrument. Using the conductivity
62 <strong>Chapter</strong> 2<br />
meter, carry out the measurements as follows: Place the working KCl standard<br />
solution in a small beaker and suspend the conductivity cell in the solution<br />
holding it approximately 1.5 cm above the bottom of the beaker and<br />
make sure that it is not in contact with any of the beaker walls. Adjust the<br />
conductivity reading to 100 µmho cm 1 . Rinse the cell with pure water, and<br />
carry out the measurement on your sample in the same way. You do not need<br />
to calibrate the meter between each sample, but you must rinse the cell<br />
between each reading. Also analyse the water blanks. These should have conductivities<br />
no higher than your pure water. Always measure the conductivity<br />
before the pH. Leakage of electrolyte from the pH electrode can cause a significant<br />
change in the conductivity of highly pure, low conductivity samples.<br />
When not in use store the electrode by immersing in laboratory water.<br />
2.4.5 pH<br />
2.4.5.1 Materials.<br />
● Buffer solutions, pH 4 and 7<br />
● pH meter, preferably with a combination of pH electrode and temperature<br />
compensation probe.<br />
● Magnetic stirrer and stirring bar<br />
2.4.5.2 Experimental Procedure. Ideally, the pH measurement should be<br />
made immediately after sample collection but this may not always be possible<br />
in practice. Use the pH meter and electrode as follows. First, calibrate the<br />
combination pH electrode and meter using a two-point calibration with<br />
buffer solutions of pH 7 and 4. A technician or demonstrator will show you<br />
how to operate the pH meter; otherwise follow the instructions in the instrument<br />
manual. After calibration, immerse the pH electrode in the rainwater<br />
sample and take a measurement. You may swirl the solution but allow it to<br />
come to rest before taking the measurement. Alternatively, you may place a<br />
magnetic stirring bar in the solution and stir for 15 s on a magnetic stirrer.<br />
After turning the stirrer off, allow the pH to stabilise (ca. 2 min) before taking<br />
the reading. You may notice that in some solutions, the pH value drifts.<br />
In case of drift, allow the reading to stabilise before recording the pH value.<br />
If the reading does not stabilise, and the electrode performance is satisfactory,<br />
record the pH value reached after 5 min and report this. The drift could<br />
be due to chemical changes going on in the sample and not due to a faulty<br />
electrode. You can test the performance of the electrode by measuring the pH<br />
of a dilute acid solution (e.g. HCl or H 2 SO 4 ) of pH 4 and noting the pH measured<br />
and the response time. Report the pH to two decimal places. Rinse the<br />
electrode with laboratory water and swab it dry between each reading. When<br />
taking readings, suspend the electrode in the test solution making sure that it
<strong>Rainwater</strong> <strong>Analysis</strong> 63<br />
does not touch the walls of the beaker. When not in use, leave the electrode<br />
soaking in laboratory water or buffer solution. New electrodes should be<br />
cleaned with a weak acid solution (0.01 M) and subsequently stored in pH 4<br />
buffer. If the electrode response is sluggish rejuvenate it according to the<br />
directions given in Appendix B.<br />
2.4.6 Ion Chromatography (Chloride, Nitrate, and Sulfate)<br />
2.4.6.1 Materials.<br />
● IC (e.g. Shimadzu) equipped with conductivity detector, and integrator<br />
or chart recorder.<br />
● Anion separator column (e.g. Shim-pack IC-A1)<br />
● Syringe and microfilters<br />
● Stock solutions of<br />
2 Cl ,NO 3 ,SO 4 , and 1000 mg L 1 each. These can<br />
be purchased from suppliers, otherwise prepare your own by dissolving<br />
the following amounts of salts in water and making up to 1 L: 1.6458 g<br />
NaCl, 1.3707 g NaNO 3 , and 1.8141 g K 2 SO 4 . Dry the salts in an oven at<br />
110°C for 2 h before weighing.<br />
● Mobile phase for IC: 2.5 mM phthalic acid, 2.5 mM Tris (hydroxymethyl)<br />
aminomethane, and pH 4.0. Filter through a Millipore<br />
HATF (0.45 µm) filter before use.<br />
2.4.6.2 Experimental Procedure. In the example given here, ions are separated<br />
using non-suppressed IC. Prepare and filter the mobile phase for IC.<br />
A technician or demonstrator will turn on the IC and integrator for you, and<br />
make all the necessary adjustments. Typical operating conditions with one<br />
particular type of instrument (Shimadzu) are given in Table 2.7. You may<br />
have to optimise the chromatographic and conductivity detector conditions<br />
to obtain suitable peaks. The anion separator column will vary depending on<br />
the brand of instrument that you will use. The Shim-pack IC-A1 column is<br />
for use with a Shimadzu IC.<br />
Dilute 1000 mg L 1 stock solutions to prepare mixed calibration standards,<br />
each containing the following concentrations of Cl , NO 3 , and<br />
Table 2.7 IC and operating conditions<br />
Shimadzu IC HIC-6A<br />
Shimadzu SCL-6B system controller<br />
Shimadzu LC-6A liquid chromatography pump<br />
Shimadzu CDD-6A conductivity detector<br />
Shim-pack IC-A1 column<br />
Flow rate 1.5 mL min 1<br />
Gain 1 µS cm 1
64 <strong>Chapter</strong> 2<br />
SO 4<br />
2<br />
: 0.1 mg L 1 , 0.2 mg L 1 , 0.5 mg L 1 , 0.8 mg L 1 , and 1.0 mg L 1 .<br />
(N.B. You may have to prepare more concentrated standards if your samples<br />
contain higher levels of these ions.) First analyse a pure water blank, then<br />
analyse the calibration standards. You should filter a small portion of your<br />
rainwater sample using a microfilter and syringe, and inject it into the injection<br />
port. One method of injection is to inject 1 mL of sample into a 200 µL<br />
sample loop set in the “load” position and then switch to the “inject” setting<br />
to sweep the sample into the IC. A typical chromatogram of a rainwater sample<br />
is shown in Figure 2.6. If your samples are too concentrated and the<br />
peaks are off-scale, dilute the samples and analyse once again. Measure the<br />
peak heights and prepare calibration graphs of peak height against concentration<br />
for each ion. Estimate the concentration in your samples by interpolation<br />
from the calibration graph. Also analyse the water blanks to check the<br />
purity of your laboratory water.<br />
Figure 2.6 Typical ion chromatogram of a rainwater sample
<strong>Rainwater</strong> <strong>Analysis</strong> 65<br />
NOTE<br />
1. If using a different chromatography system, follow the instructions in<br />
the methods book supplied by the manufacturer regarding the column<br />
and mobile phase you should use. If you are analysing anions using suppressed<br />
chromatography on a Dionex IC equipped with the AS4A column,<br />
prepare a 2.8 mM NaHCO 3 2.2 mM Na 2 CO 3 solution to use as<br />
the mobile phase.<br />
2.5 MAJOR CATIONS<br />
2.5.1 Alkali Metals and Alkaline Earth Metals (Na, K, Mg, and Ca)<br />
2.5.1.1 Methodology. Stored rainwater samples which were previously<br />
analysed for pH, conductivity, and anions are analysed for alkali and alkaline<br />
earth metals (Na, K, Mg, and Ca) by AAS in an air/acetylene flame.<br />
2.5.1.2 Materials.<br />
● Atomic absorption spectrometer<br />
● Nitric acid (HNO 3 )<br />
● Stock solutions of Na, K, Ca, and Mg, 1000 mg L 1 each. These can be<br />
purchased from suppliers, otherwise you can prepare your own from<br />
soluble salts by dissolving the following quantities of salts in water and<br />
diluting to 1 L: 2.542 g NaCl, 1.907 g KCl, 2.497 g CaCO 3 , and 4.952 g<br />
MgSO 4 . Add about 10 mL concentrated HCL and 1.5 mL concentrated<br />
HNO 3 to the Ca and Mg solutions, respectively before making up to<br />
volume. Dry the salts at 110°C for 2 h before weighing (especially<br />
important for NaCl).<br />
● Lanthanum solution. Dissolve 67 g of Lanthanum chloride (LaCl 3. 7H 2 0)<br />
in 1 M HNO 3 by gently warming. Cool and dilute to 500 mL with laboratory<br />
water.<br />
2.5.1.3 Experimental Procedure. A technician or demonstrator should<br />
turn on the flame atomic absorption spectrophotometer and show you how to<br />
use the instrument. You may also consult the instrument manual for specific<br />
details of the operating parameters. Recommended wavelengths, detection<br />
limits, and working ranges are given in Table 2.8.<br />
Prepare mixed standards containing the following concentrations (in mg<br />
L 1 ) of ions by dilution from 1000 mg L 1 standards: 0.1, 0.2, 0.5, 0.8, 1.0,<br />
1.5, and 2.0 mg L 1 . One mL of dilute HNO 3 should be added to the calibration<br />
standards before diluting to the mark in a 100 mL flask. Analyse the<br />
nitric acid using AAS for each of the metal ions to ensure that it is free from<br />
impurities. Analyse the standards and rainwater samples by aspirating in the
66 <strong>Chapter</strong> 2<br />
Table 2.8 Recommended wavelengths, detection limits, and working ranges of AAS.<br />
(air/acetylene flame)<br />
Element Wavelength (nm) Detection limit (mg L 1 ) Working range (mg L 1 )<br />
Na 589.0 0.002 0.03–2<br />
K 766.5 0.005 0.1–2<br />
Ca 422.7 0.003 0.2–20<br />
Mg 285.2 0.0005 0.02–2<br />
flame of the AAS instrument equipped with the appropriate hollow cathode<br />
lamp and operating at the appropriate wavelength for the metal being<br />
analysed. Record the absorbance readings, or better still, obtain peak heights<br />
on a chart recorder connected to the AAS instrument. Aspirate water between<br />
each sample and standard allowing the baseline to stabilise. Aspirate each<br />
sample or standard sufficiently long to obtain a measurable peak height.<br />
Prepare calibration graphs of peak height (or absorbance) against metal concentration<br />
and evaluate the concentrations of the ions in rainwater by reading<br />
off from the calibration graph.<br />
NOTES<br />
1. In case any of the samples are too concentrated and their peaks register<br />
off-scale, dilute and analyse once more. On the other hand, you may<br />
prepare more concentrated standards.<br />
2. Ca and Mg determination is prone to interference by phosphate and<br />
therefore you should repeat the determination as follows: Measure out<br />
50 mL portions of the working standard solutions prepared above and<br />
to each of these add 5 mL of the lanthanum solution. Also measure out<br />
50 mL of the rainwater sample and add 5 mL of the lanthanum solution<br />
(if less than 50 mL of sample is available, decrease the amount of lanthanum<br />
solution to give the same volume ratio of 10:1). Analyse the Ca<br />
wavelength and plot a calibration graph. If the concentration determined<br />
differs significantly from the one determined above, there was<br />
interference in the first analysis and reject the Ca data from the first run.<br />
Repeat for Mg.<br />
3. If an atomic absorption spectrometer is not available in your laboratory,<br />
but a flame photometer is, you may use the flame photometer to determine<br />
Na, K, Mg, and Ca. Flame photometry is based on atomic emission<br />
and is suitable for these samples. Use the same standards as you<br />
would have used in atomic absorption analysis.<br />
4. You may also use ICP atomic emission spectrometer (ICP-AES) if it is<br />
available in your laboratory. However, the ICP may not be sensitive<br />
enough for K determination in some rainwater samples as the detection
<strong>Rainwater</strong> <strong>Analysis</strong> 67<br />
limit for K is 100 µg L 1 . The instrument should be set up by a technician.<br />
Analyse the standards and samples in the same way as you would<br />
if using AAS.<br />
2.5.2 Ammonium<br />
2.5.2.1 Methodology. Ammonium ion is determined by colorimetry<br />
using the indophenol blue method. This is based on the reaction of phenol<br />
hypochlorite and ammonium to give a blue indophenol dye described by<br />
Weatherburn. 2 The reaction is accelerated by the addition of sodium nitroprusside.<br />
The colour intensity is determined by using a spectrophotometer at<br />
625 nm.<br />
2.5.2.2 Materials.<br />
● Spectrophotometer<br />
● Reagent A. Dissolve 5 g phenol and 25 mg sodium nitroprusside in<br />
water and dilute to 500 mL. Store in dark bottles in a fridge. This can be<br />
used for up to 1 month.<br />
● Reagent B. Dissolve 2.5 g sodium hydroxide and 4.2 mL sodium<br />
hypochlorite (5% chlorine) in water and dilute to 500 mL. Age the solution<br />
for a few days prior to use. Store in dark bottles in fridge. This can<br />
be used for up to 1 month.<br />
● Stock ammonium solution, 1000 mg L<br />
1<br />
. This is commercially available.<br />
You may prepare this solution yourself by dissolving 3.819 g anhydrous<br />
NH 4 Cl in water and making up to the mark in a 1 L flask. Dry salt<br />
in an oven at 110°C for 2 h before weighing.<br />
2.5.2.3 Experimental Procedure. Place 0.5 mL of the rainwater sample<br />
into a test tube and add 5 mL of reagent A followed by 5 mL of reagent B.<br />
Cover the mouth of the tube with parafilm and shake vigorously. Leave test<br />
tube in rack and place in a warm water bath at 37°C for exactly 15 min or at<br />
room temperature for 30 min. Measure the absorbance of the resulting bluegreen<br />
colour in a 1 cm cell at 625 nm on an UV/visible spectrophotometer<br />
with water in the reference cell. Repeat the same with a reagent blank (i.e.<br />
0.5 mL of laboratory water 5mL of reagent A 5 mL of reagent B).<br />
Subtract the absorbance of the reagent blank from the absorbances of the<br />
samples and standards. Prepare a series of NH 4 standard solutions in volumetric<br />
flasks with concentrations in the range of 0.1–10 µg mL 1 by dilution<br />
from a 1000 mg L 1 stock solution. Place 0.5 mL of each of the calibration<br />
standards in a series of test tubes, add 5 mL of reagent A followed by 5 mL<br />
of reagent B and proceed as with the sample. Read off the concentration of<br />
NH 4 in the rainwater sample directly from the calibration graph.
68 <strong>Chapter</strong> 2<br />
NOTE<br />
(1) You may increase the volume of sample taken for analysis if the concentration<br />
of ammonium is too low. Instead of 0.5 mL you may use 1,<br />
2, or 5 mL of sample. In this case, prepare calibration standards over<br />
a lower concentration range and increase the volume of each standard<br />
analysed to correspond to the volume of the sample taken for analysis.<br />
2.5.2.4 Alternative Procedure. You may determine ammonium using an<br />
ammonia ion selective electrode if one is available in your laboratory.<br />
Prepare a series of standard solutions as indicated in Section 2.5.2.3 above.<br />
Immerse the electrode into 100 mL of lowest standard solution in a 150 mL<br />
beaker and add 1 mL 10 M NaOH solution (prepared by dissolving 40 g<br />
NaOH in water and diluting to 100 mL). Stir the solution continuously<br />
throughout the measurement at a low rate using a magnetic stirrer. Record<br />
the potential (mV) when the reading has stabilised. Repeat the measurement<br />
with other standards and the sample. If you have less than 100 mL of sample<br />
then add the corresponding volume of 10 M NaOH (e.g. add 0.5 mL of<br />
10 M NaOH to 50 mL sample). Addition of NaOH raises the pH to above 11,<br />
converting NH 4 into NH 3 so that it can be sensed by the electrode. Plot the<br />
potential (mV), determined in the series of ammonium standards, against the<br />
logarithm of the ion concentration, as shown for the fluoride ion electrode in<br />
Section 4.13, and read off the logarithm of the concentration in the sample.<br />
Convert this to concentration.<br />
2.6 HEAVY METALS<br />
You may determine heavy metals (e.g. Pb, Fe, Mn, Cu, Cd, Co, Cr, and Zn)<br />
using the AAS technique as described for water samples in Section 4.16. You<br />
will have to acidify samples immediately upon collection. Follow exactly the<br />
given procedure.<br />
EXERCISES AND INFORMATION<br />
Questions and Problems<br />
1. Prepare a table summarising all your measurements. Calculate the<br />
arithmetic average and volume weighted mean of the pH and the ionic<br />
concentrations (see Example 2.3).<br />
2. Assuming a concentration of CO 2 in air of 0.033%, calculate the concentrations<br />
of carbonate and bicarbonate in each of your samples at<br />
25°C. Compare these concentrations to those of the other ions and<br />
indicate whether carbonate and bicarbonate would contribute significantly<br />
to the anion concentration in your rainwater samples (use equilibrium<br />
constants given in Example 2.1).
<strong>Rainwater</strong> <strong>Analysis</strong> 69<br />
3. Calculate the mm of rain for each of your samples using the expression:<br />
mm rain <br />
4. Calculate and tabulate the deposition rates of H , and other anions,<br />
cations, and heavy metals that you have determined. The deposition<br />
rate (or flux) is defined as:<br />
Deposition rate <br />
10 Volume of sample (cm 3 )<br />
<br />
Funnel area (cm 2 )<br />
[Ion concentration]Volume of sample<br />
<br />
Funnel areaSampling period<br />
Remember to be consistent in your choice of units. If you express the<br />
sample volume in cm 3 (i.e. mL) and the funnel area in cm 2 , then you<br />
should express the concentration in either mol cm 3 or g cm 3 . If your<br />
sampling period is expressed in h, then your calculated deposition rate<br />
would come out in either mol cm 2 h 1 or in g cm 2 h 1 . The sampling<br />
period, and deposition rate, may also be expressed in days or minutes,<br />
depending on the length of the sampling period. What does the deposition<br />
rate tell you and why is it useful?<br />
5. Is there any relationship between the mm of rain and the concentrations<br />
of the individual ions that you have determined? Draw scatter<br />
plots for each ion.<br />
6. Consider all the data you have gathered. Is there any relationship<br />
between the different ions that you have measured? Calculate correlation<br />
coefficients between pairs of chemical parameters and prepare a<br />
correlation matrix. Discuss the likely causes of these relationships.<br />
7. Discuss the possible sources of various anions, cations, and heavy<br />
metals in rainwater.<br />
8. In rainwater surveys, it is common to express the concentration of ions<br />
in terms of a non-sea salt or excess fraction. This represents that fraction<br />
of the ion originating from sources other than the rainout or<br />
washout of sea salt particles (e.g. anthropogenic pollution or other natural<br />
sources such as volcanoes or continental dust particles). The sea<br />
salt fraction, X SS , of a particular ion is defined as:<br />
X SS (X SEA /R SEA ) R RAIN<br />
where X SEA is the concentration of ion X in bulk seawater, R SEA the<br />
concentration of the reference ion (usually Na ) in bulk seawater, and<br />
R RAIN the concentration of the reference species (i.e. Na ) in rainwater.<br />
The excess or non-sea salt fraction, X NS , is then defined as:<br />
X NS X T X SS
70 <strong>Chapter</strong> 2<br />
where X T is the concentration of ion X measured in the rainwater (i.e.<br />
total concentration sea salt non-sea salt). When calculating sea<br />
salt and non-sea salt contributions, be sure to employ concentrations<br />
expressed in units of eq 1 L and not mol 1 L. Although there is no difference<br />
between the two units for monovalent ions, there is a difference<br />
for divalent ions.<br />
Use your measurements to calculate the sea salt and non-sea salt<br />
fractions of sulfate, chloride, potassium, magnesium, and calcium<br />
using Na as the reference and the following ratios for seawater (estimated<br />
on the basis of concentrations in seawater<br />
X SEA /R SEA<br />
Ratio value<br />
2<br />
SO 4 /Na 0.12<br />
Cl /Na 1.16<br />
K /Na 0.021<br />
Ca 2 /Na 0.044<br />
Mg 2 /Na 0.227<br />
Discuss your results in terms of the likely origin of the various ions.<br />
9. Calculate the conductivity for your samples on the basis of the measured<br />
ionic concentrations. Compare these values to the measured conductivity<br />
values and assess the validity of your analysis. Analyse again<br />
any samples that do not meet the criteria of acceptance.<br />
10. Calculate the electroneutrality balance for your samples and assess the<br />
validity of your analysis. Analyse again any samples that do not meet<br />
the acceptance criteria.<br />
11. Draw a typical IC and describe the function of each component.<br />
12. Draw a typical atomic absorption spectrometer and describe the function<br />
of each component.<br />
13. Outline the principles of atomic absorption spectrometry.<br />
14. Outline the principles of ion chromatography.<br />
Example 2.3<br />
Calculate the volume-weighted mean pH of the following six rainwater<br />
samples:<br />
pH 4.61 5.94 5.16 5.60 4.49 5.06<br />
Rainfall amount (mm) 34.1 13.6 2.7 1.6 32.0 69.8<br />
In rainwater surveys it is common practice to calculate the volume<br />
weighted mean (VWM) of ionic concentrations rather than the arithmetic
<strong>Rainwater</strong> <strong>Analysis</strong> 71<br />
average. The VWM takes into account the effect of dilution by the rainfall<br />
amount and it is useful in comparative studies of acid rain. The VWM<br />
can be calculated from:<br />
VWM of X ([X i ] R i )/R i<br />
where [X i ] is the concentration of substance X, and R i is the rainfall<br />
amount. The sample volume may be used instead of the rainfall amount if<br />
all the samples are collected using funnels of the same diameter.<br />
To calculate the VWM of the pH, the pH values must first be converted<br />
to H concentrations which are then used in the above equation, and the<br />
calculated VWM of H concentrations is then converted back to pH units.<br />
R i 34.1 13.6 2.7 1.6 32.0 69.8153.8 mm<br />
VWM of H <br />
[(10 4.61 34.1) (10 5.94 13.6) (10 5.16 2.7) (10 5.60 1.6)<br />
(10 4.49 32.0) (10 5.06 69.8)]<br />
153.8<br />
2.52 10 3 /153.8 1.64 10 5 mol L 1<br />
The VMW of the pH log 10 1.64 10 5 4.78<br />
The arithmetic average of the pH values is 5.14, which is quite different<br />
from the volume-weighted mean.<br />
Suggestions for Projects<br />
1. Investigate the geographical distribution in rainfall composition by collecting<br />
samples at various sites simultaneously. Illustrate the sampling<br />
sites and results on a map of the area.<br />
2. Compare rainwater composition at an urban site with an adjacent rural<br />
site.<br />
3. Investigate the effect of a forest canopy on the composition of rain. In<br />
this case, place one sampler under the canopy of a tree and the other<br />
sampler in an open field. The rain falling through the canopy is called<br />
throughfall. Analyse both rainwater and throughfall samples and compare<br />
the results. What conclusions can you draw about the interaction<br />
of rainwater with the tree canopy? Investigate throughfall under different<br />
tree species. Is the canopy acting as a source or sink of ions in rainwater<br />
reaching the ground?<br />
4. If wind direction data are available, attempt to correlate the composition<br />
of various components with the wind direction and attempt to identify<br />
sources of the chemical components in rain.
72 <strong>Chapter</strong> 2<br />
5. Samples may be collected on a continuous basis throughout the year. In<br />
this case a computerised database should be set up for students to enter<br />
the results of their measurements. Seasonal effects and trends in rainwater<br />
chemistry may be investigated by inspecting the database.<br />
6. If you live in the tropics, or if you experience heavy rainfall in your<br />
location, study the change in chemical composition of rain during individual<br />
rainstorm events. Keep changing the sampling bottle at regular<br />
intervals during the rain event, or change the bottle as soon as you have<br />
sufficient sample for analysis. After analysing the samples, plot the<br />
concentrations against time from the commencement of the rain event<br />
to obtain a profile.<br />
7. Determine the composition of snow using the same analytical techniques.<br />
Collect fresh snow and analyse in the laboratory after allowing<br />
it to thaw.<br />
REFERENCES<br />
1. W.F. Koch and G. Marinenko, Atmospheric deposition reference materials:<br />
Measurement of pH and acidity, Paper Presented at the 76th Annual<br />
Meeting of the Air Pollution Control Association, Atlanta, Georgia,<br />
1983, June 19–24.<br />
2. M.W. Weatherburn, Phenol-hypochlorite reaction for determination of<br />
ammonia, Anal. Chem., 1967, 39, 971–974.<br />
FURTHER READING<br />
M. Radojević and R.M. Harrison (eds), Atmospheric Acidity: Sources,<br />
Consequences and Abatement, Elsevier, Amsterdam, 1992.<br />
G. Howells, Acid Rain and Acid Waters, Ellis Horwood, New York, 1990.<br />
F.B. Smith, An overview of the acid rain problem, Meteorol. Mag.,<br />
120(1426), 77– 91, 1991.<br />
J.R. Kramer, <strong>Analysis</strong> of precipitation, in Handbook of Air Pollution<br />
<strong>Analysis</strong>, <strong>2nd</strong> edn, R.M. Harrison and R. Perry (eds) Chapman and Hall,<br />
1986, 535–561.<br />
M. Radojević, Taking a rain check, Anal. Europa, 1995, (August), 35–38.<br />
V. Mohnen, The challenge of acid rain, Sci. Am., 1988, 259(August), 14–22.<br />
V. <strong>Bashkin</strong> and M. Radojević, A rain check on Asia, Chem. Br., 2001(June),<br />
37(6), 40–42.<br />
V. <strong>Bashkin</strong> and M. Radojević, Acid rain and its mitigation in Asia. Int. J<br />
Environ. Stud., 2003, 60(3), 205–214
Quan trắc môi trường Nhóm 6<br />
ĐẠI HỌC QUỐC GIA THÀNH PHỐ HỒ CHÍ MINH<br />
TRƯỜNG ĐẠI HỌC KHOA HỌC TỰ NHIÊN<br />
KHOA MÔI TRƯỜNG<br />
10CMT<br />
QUAN TRẮC MÔI TRƯỜNG<br />
Đề tài:<br />
<strong>Chapter</strong> 2:<br />
RAINWATER ANALYSIS<br />
(PHÂN TÍCH NƯỚC MƯA)<br />
GVHD: TS. Tô Thị Hiền<br />
Danh sách nhóm:<br />
Chu Thế Dũng 1022053<br />
Lương Thái Hòa 1022112<br />
Kim Châu Long 1022161<br />
Võ Nguyễn Ngọc Quỳnh 1022243<br />
Trần Hoài Thanh 1022261<br />
1
Quan trắc môi trường Nhóm 6<br />
2
Quan trắc môi trường Nhóm 6<br />
MỤC LỤC<br />
CHƯƠNG 2<br />
PHÂN TÍCH NƯỚC MƯA<br />
2.1. Mưa acid. ......................................................................................... 1<br />
2.1.1 Nguyên nhân gây <strong>mưa</strong> acid ....................................................... 6<br />
2.1.2 Tác động của <strong>mưa</strong> acid .............................................................. 9<br />
2.1.3 Kiểm soát <strong>mưa</strong> acid .................................................................. 10<br />
2.2. Lấy mẫu và phân <strong>tích</strong>. .................................................................. 13<br />
2.3. <strong>Phân</strong> <strong>tích</strong> số liệu và giải thích....................................................... 14<br />
2.3.1 Các câu hỏi và những vấn đề. ................................................. 20<br />
2.4. pH, độ dẫn và các anion chính. .................................................... 22<br />
2.4.1 Phương pháp. ............................................................................ 22<br />
2.4.2 Chuẩn bị dụng cụ. ................................................................... 22<br />
2.4.2.1 Dụng cụ đựng mẫu. ............................................................ 22<br />
2.4.2.2 Tiến hành thí nghiệm ......................................................... 22<br />
2.4.3 Lấy mẫu..................................................................................... 23<br />
2.4.3.1 Dụng cụ lấy mẫu: ................................................................ 23<br />
2.4.3.2 Tiến hành thí nghiệm: ........................................................ 23<br />
2.4.4. Độ dẫn điện. ............................................................................. 24<br />
2.4.4.1. Hóa chất và dụng cụ. ......................................................... 24<br />
3
Quan trắc môi trường Nhóm 6<br />
2.4.4.2. Quy trình thí nghiệm. ........................................................ 24<br />
2.4.5. pH. ............................................................................................ 28<br />
2.4.5.1. Hóa chất và dụng cụ. ......................................................... 28<br />
2.4.5.2. Quy trình thí nghiệm. ....................................................... 28<br />
2.4.6 Các Anion chính (Chloride, Nitrate, Sulfate). ....................... 27<br />
2.4.6.1. Hóa chất và dụng cụ. ......................................................... 27<br />
2.4.6.2. Quy trình thí nghiệm. ........................................................ 27<br />
2.5. Cations chính. ................................................................................ 27<br />
2.5.1 Kim loại kiềm và kim loại kiềm thổ (Na, K, Mg, Ca). .......... 28<br />
2.5.2 Ammonium. ............................................................................. 29<br />
2.5.2.1 Phương pháp luận. ............................................................. 30<br />
2.5.2.2 Hóa chất và dụng cụ. .......................................................... 30<br />
2.5.2.3 Quy triǹh thực hiêṇ. .......................................................... 31<br />
4
Quan trắc môi trường Nhóm 6<br />
CHƯƠNG 2<br />
PHÂN TÍCH NƯỚC MƯA<br />
2.1. Mưa acid<br />
Nước <strong>mưa</strong>, là một thành phần quan trọng của chu trình thủy văn, nó đóng một<br />
vai trò quan trọng trong việc hòa tan các hợp chất trong <strong>nước</strong>. Nước <strong>mưa</strong> đóng vai<br />
trò như là một nguồn của nhiều dưỡng chất thiết yếu trong hệ sinh thái trên cạn và<br />
thủy sinh. Nó cũng hoạt động như một chất tẩy rửa của khí quyển, các chất ô<br />
nhiễm từ không khí sẽ được đưa vào các vùng <strong>nước</strong> mặt và đất, nơi chúng có thể<br />
có ảnh hưởng không tốt đối với hệ sinh thái tự nhiên.<br />
Một trong những mối quan tâm lớn về môi trường ngày nay là hiện tượng <strong>mưa</strong><br />
acid. Khi không bị ô nhiễm, <strong>mưa</strong> tinh khiết có tính acid nhẹ do sự hấp thu CO2<br />
trong khí quyển. Độ pH của <strong>nước</strong> trong trạng thái cân bằng với CO2 trong khí<br />
quyển là khoảng 5.6 (xem ví dụ 2.1) và do đó chỉ có các cơn <strong>mưa</strong> có độ pH thấp<br />
hơn giá trị này mới được gọi là "<strong>mưa</strong> acid". Nước <strong>mưa</strong> có pH dao động giữa 3 và<br />
9, đối với các mẫu thông thường giá trị của pH là khoảng từ 4 đến 6 (hình 2.1). Giá<br />
trị pH cao có thể phát sinh từ sự có mặt của vật liệu bụi kiềm trong <strong>nước</strong> <strong>mưa</strong>, như<br />
ví dụ tại New Delhi, trận <strong>mưa</strong> có giá trị pH cao nhất là 9. Giá trị pH dưới 3 đã được<br />
ghi nhận trong những mẫu sương mù acid.<br />
pH được định nghĩa là logarit cơ số 10 của ion hydro:<br />
pH = - log10 αH +<br />
Đối với dung dịch <strong>nước</strong> pha loãng mẫu, chẳng hạn như <strong>nước</strong> <strong>mưa</strong>, hoạt độ<br />
bằng nồng độ của H + . pH là một thước đo lượng acid tự do.Nồng độ acid mạnh<br />
dưới hình thức điện ly, và không phải tổng lượng acid.<br />
Nồng độ acid của <strong>nước</strong> <strong>mưa</strong> được đo lần đầu tiên vào khoảng hơn 100 năm<br />
trước đây trong cuộc cách mạng công nghiệp. Theo các tài liệu báo cáo lần đầu tiên<br />
về <strong>mưa</strong> acid đã được thực hiện bởi một nhà khoa học Pháp, Ducros, năm 1845 cho<br />
xuất bản một bài báo mang tên “Observation d’une pluie acide”. Robert Angus<br />
5
Quan trắc môi trường Nhóm 6<br />
Smith, là người đầu tiên trên thế giới tìm hiểu về tình trạng ô nhiễm không khí , đã<br />
báo cáo <strong>mưa</strong> acid trong thành phố Manchester trong cuốn sách "Air và Rain" của<br />
ông được xuất bản vào năm 1872. Tuy nhiên, chỉ trong 30 năm thì mối quan tâm<br />
về <strong>mưa</strong> acid đã được thể hiện rộng rãi. Trong những năm 1960, các nhà khoa học<br />
Bắc Âu đã bắt đầu tìm hiểu về sự biến mất bí ẩn của cá từ các hồ và suối cho đến<br />
gió thổi từ Vương quốc Anh và Trung Âu. Điều này dẫn đến một sự quan tâm mới<br />
trong các hiện tượng <strong>mưa</strong> acid. Ngày nay, thuật ngữ "<strong>mưa</strong> acid" bao gồm không<br />
chỉ có <strong>nước</strong> <strong>mưa</strong> mà là sự lắng đọng của tất cả các chất ô nhiễm có tính acid, cho<br />
dù là <strong>mưa</strong>, sương mù, mây, sương, tuyết, các hạt bụi hoặc khí.<br />
Mặc dù lần đầu tiên được công nhận là một vấn đề khu vực ở châu Âu và Bắc<br />
Mỹ, nơi có nhiều ảnh hưởng đã được nghiên cứu rộng rãi và ghi nhận, <strong>mưa</strong> acid<br />
bây giờ được quan tâm trên toàn thế giới, ngay cả ở các nơi cách xa với các nguồn<br />
ô nhiễm công nghiệp, chẳng hạn như các băng vùng cực và những khu rừng <strong>mưa</strong><br />
nhiệt đới. Chỉ trong vòng một thế hệ, <strong>mưa</strong> acid đã trở thành một mối phiền toái tại<br />
các địa phương và khu vực đó là một vấn đề lớn đối với môi trường toàn cầu.<br />
Hình 2.1 Thang đo pH cho thấy khoảng pH điển hình của <strong>nước</strong> <strong>mưa</strong> và các<br />
mẫu môi trường khác.<br />
6
Quan trắc môi trường Nhóm 6<br />
Ví dụ 2.1<br />
Tính pH của <strong>nước</strong> <strong>mưa</strong> trong trạng thái cân bằng với CO2 trong khí quyển (CO2<br />
=0,036%) ở 25 o C, cho KH = 0,031 mol L -1 atm; K1 = 4.3x10 -7 mol L -1 ; K2 = 5 x<br />
l0 11 mol L -1 .<br />
Những cân bằng có liên quan cần phải xem xét để phân ly khí CO2 trong <strong>nước</strong> và<br />
khí CO2 hòa tan trong dung dịch <strong>nước</strong><br />
CO2 + H2O CO2*H2O<br />
KH = [CO2*H2O]/p SO2<br />
CO2*H2O HCO3 - + H + K1 = [HCO3 - ] [H + ]/[CO2*H2O]<br />
HCO - 3 CO 2- 3 + H + K2 = [CO 2- 3][H + ]/[HCO3 - ]<br />
Ta có thể thiết lập cân bằng electron sau đây:<br />
[ H + ] = [OH - ] + [HCO - 3] + 2[CO 2- 3]<br />
Ta có thể giả sử rằng các phương pháp này sẽ có tính acid do sự phân ly trên<br />
các phản ứng:<br />
[OH - ]
Quan trắc môi trường Nhóm 6<br />
Và [ H + ] = ( K H x K1 x ~ pCO2 ) 1/2<br />
Thay các giá trị của KH, K1 và pCO2 thể hiện trong bầu khí quyển (từ 0,036%là<br />
áp lực một phần của CO2, và áp suất là 1 atm, 0,036% = 0.036/100 atm = 3,6 x<br />
10 -4 atm).<br />
[H + ] = (0.031 x 4.3 x 10 -7 x 3.6 x 10 -4 ) 1/2 = 2.19 x l0 -6 mol L -<br />
pH = - logl0[H + ] = -logl02.19 x l0 -6 = 5.66<br />
2.1.1 Nguyên nhân gây <strong>mưa</strong> acid<br />
Một minh họa đơn giản của các hiện tượng <strong>mưa</strong> acid được đưa ra trong h́ình<br />
2.2. Mưa acid có nguồn gốc từ sự chuyển hóa các chất khí gây ô nhiễm phát ra từ<br />
các ống khói của than và dầu của các nhà máy phát điện, lò nung, nhà máy lọc dầu<br />
nhà máy hóa chất, và xe có động cơ. Trong quá khứ, SO2 là nguyên nhân gây ra<br />
<strong>mưa</strong> acid, tuy nhiên, sự hiện diện của NOx đã làm cho <strong>mưa</strong> acid tăng lên. Ngày<br />
nay, sự hiện diện của hai chất gây ô nhiễm có nồng độ acid trong <strong>nước</strong> <strong>mưa</strong> gần<br />
bằng nhau, do việc tăng số lượng xe ô tô trên đường phố và giảm khí thải SO2.<br />
Khí SO2 được oxy hoá trong bầu khí quyển thành H2SO4, giúp nó dễ dàng hấp<br />
thụ bởi <strong>nước</strong> <strong>mưa</strong>. Quá trình oxy hóa tiến hành thông qua một loạt các cơ chế.<br />
Trong pha khí, SO2 được oxy hóa chủ yếu bởi các gốc hydroxyl (OH).<br />
Sulfurdioxide cũng có thể hòa tan trong các hạt mây theo cân bằng sau đây để tạo<br />
SO2 hòa tan, bisulfite (HSO - 3) và sulfite (SO 2- 3) ion:<br />
SO2 + H2O SO2*H2O KH = [SO2*H2O]/p SO2<br />
SO2*H2O HSO3 - + H + K1 = [HSO3 - ][H + ]/[SO2*H2O]<br />
HSO3 - SO3 2- + H + K2 = [SO 2- 3][H + ]/[HSO3 - ]<br />
8
Quan trắc môi trường Nhóm 6<br />
KH là hằng số Henry của SO2 và K1, K2 là hằng số phân ly. Tiêu biểu tại các giá trị<br />
pH của <strong>nước</strong> <strong>mưa</strong> (3-6), SO2 hòa tan hiện nay chủ yếu là ion bisulfite (Hình<br />
2.3).Tổng số loại hoà tan được xem ở S (IV):<br />
[S(IV)] = [ SO2 *H2O ] + [HSO3 - ] + [SO3 2- ]<br />
Tại các đám mây, S (IV) có thể được oxy hóa thành sulfat (SO 2- 4) hòa tan<br />
hydrogen peroxide (H2O2) và ozone (O3). Trong không khí ô nhiễm, các kim loại<br />
như sắt và mangan có thể xúc tác cho quá trình oxy hóa SO2 trong đám mây. Phản<br />
ứng này có pH phụ thuộc vào tốc độ gia tăng quá trình oxy hóa với pH<br />
ngày càng cao. Các oxit nitơ, tạo ra trong quá trình đốt cháy, được chuyển hóa<br />
thành acid nitric trong khí quyển, chủ yếu là bởi các phản ứng ở pha khí. Acid<br />
hydrochloric , hiện diện trong nhà máy điện ở nồng độ thấp, nên chỉ đóng góp một<br />
phần nhỏ đến <strong>mưa</strong> acid.<br />
Hình 2.2 Nguyên nhân gây <strong>mưa</strong> acid.<br />
9
Quan trắc môi trường Nhóm 6<br />
Hình 2.3 Tỉ lệ S (IV) như một hàm số của pH.<br />
Các quá trình tự nhiên cũng có thể làm tăng nồng độ acid của <strong>nước</strong> <strong>mưa</strong>.<br />
Nhiều khí được tạo ra trong quá trình phun trào của núi lửa và cháy rừng. Ngoài<br />
ra, quá trình làm giảm các hợp chất lưu huỳnh như hydrogen sulfide và<br />
dimethylsulfide được giải phóng bởi sinh vật phù du và phân hủy sinh học trong<br />
các đầm lầy và đất ven biển và nội địa. Các hợp chất này bị SO2 oxi hóa trong khí<br />
quyển. Ngoài ra, các acid hữu cơ như acid formic, axetic, có nguồn gốc từ các<br />
nguồn tự nhiên, có thể góp phần quan trọng làm tăng tính acid của <strong>nước</strong> <strong>mưa</strong>, đặc<br />
biệt là ở nông thôn. Hiện nay, khoảng một nửa lượng khí thải toàn cầu như lưu<br />
huỳnh và NOx có nguồn gốc do con người. Khoảng 68% phát thải do con người<br />
như SO2 và NOx, có nguồn gốc ở châu Âu và Bắc Mỹ, mà sự phát thải của các<br />
<strong>nước</strong> đang phát triển, đặc biệt là ở châu Á đang tăng lên. Luồng chất gây ô nhiễm<br />
có thể di chuyển hàng trăm hoặc thậm chí hàng ngàn km từ một nguồn nào đó<br />
trước khi được chuyển thành <strong>mưa</strong> acid. Điều này được gọi là quá trình phát tán của<br />
của các chất ô nhiễm trong không khí (LRTAP) nó đã trở thành một vấn đề chính<br />
trị quan trọng vì sự chuyển động xuyên biên giới của các chất ô nhiễm qua các<br />
quốc gia.<br />
Hợp chất sunfuar được tách ra khỏi bầu khí quyển bằng quá trình lắng đọng.<br />
Khí hòa tan trong các hạt mây, trong khi các hạt bụi được <strong>tích</strong> hợp thành những<br />
giọt mây, hoặc là hạt nhân ngưng tụ mây (CCN), xung quanh có các giọt <strong>nước</strong> lớn,<br />
hoặc bằng cơ chế quét khí thẳng. Các quá trình này được gọi là <strong>mưa</strong>. Sự kết hợp<br />
của các hạt bụi và các phân tử khí thành giọt <strong>nước</strong> <strong>mưa</strong> rơi xuống được gọi là rửa<br />
10
Quan trắc môi trường Nhóm 6<br />
trôi. Cả <strong>mưa</strong> và rửa trôi được gọi là lắng đọng ướt. Lắng đọng khô liên quan đến<br />
việc bồi lắng các hạt bụi và sự khuếch tán của các phân tử khí lên các bề mặt. Quá<br />
trình lắng đọng khô nói chung còn quan trọng hơn nguồn gốc của các chất gây ô<br />
nhiễm<br />
2.1.2 Tác động của <strong>mưa</strong> acid<br />
Từ khi các nghiên cứu đầu tiên về <strong>mưa</strong> acid và cá chết đã được thực hiện 30<br />
năm trước đây, một số tác động có hại của <strong>mưa</strong> acid đã được phát hiện. Một số<br />
những ảnh hưởng này, được đưa ra trong Bảng 2.1, đã được chứng minh, trong khi<br />
số khác vẫn còn tranh cãi do sự thiếu hiểu biết về một số cơ chế gây thiệt hại của<br />
<strong>mưa</strong> acid.<br />
Mưa acid có thể làm hồ và sông có tính axit, dẫn đến nhôm bị hòa tan cộng<br />
với pH trong <strong>nước</strong> thấp đã làm cho cá bị chết hàng loạt. Các tác động độc hại phụ<br />
thuộc vào các loài cá, nồng độ canxi trong <strong>nước</strong> và pH. Mưa acid cũng có thể làm<br />
tăng tốc độ ăn mòn đá vôi và sắt, do đó nó làm hư hại các di <strong>tích</strong> lịch sử quan trọng<br />
và các công trình xây dựng khác; nó có thể ảnh hưởng không tốt đến sự phát triển<br />
của thực vật, dẫn đến suy giảm rừng và thiệt hại đến cây trồng; và thậm chí nó có<br />
thể làm tăng hàm lương kim loại độc hại trong nguồn <strong>nước</strong>.<br />
Bảng 2.1 Các tác động có hại của <strong>mưa</strong> acid:<br />
Tác động Cơ chế Bằng chứng<br />
Cá chết Độc tính chủ yếu là do việc<br />
giải phóng của A1 từ trầm<br />
<strong>tích</strong>. A1 gây ra tắc nghẽn<br />
mang với dịch nhầy.<br />
Cá hồi và cá hồi nâu đã biến mất<br />
trong hàng ngàn các hồ và các con<br />
song ở Bắc Âu, Canada, Hoa Kỳ và<br />
lochs ở Scotland<br />
Suy giảm<br />
rừng<br />
Để hiểu rõ, các giả<br />
thuyết khác nhau đã được đưa<br />
ra, một trong số đó là <strong>mưa</strong><br />
acid đã giải phóng A1 độc<br />
hại từ đất gây tổn thương rễ<br />
và cản trở sự hấp thu các chất<br />
dinh dưỡng. Các áp lực<br />
khác góp phần bao gồm hạn<br />
Lần đầu tiên được quan sát ở<br />
Đức vào giữa những năm 1970. Gần<br />
25% tất cả các cây ở châu Âu đã bị<br />
thiệt hại. Thông thường, cây mất<br />
đi lá kim và ngọn cảu cây xân sam<br />
Na Uy trở nên thưa hơn và lá<br />
chuyển sang màu nâu<br />
11
Quan trắc môi trường Nhóm 6<br />
Thiệt hại<br />
xây dựng<br />
Thiệt hại y<br />
tế<br />
hán, lạnh, bệnh tật vàô nhiễm<br />
khác như: O3)<br />
SO2 phản ứng với đá vôi<br />
(CaCO3) để tạo thành thạc<br />
cao (CaSO4.H20) trong đó<br />
quá trình hòa tan và có thể dễ<br />
dàng được rửa sạch bởi <strong>nước</strong><br />
<strong>mưa</strong><br />
Tăng tốc độ di chuyển của<br />
kim loại nặng trong chuỗi<br />
thức ăn và <strong>tích</strong> lũy các kim<br />
loại nặng trong <strong>nước</strong> uống và<br />
thực phẩm<br />
Ô nhiễm không khí có thể gây tác<br />
hại đến các di <strong>tích</strong> lịch sử, nó đã<br />
được ghi nhận ở châu Âu, Bắc Mỹ<br />
và châu Á. Trường hợp đáng chú ý<br />
là thành phố Cracow ở Ba Lan,<br />
Acropolis tại Athens và đền Taj<br />
Mahal ở Ấn Độ<br />
Gần đây, khái niệm về tải trọng đã được phát triển để định lượng và đánh giá<br />
khả năng gây thiệt hại cho các vùng nhạy cảm. Tải trọng là ngưỡng nồng độ của<br />
chất ô nhiễm mà nó bắt đầu gây tác hại được quan sát thấy và nó thường được xác<br />
định bằng cách sử dụng các mô hình phức tạp. Đất đệm yếu, chẳng hạn như được<br />
tìm thấy ở Bắc Âu, biểu hiện tải trọng đặc biệt thấp cho tính acid. Bản đồ các tải<br />
trọng quan trọng của các khu vực khác nhau trên thế giới đang được chuẩn bị để dự<br />
đoán tác động và hỗ trợ trong việc kiểm soát ô nhiễm acid.<br />
2.1.3 Kiểm soát <strong>mưa</strong> acid<br />
Như một hệ quả các nhà khoa học và công chúng đã quan tâm nhiều hơn đến<br />
các tác hại của <strong>mưa</strong> acid, chính phủ và các tổ chức quốc tế đã thiết lập rất nhiều<br />
nghiên cứu về <strong>mưa</strong> acid, và các giải pháp về pháp lý và công nghệ đã được thực<br />
hiện để làm giảm vấn đề. Ủy ban Kinh tế của Liên Hợp Quốc ở châu Âu (UNECE)<br />
Công ước về ô nhiễm không khí xuyên biên giới tầm xa, đã có hiệu lực vào năm<br />
1983, nhằm mục đích kiểm soát <strong>mưa</strong> axit thông qua việc giảm lượng khí thải lưu<br />
huỳnh. Nghị định thư UNECE đã ký tại Helsinki vào năm 1985 bên ký kết cần<br />
phải giảm lượng khí thải chứa lưu huỳnh hàng năm là 30% bắt đầu từ năm 1980 và<br />
có hiệu lực đến năm 1993. Một phương thức khác thậm chí còn nghiêm ngặt hơn<br />
đã được thông qua vào năm 1994, là yêu cầu cắt giảm từ 13% và 70% năm được<br />
12
Quan trắc môi trường Nhóm 6<br />
thực hiện trong giai đoạn năm1980 đến năm 2000, 2005 và 2010. Liên minh châu<br />
Âu EU đã ban hành một chỉ thị vào năm 1988 đòi hỏi phải giảm lượng phát thải<br />
khí SO2 từ 40% đến 60% năm 1998 và 50% đến 70% năm 2003, với tham chiếu<br />
đến năm 1980 lượng khí thải. Ngoài ra, nó còn bắt buộc phải giảm lượng phát thải<br />
NOx 40% vào năm 1998. Pháp chế tương tự cũng đã được thông qua ở Mỹ.<br />
Lượng khí phát thải ra ban đầu được giảm bằng cách áp dụng các biện pháp<br />
trước đây, hoặc sau khi đốt cháy nhiên liệu. Những biện pháp này bao gồm:<br />
• Chuyển đổi nhiên liệu (tức là thay đổi từ các loại than chứa lưu huỳnh cao<br />
sang sử dụng khí tự nhiên chứa lưu huỳnh thấp).<br />
• Nhiên liệu khử lưu huỳnh (ví dụ như rửa than để loại bỏ lưu huỳnh, khí hóa<br />
than).<br />
• Công nghệ đốt mới (ví dụ như đốt một lò tầng sôi (FBC), NOx thấp, ổ ghi).<br />
• Khí thải khử lưu huỳnh (ví dụ như cho khí thải tiếp xúc với vôi, đá bùn,<br />
<strong>nước</strong> biển hoặc một số giải pháp khác hấp thụ SO2).<br />
• Khử NOx thành N2 (ví dụ tiêm NH3 vào khí thải trên một chất xúc tác).<br />
• 3 cách chuyển đổi xúc tác để giảm NOx, khí thải từ động cơ xe.<br />
Giới thiệu về các giải pháp kiểm soát đã dẫn đến giảm lượng khí thải ở nhiều<br />
<strong>nước</strong> phát triển, tuy nhiên, lượng khí thải ở các <strong>nước</strong> đang phát triển đang có xu<br />
hướng tăng lên. Việc điều khiển phát thải khí như là bón vôi vào hồ và bị đất ảnh<br />
hưởng để trung hòa tính axit. Điều này không có, tuy nhiên, một giải pháp lâu dài<br />
cho vấn đề này là việc bón vôi phải được lặp đi lặp lại đúng thời gian như vậy thì<br />
<strong>nước</strong> trở nên có tính acid.<br />
2.2. Lấy mẫu và phân <strong>tích</strong>.<br />
Những mối quan tâm ngày càng cao về <strong>mưa</strong> acid đã dẫn đến việc thành lập<br />
nhiều chương trình giám sát quốc gia và quốc tế về phân <strong>tích</strong> <strong>nước</strong> <strong>mưa</strong> một cách<br />
thường xuyên. Một trong những mạng lưới trên toàn thế giới được điều hành như<br />
là một phần của chiến lược theo dõi khí quyển toàn cầu (GAW) và của Tổ chức Y<br />
tế Thế giới (WHO). Các thông số hóa học chính được xác định trong các cuộc điều<br />
tra này là: pH, độ dẫn, sulfate, nitrate, chloride, ammonium, sodium, potassium,<br />
calcium và nồng độ magnesium. Càng ngày, các acid hữu cơ (formic và axetic) và<br />
các kim loại vết cũng đang được xác định. Các kỹ thuật phân <strong>tích</strong> <strong>mưa</strong> acid được<br />
tóm tắt trong Bảng 2.2. Nồng độ cho phép của các ion khác nhau trong <strong>nước</strong> <strong>mưa</strong><br />
được đưa ra trong Bảng 2.3.<br />
13
Quan trắc môi trường Nhóm 6<br />
Bảng 2.2 Các kỹ thuật để phân <strong>tích</strong> <strong>nước</strong> <strong>mưa</strong>:<br />
Kỹ thuật phân <strong>tích</strong><br />
Chất phân <strong>tích</strong><br />
Sắc ký Ion (IC) Cl - , NO3 - , SO 2- 4, NH + 4, Na + , K + , Mg 2 + ,<br />
Ca 2+ , formate, acetate.<br />
Quang phổ hấp thụ nguyên tử ngọn Na + , K + , Mg 2+ , Ca 2+ .<br />
lửa (FAAS)<br />
Quang phổ phát xạ nguyên tử ngọn Na + , K + , Mg 2+ , Ca 2+ .<br />
lửa(FAES)<br />
Lò hấp thụ nguyên tử Graphite Kim loại vết.<br />
Quang phổ (GFAAS)<br />
Một số kim loại vết.<br />
Bảng 2.3 Nồng độ ion trong <strong>nước</strong> <strong>mưa</strong>:<br />
Ion Nồng độ (mg L -1 )<br />
Chlorid 0,02 - 60<br />
Nitrat 0,1 - 20<br />
Sulfat 0,1 - 30<br />
Sodium (Na) 0,02 - 30<br />
Potassium (K) 0,02 - 2<br />
Magnesium (Mg) 0,005 - 2<br />
Calcium (Ca) 0,02 - 4<br />
Ammonium (Al) 0,03 - 4<br />
Mặc dù việc phân <strong>tích</strong> <strong>nước</strong> <strong>mưa</strong> có vẻ như đơn giản, nhưng trong thực tế việc<br />
phân <strong>tích</strong> <strong>nước</strong> <strong>mưa</strong> có khá nhiều vấn đề. Các lỗi thường gặp với các loại mẫu môi<br />
trường hiện tại và chúng cũng trở nên trầm trọng hơn vì nồng độ thấp của các ion<br />
có trong <strong>nước</strong> <strong>mưa</strong>. Nhiều mẫu <strong>nước</strong> <strong>mưa</strong>, đặc biệt là những mẫu có vị trí ở xa, gần<br />
như là tinh khiết như <strong>nước</strong> cấp phòng thí nghiệm. Vì vậy, phải cẩn thận khi xử lý,<br />
bảo quản và phân <strong>tích</strong> các mẫu <strong>nước</strong> <strong>mưa</strong> để duy trì mẫu không để mẫu bị biến<br />
tính.<br />
Các lỗi thường gặp trong phân <strong>tích</strong> <strong>nước</strong> <strong>mưa</strong> bao gồm:<br />
• Ô nhiễm bởi các vật liệu sinh học (ví dụ như côn trùng) trong quá trình lấy<br />
mẫu.<br />
14
Quan trắc môi trường Nhóm 6<br />
• Bốc hơi từ mẫu.<br />
• Sự hấp thu/ giải hấp của các chất khí trong quá trình lấy mẫu hoặc trong<br />
phòng thí nghiệm.<br />
• Các phản ứng hóa học hoặc phản ứng sinh học xảy ra trong quá trình lấy mẫu<br />
hoặc lưu trữ mẫu.<br />
• Tương tác với vật liệu chứa mẫu<br />
• Do sơ suất nhiễm bẩn trong quá trình xử lý, phân <strong>tích</strong> mẫu.<br />
Ammonia và acid hữu cơ đặc biệt dễ bị phản ứng trong quá trình lưu trữ và<br />
việc sử dụng phụ gia như chloroform hoặc thymol được khuyến khích sử dụng để<br />
bảo quản các mẫu phân <strong>tích</strong> này.<br />
Mẫu <strong>nước</strong> <strong>mưa</strong> có thể có hai loại: mẫu ướt hoặc mẫu số lượng lớn. Mẫu ướt<br />
được thu thập bằng bộ lấy mẫu chuyên biệt, do đó có thể loại bỏ sự nhiễm bẩn bởi<br />
các hạt bụi rơi xuống trong suốt thời gian khô. Mẫu được lấy như vậy được gọi là<br />
lắng đọng ướt hoặc mẫu <strong>nước</strong> <strong>mưa</strong>. Ban đầu, <strong>nước</strong> <strong>mưa</strong> được thu vào thùng hoặc<br />
phễu đưa vào trong chai, vì vậy được gọi là thu gom số lượng lớn, và cách lấy mẫu<br />
này vẫn còn áp dụng đến nay, đặc biệt là tại các địa điểm ở xa hoặc khó tiếp cận.<br />
Những mẫu thu gom không chỉ có <strong>nước</strong> <strong>mưa</strong> (lắng đọng ướt) mà còn có các hạt bụi<br />
và khí trong suốt thời gian của trận <strong>mưa</strong> (lắng đọng khô) và được cho là để thu<br />
lắng đọng số lượng lớn. Những cách lấy mẫu này có ưu điểm là không sử dung<br />
năng lượng điện và nó có thể được đặt tại các địa điểm từ xa khó tiếp cận. Tuy<br />
nhiên, trong nhiều trường hợp, chúng ta muốn lấy mẫu cả hai lắng đọng ướt và khô<br />
để có được một ước lượng về tổng sự lắng đọng của một chất. Trong trường hợp<br />
này, lượng lớn lấy mẫu còn sót lại tại trong thực tế trong thời gian từ một ngày đến<br />
một tháng. Trong nhiều cuộc khảo sát, người ta thường để mẫu phơi nhiễm một<br />
tuần tại một thời điểm. Tuy nhiên, việc sử dụng lượng lớn mẫu để đánh giá sự lắng<br />
đọng tổng số đã bị chỉ trích, và được lắng đọng khô đang được đánh giá trên cơ sở<br />
nồng độ trong không khí.<br />
Độ pH của <strong>nước</strong> <strong>mưa</strong> là một trong những phép đo khó thực hiện chính xác<br />
nhất, và sự nghi ngờ này đã được thể hiện qua nhiều bài báo cáo trong nhiều tài<br />
liệu. Điều này được minh họa trong bảng 2.4, tóm tắt phép đo độ pH trong dung<br />
15
Quan trắc môi trường Nhóm 6<br />
dịch acid loãng thực hiện bởi Văn phòng Tiêu chuẩn Quốc gia ở Mỹ. Thậm chí<br />
trong các thí nghiệm được thực hiện bởi các kỹ thuật viên được đào tạo trong điều<br />
kiện tốt nhất. Những vấn đề thường gặp khi phân <strong>tích</strong> pH là:<br />
• Sự khác biệt trong cường độ ion giữa các mẫu và bộ đệm được sử dụng để tiêu<br />
chuẩn hóa các điện cực pH.<br />
• Khuấy lỗi.<br />
• Hấp thụ khí trong phòng thí nghiệm (ví dụ: NH3, CO2).<br />
• Những phản ứng hóa học (ví dụ như giải thể của các hạt bụi kiềm trong đình chỉ).<br />
• Những phản ứng sinh học (ví dụ: như sự suy thoái của các acid yếu như<br />
axitformic, axetic).<br />
Bảng 2.4 Phản ứng mới này, các nghiên cứu kết hợp lớp điện cực pH trong 10 -4<br />
mol L -1 HCL (từ một nghiên cứu của Cục Tiêu chuẩn Quốc gia, Washington):<br />
Ghi giá trị pH<br />
Điện cực Yên tĩnh Khuấy động Sự khác biệt<br />
1 3.944 3.816 0.128<br />
2 3.864 3.661 0.203<br />
3 3.908 3.741 0.167<br />
4 3.899 3.841 0.058<br />
5 3.875 3.755 0.120<br />
Phạm vi 0.080 0.180 0.145<br />
2.3 Sự phân <strong>tích</strong> và giải thích dữ liệu:<br />
Về lý thuyết, nếu tất cả các thành phần của dung dịch được phân <strong>tích</strong> chính<br />
xác thì tổng các cation và tổng anion tương đương nhau. Điều này được gọi là cân<br />
bằng trung hòa điện, và nó được sử dụng để kiểm tra giá trị của 1 chất phân <strong>tích</strong>.<br />
∑cations = ∑anions<br />
16
Quan trắc môi trường Nhóm 6<br />
Nếu tỷ lệ của tổng cation/ tổng anion nhỏ hơn 0.85 hoặc lớn hơn 1.15, dữ liệu<br />
cần được xem xét lại, trong trường hợp này kết quả bị loại bỏ và mẫu cần phải<br />
phân <strong>tích</strong> lại.<br />
Khi thực hiện tính toán cân bằng ion, điều quan trọng là sử dụng nồng độ H +<br />
dựa trên việc đo đạc tại thời điểm phân <strong>tích</strong> và không lấy giá trị pH đo được ngay<br />
sau khi lấy mẫu nếu như việc phân <strong>tích</strong> không thực hiện ngay sau khi lấy mẫu. Bởi<br />
vì giá trị pH này có thể thay đổi trong quá trình bảo quản mẫu như là kết quả của<br />
sự phản ứng.<br />
Một cách kiểm tra thêm sự phân <strong>tích</strong> dựa trên đến tính dẫn điện<br />
của mẫu trên cơ sở nồng độ đo được:<br />
K c<br />
= ∑λ i<br />
C i<br />
Với:<br />
Kc: độ dẫn (mho.cm -1 )<br />
i: Độ dẫn đương lượng của ion thứ i dùng để điều chỉnh (cho trong bảng 2.5)<br />
Ci: nồng độ eq.L -1 của ion thứ i<br />
Độ dẫn tính toán được so sánh với giá trị đo, Km, cho ta sự chênh lệch độ dẫn,<br />
%CD:<br />
%CD= 100(Kc-Km)/Km<br />
Bảng 2.5 Độ dẫn đương lượng tại 25 0 C và pha loãng vô hạn dùng để điều chỉnh<br />
cho mỗi đơn vị được quy định<br />
Ion Độ dẫn đương lượng((mho.cm -1 )/ eq.L -1<br />
H + 0.35<br />
Cl - 0.076<br />
NO3 - 0.071<br />
SO4 2- 0.08<br />
NH4 + 0.074<br />
Na + 0.050<br />
17
K + 0.074<br />
Mg 2+ 0.053<br />
Ca 2+ 0.060<br />
HCO3 - 0.044<br />
Quan trắc môi trường Nhóm 6<br />
Tiêu chuẩn US EPA về việc loại bỏ kết quả và phân <strong>tích</strong> lại mẫu được cho trong<br />
bảng 2.6, Ví dụ 2.2<br />
Bảng 2.6. Tiêu chuẩn Mỹ EPA để phân <strong>tích</strong> lại mẫu:<br />
Đo độ dẫn µmho cm -1<br />
%CD<br />
± 50<br />
5 - 30 > ± 30<br />
>30 > ± 20<br />
Các mẫu được thu thập trong các cuộc điều tra <strong>nước</strong> <strong>mưa</strong> thường biểu lộ một<br />
mối quan hệ ngược chiều giữa nồng độ ion và lượng <strong>mưa</strong>. Hiệu ứng pha loãng điển<br />
hình này được minh họa trong hình 2.4 cho một thành phần.<br />
Hình 2.4. Nồng độ so với lượng <strong>mưa</strong>.<br />
18
Quan trắc môi trường Nhóm 6<br />
Ví dụ 2.2<br />
Một mẫu <strong>nước</strong> <strong>mưa</strong> được phân <strong>tích</strong> và nồng độ sau đây ngăn chặn khai thác (mg<br />
L -1 ): 0.34 Na + , 0.14 K + , 0.08 Mg 2 + , 0.44 Ca 2+ , 0.78Cl - , 0.72 NO - 3, 0.86 SO 2- 4 và<br />
0.015 NH + 4. Độ pH là 5,03 và độ dẫn 10,9 µmho cm -1 . Tính độ dẫn và so sánh<br />
với độ dẫn đo được.Các mẫu cần phải được tái phân <strong>tích</strong>?<br />
Trước hết, chuyển đổi các nồng độ thành các đơn vị của µeq L -1 như sau:<br />
(µeq L -1 ) = 1000 x (mg L -1 )/khối lượng tương đương<br />
Khối lượng tương đương giống như khối lượng ion dùng cho ion đơn trị, nhưng<br />
một nửa khối lượng ion cho hóa triḥai, như minh họa dưới đây:<br />
H + Na + K + Mg 2+ Ca 2+ Cl - NO3 - SO4 2- NH4 +<br />
Mg L -1 - 0.34 0.14 0.08 0.44 0.78 0.72 0.86 0.015<br />
Eq mass 1.01 22.99 39.10 12.15 20.04 35.45 62.01 48.04 18.05<br />
µeq L -1 9.33 14.79 3.58 6.58 21.96 22.00 11.61 17.90 0.83<br />
Tính dẫn điện, KC bằng cách nhân nồng độ µeq L -1 với các yếu tố thích hợp trong<br />
Bảng 2.5.<br />
Kc = ∑λi x Ci = (9.33 x 0.35) + (14.79 x 0.05) + (3.58 x 0.074)<br />
+ (6.58 x 0.053) + (21.96 x 0.06) + (22.00 x 0.076)<br />
+ (11.61 x 0.071) + (17.9 x 0.08) + (0.83 x 0.074)<br />
= 9.93 µmho cm -1<br />
So với giá trị đo được chúng ta có thể tính toán sự khác biệt độ dẫn theo%:<br />
%CD = 100(Kc –Km)/Km = 100(9.93 – 10.9)/10.9 = -8.9%<br />
Tiêu chuẩn Mỹ EPA (xem Bảng 2.6) quy định rằng nếu %CD > ±30% đối với<br />
mẫu đo độ dẫn trong phạm vi của µmho 5-30 cm-1, thì cần phải được tái phân<br />
<strong>tích</strong>. Đối với các mẫu trong ví dụ này, % CD = -8,9%, chúng ta có thể kết luận<br />
19
Quan trắc môi trường Nhóm 6<br />
rằng có liên hệ giữa độ dẫn đo được và tính toán kết quả có thể được chấp nhận<br />
là hợp lệ.<br />
Nói chung, lượng <strong>mưa</strong> ít kết quả có nhiều mẫu ở nồng độ cao, trong khi <strong>mưa</strong> lớn<br />
kết quả trong nhiều mẫu pha loãng. Ngoài ra, ở giai đoạn ban đầu của lượng <strong>mưa</strong><br />
có nồng độ ion cao hơn so với giai đoạn sau do sự rửa trôi ban đầu của bụi và khí<br />
trong khí quyển.<br />
Một hồ sơ điển hình của một số ion trong một cơn bão đặc biệt được thể hiện<br />
trong Hình 2.5 minh họa tác dụng này. Nồng độ thấp kết hợp với các giai đoạn sau<br />
của <strong>mưa</strong> bão thường được cho là để phản ánh nồng độ <strong>nước</strong> trong đám mây khi<br />
chúng cho kết quả chủ yếu từ <strong>mưa</strong> mà ra.<br />
Hình2.5. Nồng độ của một số ion trong <strong>nước</strong> <strong>mưa</strong> trong một cơn <strong>mưa</strong> nhiệt<br />
đới stormas một hàm của thời gian từ đầu của trận <strong>mưa</strong> rào.<br />
2.3.1 Các câu hỏi và những vấn đề.<br />
1. Thảo luận về các quá trình hóa học dẫn đến sự hình thành của <strong>mưa</strong> acid?<br />
20
Quan trắc môi trường Nhóm 6<br />
Trả lời:<br />
Khí SO2 được oxy hoá trong bầu khí quyển thành H2SO4, giúp nó dễ dàng hấp<br />
thụ bởi <strong>nước</strong> <strong>mưa</strong>. Quá trình oxy hóa tiến hành thông qua một loạt các cơ chế.<br />
Trong pha khí, SO2 được oxy hóa chủ yếu bởi các gốc hydroxyl (OH).<br />
Sulfurdioxide cũng có thể hòa tan trong các hạt mây theo cân bằng sau đây để tạo<br />
SO2 hòa tan, bisulfite (HSO - 3) và sulfite (SO 2- 3) ion:<br />
SO2 + H2O SO2*H2O KH = [SO2*H2O]/p SO2<br />
SO2*H2O HSO3 - + H + K1 = [HSO3 - ][H + ]/[SO2*H2O]<br />
HSO3 - SO3 2- + H + K2 = [SO 2- 3][H + ]/[HSO3 - ]<br />
2. Thảo luận về ảnh hưởng của <strong>mưa</strong> acid?<br />
Trả lời:<br />
Tác động Cơ chế Bằng chứng<br />
Cá chết Độc tính chủ yếu là do việc<br />
giải phóng của A1 từ trầm<br />
<strong>tích</strong>. A1 gây ra tắc nghẽn<br />
mang với dịch nhầy.<br />
Cá hồi và cá hồi nâu đã biến mất<br />
trong hàng ngàn các hồ và các con<br />
song ở Bắc Âu, Canada, Hoa Kỳ và<br />
lochs ở Scotland<br />
Suy giảm<br />
rừng<br />
Thiệt hại<br />
xây dựng<br />
Để hiểu rõ, các giả<br />
thuyết khác nhau đã được đưa<br />
ra, một trong số đó là <strong>mưa</strong><br />
acid đã giải phóng A1 độc<br />
hại từ đất gây tổn thương rễ<br />
và cản trở sự hấp thu các chất<br />
dinh dưỡng. Các áp lực<br />
khác góp phần bao gồm hạn<br />
hán, lạnh, bệnh tật vàô nhiễm<br />
khác như: O3)<br />
SO2 phản ứng với đá vôi<br />
(CaCO3) để tạo thành thạc<br />
cao (CaSO4.H20) trong đó<br />
Lần đầu tiên được quan sát ở<br />
Đức vào giữa những năm 1970. Gần<br />
25% tất cả các cây ở châu Âu đã bị<br />
thiệt hại. Thông thường, cây mất<br />
đi lá kim và ngọn cảu cây xân sam<br />
Na Uy trở nên thưa hơn và lá<br />
chuyển sang màu nâu<br />
Ô nhiễm không khí có thể gây tác<br />
hại đến các di <strong>tích</strong> lịch sử, nó đã<br />
được ghi nhận ở châu Âu, Bắc Mỹ<br />
21
Thiệt hại y<br />
tế<br />
quá trình hòa tan và có thể dễ<br />
dàng được rửa sạch bởi <strong>nước</strong><br />
<strong>mưa</strong><br />
Tăng tốc độ di chuyển của<br />
kim loại nặng trong chuỗi<br />
thức ăn và <strong>tích</strong> lũy các kim<br />
loại nặng trong <strong>nước</strong> uống và<br />
thực phẩm<br />
Quan trắc môi trường Nhóm 6<br />
và châu Á. Trường hợp đáng chú ý<br />
là thành phố Cracow ở Ba Lan,<br />
Acropolis tại Athens và đền Taj<br />
Mahal ở Ấn Độ<br />
3. Làm thế nào để giảm thiểu ảnh hưởng của <strong>mưa</strong> acid?<br />
Trả lời:<br />
- Xây dựng các công trình nghiên cứu khoa học và các dự án liên quan đến<br />
<strong>mưa</strong> acid.<br />
- Các nhà máy nhiệt điện phải lắp đặt thiết bị khử sunphua.<br />
- Các <strong>nước</strong> phát triển đang nghiên cứu xây dựng thuế bảo vệ môi trường không<br />
khí- “thuế cacbon” áp dụng để giảm thiểu khí thải.<br />
4. Tại sao bón vôi không phải là một giải pháp hiệu quả cho quá trình acid<br />
hóa <strong>nước</strong> bề mặt µeq L -1 ?<br />
Trả lời:<br />
pH của <strong>nước</strong> thường xuyên biến động theo chu kỳ ngày đêm. Ngoài ra, pH<br />
của <strong>nước</strong> có thể bị thấp do đất phèn, đặc biệt là hiện tượng pH giảm đột ngột sau<br />
những cơn <strong>mưa</strong> đầu mùa. Sự biến động pH quá lớn sẽ ảnh hưởng trực tiếp gây sinh<br />
trưởng của các loài thủy sinh. pH quá cao (vào buổi trưa) hay quá thấp (vào sáng<br />
sớm) còn có ảnh hưởng gián tiếp làm tăng hàm lượng các khí độc. Khi pH cao sẽ<br />
làm tăng hàm lượng NH3, ngược lại pH thấp sẽ làm tăng hàm lượng H2S gây độc<br />
cho cá. Sử dụng vôi để giữ pH ổn định, giúp tôm cá sinh trưởng tốt, tỉ lệ sống và<br />
năng suất cao.<br />
22
Quan trắc môi trường Nhóm 6<br />
5. Phác thảo các kỹ thuật phân <strong>tích</strong> chính và phương pháp lấy mẫu được sử dụng<br />
trong các cuộc điều tra <strong>nước</strong> <strong>mưa</strong>. Danh sách các chất phân <strong>tích</strong> chính và đề ra các<br />
kỹ thuật phân <strong>tích</strong> thích hợp cho mỗi chất phân <strong>tích</strong>?<br />
Trả lời:<br />
‣ Các kỹ thuật để phân <strong>tích</strong> <strong>nước</strong> <strong>mưa</strong>:<br />
Kỹ thuật phân <strong>tích</strong><br />
Chất phân <strong>tích</strong><br />
Sắc ký Ion (IC) Cl - , NO3 - , SO 2- 4, NH + 4, Na + , K + , Mg 2 + ,<br />
Ca 2+ , formate, acetate.<br />
Quang phổ hấp thụ nguyên tử ngọn Na + , K + , Mg 2+ , Ca 2+ .<br />
lửa (FAAS)<br />
Quang phổ phát xạ nguyên tử ngọn Na + , K + , Mg 2+ , Ca 2+ .<br />
lửa(FAES)<br />
Lò hấp thụ nguyên tử Graphite Kim loại vết.<br />
Quang phổ (GFAAS)<br />
Một số kim loại vết.<br />
Ban đầu, <strong>nước</strong> <strong>mưa</strong> được thu vào thùng hoặc phễu đưa vào trong chai, vì vậy<br />
được gọi là thu gom số lượng lớn, và cách lấy mẫu này vẫn còn áp dụng đến<br />
nay, đặc biệt là tại các địa điểm ở xa hoặc khó tiếp cận.<br />
6. Tính toán nồng độ của HSO3 - và SO2 -3 : trong trạng thái cân bằng với 5 ppbv<br />
SO2: (a) pH 4, (b) pH 7, và (c) pH 9. Sử dụng các hằng số cân bằng sau đây cho<br />
SO2: KH = 1.24 mol L -1 atm-1, K1 = 1.74 x 10⁻² mol L -1 , K2 = 6.24 x 10⁻⁸ mol L -1 ?<br />
7. Tính pH của <strong>nước</strong> ở trạng thái cân bằng với 10 ppbv SO2 bằng cách sử dụng<br />
các hằng số cân bằng được đưa ra trong câu hỏi trước?<br />
8. Chuyển đổi các nồng độ dưới đây thành µeq L -1 ?<br />
(a) 3.5 mg L -1 SO2 -4 µeq L -1 = (1000 x 3.5)/64 = 54.69 µeq L -1<br />
(b) 25 mg L -1 PO3 -4 µeq L -1 = (1000 x 25)/79 = 316.5 µeq L -1<br />
(c) 18 mg L -1 NO -3 µeq L -1 = (1000 x 18)/30 = 600 µeq L -1<br />
23
Quan trắc môi trường Nhóm 6<br />
(d) 98 µg L -1 Ca 2+ µeq L -1 = (1000 x 98.10 -3 )/40 = 2.45 µeq L -1<br />
9. Một mẫu <strong>nước</strong> <strong>mưa</strong> được phân <strong>tích</strong> và tìm thấy có những thành phần sau đây<br />
trong mg L -1 : 1.47 Na + , 1.53 K + , 0.29 Mg 2+ , 2.56 Ca 2+ , 0,39 Cl - , 2.01 NO -3 , 0.38<br />
SO2 -4 và 0,12 NH +4 . pH của mẫu là 5,01 và độ dẫn điện là 17,2 µmho cm -1 . Kiểm<br />
tra sự đúng đắn của phương pháp phân <strong>tích</strong> của sự cân bằng electron và phép đo độ<br />
dẫn. Kết quả phân <strong>tích</strong> nên bị bác bỏ hay không?<br />
2.4 pH, độ dẫn và các anion chính:<br />
2.4.1 Phương pháp:<br />
pH và độ dẫn được xác định ngay lập tức với mẫu vừa được lấy lên bằng<br />
cách sử dụng phương pháp điện hóa.Những ion chính có thể được xác định trong<br />
mẫu đã được bảo quản.Trong thí nghiệm, nồng độ của Cl - , NO3 - và SO4 2- thì được<br />
xác định bằng phương pháp sắc kí ion (IC) cùng thời gian như đo pH và đo độ dẫn.<br />
Mẫu thì được bảo quản tại 4 0 C trong tủ lạnh cho việc phân <strong>tích</strong> các cation tiếp theo<br />
bằng phương pháp phổ hấp thu nguyên tử (ASS).<br />
2.4.2 Chuẩn bị chai chứa mẫu<br />
2.4.2.1 Dụng cụ đựng mẫu<br />
Chai PP (Polypropylene) (có kích thước từ 150 mL đến 1L)<br />
2.4.2.2 Quy trình thí nghiệm:<br />
Mang nhiều chai PP (150-1000 mL) đi dán nhãn và cân chúng trên thiết bị<br />
cân bằng để giữ chai cân bằng. Ghi lại khối lượng của chai chứa chứa mẫu.Trước<br />
khi chứa mẫu <strong>nước</strong> <strong>mưa</strong>, chai chứa mẫu phải được làm sạch. Mang những chai PP<br />
đã được cân với thể <strong>tích</strong> 150mL đi tráng với <strong>nước</strong> của phòng thí nghiệm. Sau đó đổ<br />
đầy <strong>nước</strong> của phòng thí nghiệm vào những chai đã được làm sạch và đậy nắp. Một<br />
vài chai có thể được đổ vào bằng <strong>nước</strong> và được phân tich như là mẫu trắng. Bạn<br />
nên gom những chai mẫu trắng lại cùng 1 chỗ và mang trở lại phòng thí nghiệm, và<br />
bảo quản trong cùng điều kiện như là mẫu cần phân <strong>tích</strong>.Việc phân <strong>tích</strong> những mẫu<br />
trắng này có thể cho bạn biết rằng bạn đã nghiêm túc như thế nào trong công việc<br />
lấy mẫu của bạn; nếu mà có bất kì chất nhiễm bẩn nào thể hiện trong mẫu trắng thì<br />
có nghĩa là bạn làm việc rất cẩu thả!<br />
24
Quan trắc môi trường Nhóm 6<br />
Mặc dù thuốc thử hóa học để làm sạch như là acid chromic hoặc DECON<br />
90 co thể được sử dụng để làm sạch chai, nhưng mà việc này cần được tránh sự<br />
nhiễm bẩn của chai bằng cách làm sạch chính thuốc thử. Mặc dù trong nhiều mẫu<br />
<strong>nước</strong> <strong>mưa</strong> có sự tinh khiết, nhưng với lượng nhỏ của chất nhiễm bẩn có thể dẫn<br />
đến sự sai lệch.<br />
2.4.3 Lấy mẫu<br />
2.4.3.1 Dụng cụ lấy mẫu<br />
• Phễu (đường kính 15-25 cm) và chai PP hoặc thùng nhựa<br />
• Giá đỡ và cái kẹp ống nghệm<br />
2.4.3.2 Quy trình thực hiện:<br />
Nhiệm vụ chính là để xác định 1 mẫu hiện diện và tránh bất kì chất nhiễm<br />
bẩn.Tìm nơi lấy mẫu phù hợp, đưa ra việc xem xét các tiêu chí. Dụng cụ lấy mẫu<br />
nên được đặt ở một khu vực mở không có sự cản trở phía trên hoặc gần dụng cụ<br />
lấy mẫu, cái mà có thể cản trở hướng chảy của <strong>mưa</strong>, hoặc là gây nhiễm bẩn mẫu<br />
(vd: không đặt dụng cụ lấy mẫu phía dưới, hoặc gần cây, gần tòa nhà cao, kế bên<br />
bức tường…). Vị trí tốt nhất để đặt dụng cụ lấy mẫu là sân thượng của toà nhà<br />
hoặc trong 1 nơi được làm sạch như là cái sân. Dụng cụ lấy mẫu nên được đặt tại<br />
độ cao 1m phía trên bề mặt nếu có thể.<br />
Lấy 1 chai lấy mẫu thể tich là 150-1000mL, đổ hết <strong>nước</strong> ra ngoài và lắc để<br />
loại bỏ hết giọt <strong>nước</strong>. Đưa vào cái chai 1 cái phễu PP và phơi dụng cụ lấy mẫu<br />
trong sân tại vị trí wlấy mẫu đã chọn.Bạn có thể sử dụng 1 cái giá đỡ và cái kẹp<br />
ống nghiệm, hoặc một vài phương pháp khác, để giữ cái chai và cái phễu đúng vị<br />
trí và ngăn không để cho dụng cụ lấy mẫu bị lật đổ khi có gió. Nếu bạn không có 1<br />
cái phễu, bạn có thể sử dụng cái thùng để lấy mẫu và chuyển nó đến 1 cái chai sau<br />
khi lấy mẫu. Chắc chắn sự chính xác về thời gian và ngày khi bạn phơi dụng cụ lấy<br />
mẫu trong cái sân với thời gian và ngày khi bạn di chuyển dụng cụ lấy mẫu khỏi vị<br />
trí đó hoặc thay đổi chai lấy mẫu. Thật là lý tưởng rằng bạn nên phơi dụng cụ lấy<br />
mẫu trước trận <strong>mưa</strong> rào và mang nó vào bên trong ngay lập tức sau trân <strong>mưa</strong> rào,<br />
nhưng điều này có thể không luôn luôn thực tế. Trong suốt trận <strong>mưa</strong> lớn cái chai có<br />
thể đầy rất nhanh.Trong trường hợp này, không cho phép để chai tràn ra nhưng vẫn<br />
giữ được sự thay đổi của chai, ghi lại chính xác thời gian phơi của mỗi chai bên<br />
ngoài.Trong suốt cơn <strong>mưa</strong> phùn bạn có thể phải phơi dụng cụ lấy mẫu qua nhiều<br />
lần <strong>mưa</strong> để lấy được thể <strong>tích</strong> mẫu đủ cho việc phân <strong>tích</strong> (100mL). Nhớ chú ý vị trí<br />
và thời gian lấy mẫu, bởi vì với bất kì việc quan sát cái mà co thể giúp bạn giải<br />
25
Quan trắc môi trường Nhóm 6<br />
thích kết quả của bạn (các yếu tố khí tượng có liên hệ tới thời gian của việc lấy<br />
mẫu của bạn bởi vì nó được thông báo trên những tờ báo địa phương và trên TV;<br />
quan sát 1 cách trực quan về việc cháy rừng gần đó; ước lượng nguồn ô nhiễm<br />
không khí; hiện diện của côn trùng hoặc chim rơi vào mẫu của bạn; hiện diện<br />
những hạt bụi trong mẫu của bạn…). Nếu bạn đang thực hiện cuộc nghiên cứu quá<br />
trình lắng đọng trong thời gian dài hơn là nghiên cứu về những cơn <strong>mưa</strong> riêng lẻ,<br />
bạn có thể sử dụng chai lấy mẫu lớn hơn (1 hoặc 2 L) và để những cái chai phơi<br />
bên ngoài 1 thời gian dài (1 ngày, 1 tuần…). Nếu bạn đang sử dụng 1 cái máy lấy<br />
mẫu <strong>nước</strong> <strong>mưa</strong> tự động, thì sau đó chỉ cần bạn làm theo sự hướng dẫn đã có sẵn.<br />
Bạn nên mang những cái mẫu đã được thu thập đến phòng thí nghiệm ngay lập<br />
tức để phân <strong>tích</strong> pH và độ dẫn. Nếu điều này không thể, hãy để chai có chứa mẫu<br />
trong tủ lạnh của nhà bạn đến khi có thời gian thì bạn có thể mang đến phòng thí<br />
nghiệm (giữ mẫu trong tủ lạnh ở chỗ sử dụng cho thức ăn thì không phải là ý kiến<br />
tốt nếu bạn thực hiện 1 dự án nghiên cứu về chất ô nhiễm hữu cơ trong <strong>nước</strong> <strong>mưa</strong>).<br />
Chắc rằng mẫu của bạn phải được dán nhãn để mà chúng sẽ không bị lẫn lộn với<br />
những mẫu của học sinh khác.<br />
Trước khi thực hiện bất kì việc phân <strong>tích</strong> nào, phải cân chai chứa mẫu <strong>nước</strong> <strong>mưa</strong><br />
trên 1 cái cân.Từ sự khác biệt về giữa khối lượng của chai chứa mẫu và cùng cái<br />
chai đó khi nó không trống, thì tính toán thể <strong>tích</strong> của <strong>nước</strong> <strong>mưa</strong> thu được.<br />
2.4.4 Độ dẫn<br />
2.4.4.1 Dụng cụ và hóa chất<br />
• Đồng hồ đo độ dẫn<br />
• KCl<br />
2.4.4.2 Quy trình thí nghiệm:<br />
Chuẩn bị 1 dung dịch chuẩn để hiệu chuẩn máy đo độ dẫn. Cân chính xác 5.1 g<br />
KCl và hòa tan với 1L <strong>nước</strong> cất trong 1 cái bin định mức có thể <strong>tích</strong> 1L. Hòa tan<br />
10mL của dd thành 1L với <strong>nước</strong> cất trong 1 bình định mức co thể <strong>tích</strong> 1L. Đây là<br />
dung dịch chuẩn làm việc của bạn, có độ dẫn là 100μohm cm -1 .<br />
Đọc sách hướng dẫn của máy đo độ dẫn hoặc hỏi người giảng giải để giải thích<br />
dụng cụ phân <strong>tích</strong> này. Sử dụng máy đo độ dẫn, thực hiện theo các phép đo như<br />
sau: Đặt dung dịch chuẩn làm việc KCl trong 1 cái beaker nhỏ và nhúng đầu đo độ<br />
dẫn vào dung dịch, giữ nó xấp xỉ 1.5 cm phía trên của đáy beaker và chắc rằng nó<br />
26
Quan trắc môi trường Nhóm 6<br />
sẽ không co bất kì tương tác gì với cái thành của beaker. Hiệu chỉnh độ dẫn tới<br />
100μohm cm -1 .Tráng đầu dò với <strong>nước</strong> cất, và thực hiện việc đo mẫu của bạn giống<br />
như trên. Bạn không cần hiệu chỉnh máy đo giữa mỗi lần đo nhưng bạn phải tráng<br />
đầu dò giữa mỗi làm đo. Cũng nên phân <strong>tích</strong> mẫu trắng. Những mẫu trắng thì có độ<br />
dẫn không cao hơn <strong>nước</strong> cất của bạn. Luôn luôn đo độ dẫn trước khi đo pH.Sự rò rỉ<br />
electrol từ đầu dò pH có thể gây ra 1 sự thay đổi đáng kể trong độ dẫn của dung<br />
dịch có độ tinh khiết cao, độ dẫn giảm, mẫu. Khi không sử dụng thì nhúng đầu dò<br />
vào dung dịch chứa <strong>nước</strong> cất.<br />
2.4.5 pH<br />
2.4.5.1 Vật liệu:<br />
• Dung dịch đệm<br />
• Máy đo pH , tốt hơn với sự kết hợp pH điện cực và đầu dò bổ sung nhiệt độ<br />
• Khuấy từ và thanh khuấy<br />
2.4.5.2 Quy trình thí nghiệm:<br />
Việc đo pH nên được làm ngay lập tức sau khi lấy mẫu nhưng điều này không luôn<br />
luôn thực tế. Sử dụng máy đo và điện cực pH theo các bước sau. Đầu tiên, hiệu<br />
chỉnh máy đo và điện cực pH sử dụng cách hiệu chỉnh 2 điểm với dung dịch đệm<br />
pH 7 và 4. Một người kỹ thuật viên và người giảng giải sẽ giới thiệu cách sử dụng<br />
máy đo pH như thế nào; nếu không có thể làm theo sự hướng dẫn trong sách hướng<br />
dẫn. Sau khi hiệu chỉnh, nhúng điện cực pH vào mẫu <strong>nước</strong> <strong>mưa</strong> và tiến hành đo.<br />
Bạn có thể lắc dung dịch nhưng phải để yên trước khi đo. Ngoài ra, bạn có thể đặt<br />
một thanh khuấy từ trong dung dịch và khuấy đều trong 15 giây bằng một máy<br />
khuấy từ. Sau tắt máy khuấy, để pH ổn định (khoảng 2 phút) trước khi đọc. Bạn có<br />
thể nhận thấy rằng trong một số dung dịch giá trị pH bị lệch. Trong trường hợp bị<br />
lệch, cho phép người đọc để ổn định trước khi ghi giá trị pH. Nếu đọc không ổn<br />
định, và hiệu suất điện là thỏa đáng, ghi lại các giá trị pH đạt được sau 5 phút và<br />
báo cáo điều này. Độ lệch có thể là do sự thay đổi hóa học xảy ra trong mẫu và<br />
không phải do điện cực bị lỗi. Bạn có thể kiểm tra hiệu năng của điện cực bằng<br />
cách đo pH của dung dịch axit loãng (ví dụ HCl hoặc H2SO4) pH 4 và ghi nhận pH<br />
và thời gian phản ứng. Ghi kết quả pH đến hai chữ số thập phân. Rửa điện cực<br />
bằng <strong>nước</strong> trong phòng thí nghiệm và tăm bông khô giữa mỗi lần đọc. Khi đọc,<br />
phải dừng các điện cực trong các dung dịch kiểm tra, đảm bảo rằng nó không chạm<br />
vào thành của cốc thủy tinh. Khi không sử dụng, để các điện cực ngâm trong <strong>nước</strong><br />
trong phòng thí nghiệm hoặc dd đệm. Điện cực mới nên được làm sạch bằng dung<br />
27
Quan trắc môi trường Nhóm 6<br />
dịch axit yếu (0.01 M) và sau đó được giữ trong đệm pH 4. Nếu phản ứng của điện<br />
cực chậm, thì kích hoạt lại nó theo các hướng dẫn được đưa ra trong Phụ lục II.<br />
2.4.6 Các anion chính (Cl - , NO3 - và SO4 2- )<br />
2.4.6.1 Vật liệu :<br />
• Sắc ký ion (ví dụ Shimadzu) được trang bị máy dò độ dẫn, và điện <strong>tích</strong> kế<br />
hoặc máy ghi biểu đồ.<br />
• Cột phân cách anion (ví dụ Shim gói IC-Al).<br />
• Ống tiêm và bộ vi lọc.<br />
• Các dd chuẩn gốc của C1 - , NO3 - , SO4 2- , 1000 mg L -1 cho mỗi dd. Những dd<br />
này có thể được mua từ các nhà cung cấp, nếu không chuẩn bị của riêng bạn<br />
bằng cách hòa tan một lượng sau đây của các muối trong <strong>nước</strong> và tới 1L:<br />
1.6485 g NaCl, 1.3707 g NaN03 và 1.8141 g K2SO4. Làm khô các dung dịch<br />
muối trên ở trên lò ở 110 o C trong 2 giờ trước khi cân.<br />
• Pha động: 2.5 mM axit phtalic, 2.5 mM Tris (hydroxymethy1) -<br />
aminomethan, pH = 4.0. Lọc qua bộ lọc Millipore HATF (12:45) trước khi<br />
sử dụng.<br />
2.4.6.2 Quy trình thực hiện:<br />
Trong ví dụ đưa ra ở đây, các ion được phân cách bằng cách sử dụng sắc kí ion<br />
không supressor. Chuẩn bị và lọc pha động cho sắc ký ion. Một kỹ thuật viên hay<br />
người giảng giải sẽ bật sắc ký ion và điện <strong>tích</strong> kế cho bạn, và làm cho tất cả các<br />
điều chỉnh cần thiết. Điều kiện hoạt động điển hình với một loại đặc biệt của nhạc<br />
cụ (Shimadzu) được đưa ra trong Bảng 2.7. Bạn phải tối ưu hóa điều kiện đầu dò<br />
sắc kí và đầu dò độ dẫn để đạt được những peak phù hợp. Cột tách anion sẽ khác<br />
nhau, tùy thuộc vào thương hiệu của công cụ mà bạn sẽ sử dụng. Cột IC-A1 Shimpack<br />
là để sử dụng với một sắc ký ion Shimadzu.<br />
Bảng 2.7: Sắc kí ion và điều kiện phân <strong>tích</strong><br />
Sắc ký ion Shimadzu HIC-6A<br />
Hệ thống điều khiển Shimadzu SCL-6B<br />
Bơm sắc ký lỏng Shimadzu LC-6A<br />
Đầu dò độ dẫn Shimadzu CDD-6A<br />
Cột Shim-pack IC-A 1<br />
Tốc độ đưa mẫu =1.5 mL min -1<br />
Độ dẫn = 1 pScm -1<br />
28
Quan trắc môi trường Nhóm 6<br />
Pha loãng 1000 mg L -1 dung dịch chuẩn gốc để chuẩn bị cho hiệu chỉnh hỗn hợp<br />
chuẩn, mỗi hỗn hợp có chứa nồng độ lần lượt của Cl - , NO3 - , SO4 2- : 0,1 mg L -1 , 0,2<br />
mg L -1 , 0,5 mg L -1 , 0,8 mg L -1 và 1,0 mg L -1 (N.B. Bạn có thể phải chuẩn bị các dd<br />
chuẩn nhiều hơn nếu mẫu của bạn có chứa nồng độ các ion này cao hơn). Đầu tiên<br />
phân <strong>tích</strong> mẫu trắng của <strong>nước</strong> tinh khiết, sau đó phân <strong>tích</strong> các dung dịch chuẩn<br />
dùng hiệu chỉnh. Bạn nên lọc một phần nhỏ của mẫu <strong>nước</strong> <strong>mưa</strong> bằng cách sử dụng<br />
vi lọc và ống tiêm và tiêm nó vào cổng tiêm. Một phương pháp tiêm để tiêm 1 ml<br />
mẫu vào vòng lặp mẫu 200μ L thiết lập trong vị trí "tải", và sau đó chuyển sang<br />
"bơm" thiết lập để quét mẫu vào sắc kí ion. Một loại sắc điển hình của một mẫu<br />
<strong>nước</strong> <strong>mưa</strong> được thể hiện trong hình 2.6. Nếu mẫu của bạn có nồng độ quá cao và<br />
những peak thì quá cao vượt qua hơn đối với sắc kí đồ, pha loãng các mẫu và phân<br />
<strong>tích</strong> một lần nữa. Đo chiều cao peak và chuẩn bị đồ thị đường chuẩn của chiều cao<br />
peak để so sánh với nồng độ của mỗi ion. Ước tính nồng độ trong các mẫu của bạn<br />
bằng cách nội suy từ đồ thị đường chuẩn. Cũng có thể phân <strong>tích</strong> những mẫu trắng<br />
của <strong>nước</strong> để kiểm tra độ tinh khiết của <strong>nước</strong> trong phòng thí nghiệm của bạn.<br />
Chú ý:<br />
Nếu sử dụng một hệ thống sắc ký khác, hãy làm theo các hướng dẫn trong sách<br />
phương pháp được cung cấp bởi các nhà sản xuất liên quan đến cột và pha động<br />
bạn nên sử dụng. Nếu bạn đang phân <strong>tích</strong> các anion bằng cách sử dụng sắc ký co<br />
thiết bị loại bỏ ion không mong muốn có trên sắc ký ion Dionex được trang bị cột<br />
AS4A, chuẩn bị một dung dịch gồm 2,8 mM NaHCO3 + 2.2 mM Na2C03 để sử<br />
dụng như là pha động.<br />
2.5 Cá c cation chính<br />
2.5.1 Kim loại kiềm và kim loại kiềm thổ (Na, K, Mg, Ca)<br />
29
Quan trắc môi trường Nhóm 6<br />
2.5.1.1Phương phá p: mẫu nướ c <strong>mưa</strong> được lưu trữ và đem phân tićh pH, đô ̣ dẫn<br />
điêṇ và các anion được phân tićh cho kim loai ̣ kiềm và kiềm thổ (Na, K, Mg) bằng<br />
phổ hấp thu nguyên tử (ASS) trong ngoṇ lử a không khí / axetylen.<br />
Sắc kí ion điển hình của 1 mẫu <strong>nước</strong> <strong>mưa</strong><br />
2.5.1.2 Duṇg cụvà hóa chất<br />
- Máy quang phổ hấp thu nguyên tử<br />
- Acid nitric HNO3<br />
- Dung dịch chứ a các ion Na, K, Ca và Mg 1000mg/l. Có thể được mua từ nhà<br />
cung cấp hoă ̣c tự chuẩn bi.<br />
̣<br />
30
Quan trắc môi trường Nhóm 6<br />
- Hòa tan 2,542g NaCl, 1,907g KCl, 2,497g CaCO3, 4,952g MgSO4. Thêm khoảng<br />
10ml HCl và 1.5 ml HNO3 để phân giải Ca và Mg lần lươṭ, trướ c khi lên đến khối<br />
lươṇg. Sấy khô muối ở 110 o C trong 2h trướ c khicân (Đă ̣c biêt ̣ quan troṇg vớ i<br />
NaCl)<br />
- Giải pháp lanthanum. Hòa tan 67g lantan clorua (LaCl3.7H2O) trong acid HNO3<br />
1M đun nóng nhe ̣sau đó để nguôị và đinh ̣ mứ c thành 500ml vớ i nướ c cất.<br />
2.5.1.3 Quy triǹh thử nghiêṃ.<br />
- Môt ̣ kỹ thuât ̣ viên hay ngườ i hướ ng dâñ nên bât ̣ máy quang phổ hấp thu nguyên<br />
tử và chỉ cho baṇ cách sử duṇg. Baṇ cũng có thể tham khảo hướ ng dâñ sử duṇg để<br />
biết chi tiết cu ̣ thể của các thông số hoat ̣ đôṇg. Bướ c sóng, giớ i haṇ phát hiêṇ và<br />
phaṃ vi hoat ̣ đôṇg được tra trong bảng 2.8.<br />
Bả ng 2.8 Khoảng bướ c só ng, giớ i haṇ làm phá t hiêṇ và phaṃ vi làm viê ̣c củ a<br />
má y quang phổ hấ p thu nguyên tử AAS<br />
Na<br />
Bướ c sóng nm<br />
589<br />
Giớ i haṇ phát hiêṇ<br />
mg/L<br />
0.002<br />
Phaṃ vi làm viê ̣c<br />
mg/L<br />
0.03-2<br />
K<br />
766.5<br />
0.005<br />
0.1-2<br />
Ca<br />
422.7<br />
0.005<br />
0.2-20<br />
Mg<br />
285.2<br />
0.0005<br />
0.02-2<br />
- Chuẩn bi ̣các mâũ có chứ a hỗn hợp có nồng đô ̣sau:<br />
- Pha loãng từ dd tiêu chuẩn 1000mg/L: 0.1, 0.2, 0.5, 0.8, 1.0, 1.5 và 2 mg/L.<br />
thêm 1ml HNO3 loãng vao các biǹh hiêụ chuẩn 100ml<br />
- <strong>Phân</strong> tićh axit nitric sử duṇg phổ hấp thu nguyên tử cho mỗi ion kim loai ̣ để<br />
đảm bảo không bi ̣nhiễm các ta ̣p chất. <strong>Phân</strong> tićh mẫu chuẩn và mâũ nướ c<br />
<strong>mưa</strong> bở i aspirating vào ngoṇ lử a của ASS duṇg cu ̣ trang bi ̣đèn và âm cực<br />
rỗng thićh hợp hoat ̣ đôṇg ở bướ c sóng thićh hợp cho các ion kim loai ̣ được<br />
phân tićh<br />
- Ghi lai ̣ các giá tri, ̣có được chiều cao của pic trên biểu đồ kết nối vớ i các<br />
thiết bi ̣ASS. Hút nướ c giữa mỗi mâũ và mâũ chuẩn để ổn đinh. ̣ Khí ở mỗi<br />
31
Chú ý :<br />
Quan trắc môi trường Nhóm 6<br />
mâũ hoă ̣c mâũ chuẩn đủ lâu để ổn đinh ̣ và có thể đo ̣c. Chuẩn bi ̣đồ thi ̣hiêụ<br />
chuẩn chiều cao đỉnh đối vớ i nồng đô ̣ của kil và đánh giá nồng đô ̣ của các<br />
ion trong nướ c <strong>mưa</strong> từ đồ thiḥiêụ chuẩn<br />
1. trong trườ ng hợp bất kỳ mâũ nào có nồng đô ̣ cao và mứ c đỉnh của đồ thi ̣giảm,<br />
pha loãng và phân tićh lai ̣ lần nữa. Măt ̣ khác, làm giàu mâũ chuẩn rồi đem phân<br />
tićh<br />
2. Ca và Mg bi ạ̉nh hưở ng bở i phosphate do đó nên xác đinh ̣ như sau. Lấy 50ml dd<br />
chuẩn làm viê ̣c ở trên và thêm 5ml dd lanthanum. Cũng đo ra 50ml mâũ nướ c <strong>mưa</strong><br />
và thêm 5ml dd thelanthanum(hoă ̣c thêm vớ i tỉ lê ̣10:1 khi ko đủ 50ml). <strong>Phân</strong> tićh<br />
ở các bướ c sóng Ca và vẽ 1 đồ thi ̣hiêụ chuẩn. Nếu nồng đô ̣ xác đinh ̣ khác nhau<br />
đáng kể so vớ i viê ̣c sác đinh ̣ ở trên, đã có can thiê ̣p vào viê ̣c phân tićh đầu tiên để<br />
xác đinh ̣ lai ̣ dữ liêụ của Ca. lă ̣p lai ̣ tương tự vớ i Mg<br />
3. Nếu không có máy quang phổ hấp thu nguyên tử ta có thể xử duṇg máy quang<br />
kế ngoṇ lử a (flame photometer) để xác đinh ̣ Na, K, Mg và Ca. Ngoṇ lử a trắc quang<br />
dưạ trên nguyên lý phát xa ̣nguyên tử và nó phù hợp cho viê ̣c phân tićh sau này. Sử<br />
duṇg các tiêu chuẩn tương tự như trong phương pháp đo phổ hấp thu nguyên tử<br />
4. Có thể dùng máy quang phổ phát xa ̣ nguyên tử plasma ICP-AES nếu có sẵn<br />
trong phòng thí nghiêṃ<br />
ICP có thể ko đủ nhaỵ đối vớ i K trong mâũ nướ c <strong>mưa</strong> giớ i haṇ phát hiêṇ cho K là<br />
100pg/L<br />
Thiết bi ̣phải được lâ ̣p triǹh bở i 1 kỹ thuât ̣ viên. Phương pháp phân tićh mâũ chuẩn<br />
và mâũ phân tićh thực hiêṇ giống như AAS<br />
2.5.2 Ammonium NH4 +<br />
2.5.2.1 Phương phá p: ion amoni được xác đinh ̣ bằng cách đo màu sử duṇg pp<br />
indophenol có máu xanh. Phương pháp này dưạ trên các phản ứ ng của hypochlorite<br />
phenol và amoni, được cung cấp bở i 1 loai ̣ thuốc nhuôṃ màu indophenol màu<br />
xanh được mô tả bở i Weatherburn (1967). Được thúc đẩy phản ứ ng bở i natri<br />
nitroprusside. Phương pháp này được đo ở bướ c dóng 625nm bằng máy quang phổ<br />
2.5.2.2 Dụng cụvà hóa chất.<br />
32
Quan trắc môi trường Nhóm 6<br />
- Máy quang phổ<br />
- Thuốc thử A. hòa tan 5g phenol và 25mg natri nitroprusside vào nướ c cất<br />
đinh ̣ mứ c thành 500ml. Bảo quản trong tủ laṇh, thờ i gian sử duṇg 1 tháng<br />
- Thuốc thử B. Hòa tan 2.5g natri hydroxit NaOH và 4.2 ml dd natri<br />
hypochlorite NaClO (5% clo) vào trong BĐM 500ml. sử duṇg sau vài<br />
ngày. Lưu trữ trong chai tối và bỏ trong tủ laṇh. Thờ i gian sử duṇg 1<br />
tháng<br />
- Dd amoni 1000mg/L (sản phẩm thương mai ̣ có sẵn) hoă ̣c chuẩn bi ḍd amoni<br />
100mg/L bằng cách hòa tan 0.367g (NH4)2SO4 vào trong nướ c và đinh ̣ mứ c<br />
thành 1 lít. Muối phải được làm khô ở 110 đô ̣C trong 2h trướ c khi cân<br />
2.5.2.3 Quy trình thực hiêṇ.<br />
- Rút 0.5ml mâũ nướ c <strong>mưa</strong> vô ống nghiêṃ thêm 5ml dd A và 5ml dd B che<br />
miêṇg ống vớ i parafilm và lắc maṇh. Đăt ̣ ống nghiêṃ trong nướ c ở 37 o C<br />
trong 15 phút hoă ̣c ở nhiêt ̣ đô ̣ phòng trong 30 phút. Đo đô ̣ hấp thu của màu<br />
xanh lá trong cuvet 1cm ở bướ c sóng 625nm trên máy quang phổ UV. Lă ̣p<br />
lai ̣ tương tự đối vớ i mâũ trắng thay 0.5ml nướ c <strong>mưa</strong> bằng 0.5ml nướ c cất.<br />
Trừ đi đô ̣hấp thu của mâũ trắng từ mâũ phân tićh<br />
- Chuẩn bi ̣dãy chuẩn của NH4 + trong các biǹh đinh ̣ mứ c vớ i các nồng đô ̣ 0.1<br />
– 10pg/ml bằng cách pha loãng dd 1000pg/l hoă ̣c 100pg/l, rút 0.5ml từ mỗi<br />
mâũ chuẩn thêm 5ml dd A 5ml dd B và thực hiên tương tự như đối vớ i mâũ<br />
phân tićh, dưṇg đườ ng chuẩn và xác đinh ̣ nồng đô ̣ NH4 + trong mâũ nướ c<br />
<strong>mưa</strong>.<br />
Chú ý :<br />
1. Có thể tăng thể tićh mâũ để phân tićh nếu nôǹg đô ̣ amoni quá thấp. Thay<br />
vì 0.5ml thì có thể sử duṇg 1, 2 hoă ̣c 5ml mâũ. Trong trườ ng hợp này<br />
chuẩn bi ̣dãy chuẩn vớ i nồng đô ̣ thấp hơn và tăng thể tićh lấy mâũ chuẩn<br />
sao cho băng vớ i thể tićh mâũ phân tićh<br />
2. Có thể xác đinh ̣ amoni bằng máy điêṇ cực choṇ lo ̣c ion (ion selective<br />
electrode ISE) nếu như có sẵn trong phòng thí nghiêṃ, thực hiêṇ theo<br />
hướ ng dâñ đi kèm vớ i máy<br />
33


