You also want an ePaper? Increase the reach of your titles
YUMPU automatically turns print PDFs into web optimized ePapers that Google loves.
<strong>Money</strong><br />
Management<br />
An independent assessment of<br />
Khyber Pakhtunkhwa’s Budget FY2018-19<br />
& trends from FY2013-14 to FY2018-19<br />
Omar Asghar Khan Foundation
Omar Asghar Khan Foundation<br />
regularly analyzes<br />
Khyber Pakhtunkhwa’s budget<br />
since 2010. Publications<br />
documenting its findings &<br />
recommendations are available<br />
at www.oakdf.org.pk<br />
The use of the Foundation’s<br />
budget analysis is encouraged.<br />
Acknowledgement is requested.<br />
,<br />
,
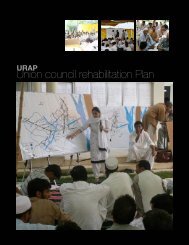
<strong>Money</strong><br />
Management<br />
An independent assessment of<br />
Khyber Pakhtunkhwa’s Budget FY2018-19<br />
& trends from FY2013-14 to FY2018-19
Acronyms<br />
CSO<br />
ERRA<br />
FY<br />
IT<br />
KP<br />
LG<br />
NFC<br />
PFC<br />
PTC<br />
Civil Society Organization<br />
Earthquake Reconstruction & Rehabilitation Authority<br />
Financial Year<br />
Information Technology<br />
Khyber Pakhtunkhwa<br />
Local Government<br />
National Finance Commission<br />
Provincial Finance Commission<br />
Parent-Teacher Council
Contents<br />
Governing within Means<br />
Districts & Development<br />
Priorities: Government, People<br />
Pro-Women Funds<br />
Fiscal Decentralization<br />
Block Funds<br />
Recommendations<br />
1<br />
4<br />
8<br />
12<br />
14<br />
16<br />
17
1
Governing within<br />
means<br />
Rs.648 billion is estimated as total revenue<br />
receipts for FY2018-19. This is 7.5 per cent<br />
higher than Rs.603 billion initially<br />
estimated in the preceding year, later<br />
revised down to Rs.546.5 billion. In other<br />
words, the revenue target for FY2018-19 is<br />
about 18.6 per cent higher than achieved<br />
in the preceding year.<br />
Federal transfers are a key source of<br />
revenue for Khyber Pakhtunkhwa.<br />
Amounts from this source have increased<br />
since 2010 after the 7th National Finance<br />
Commission (NFC) Award revised the share<br />
of provinces upto 57.5 per cent.<br />
The 7th NFC marked the departure from a<br />
population-centric to a multi-criteria<br />
formula for funds transfer. Under this<br />
Award, which continues to be applied,<br />
population retains a significant weightage<br />
of 82 per cent, but new variables are<br />
added, i.e., 10.3 per cent for poverty, 5 per<br />
cent for revenue generation and 2.7 per<br />
cent for geographical area.<br />
Despite increased amounts, Khyber<br />
Pakhtunkhwa has consistently received<br />
less than its projected share of federal<br />
transfers. In FY2017-18, against a<br />
projected share of Rs.365.2 billion, the<br />
province received Rs.339.4 billion, i.e., a<br />
shortfall of 7.1 per cent. This was much<br />
reduced from the shortfall of 14 per cent in<br />
FY2012-13 when Rs.176.9 billion was<br />
transferred against a projected share of<br />
Rs.205.7 billion.<br />
2
Revenue estimates are also affected by<br />
Khyber Pakhtunkhwa’s inability to meet<br />
provincial collection targets. A review of the<br />
period FY2009-10 to FY2017-18 shows<br />
fluctuating collections, with significant<br />
shortfalls from targeted amounts since<br />
FY2014-15. Peak shortfall of 53.5 per cent<br />
was recorded in FY2015-16, reducing to 31.4<br />
per cent in FY2017-18.<br />
Revenue earned by Khyber Pakhtunkhwa as<br />
compensation for its role in the war on<br />
terror is more stable. Against an estimate of<br />
Rs.39.17 billion, revised figures for<br />
FY2017-18 show receipt of Rs.38.43 billion<br />
under this category. Estimated figures for<br />
FY2018-19 show an increase of 12.7 per<br />
cent, i.e., Rs.43.3 billion from estimates in<br />
the preceding year.<br />
Provincial Revenue Targets & Collection<br />
FY<br />
Budget Actual<br />
Figures in Rs. Million<br />
Variance<br />
Amount %<br />
2009-10<br />
7,537<br />
6,414<br />
(1,123)<br />
(14.9)<br />
2010-11<br />
7,232<br />
8,829<br />
1,597<br />
22<br />
2011-12<br />
9,464<br />
10,057<br />
593<br />
6.26<br />
2012-13<br />
10,215<br />
11,720<br />
1,505<br />
14.7<br />
2013-14<br />
16,921<br />
20,011<br />
3,090<br />
18.3<br />
2014-15<br />
28,781<br />
22,706<br />
(6,075)<br />
(21.1)<br />
2015-16<br />
54,425<br />
25,576<br />
(28,849)<br />
(53)<br />
2016-17<br />
49,507<br />
28,347<br />
(21,160)<br />
(42.7)<br />
2017-18<br />
45,215<br />
31,021<br />
(14,194)<br />
(31.4)<br />
Source: White Paper 2018-19, Government of Khyber Pakhtunkhwa<br />
3
In FY2018-19, Swat emerged as the district<br />
to receive the highest allocation of<br />
development funds, Rs.4.06 billion. Swabi<br />
followed with Rs.2.57 billion, and,<br />
Nowshera was third in line with Rs.2.41<br />
billion. The cumulative amount for these<br />
power districts is Rs.9.04 billion. It is more<br />
than half of Rs.4.35 billion allocated to<br />
Hazara’s six districts, and, 41.37 per cent<br />
more than Rs.5.30 billion allocated to the<br />
seven chronically poor southern districts<br />
of the province.<br />
The rationale for allocating development<br />
funds to each district is unclear. If<br />
population is a key determinant, then the<br />
comparison of per capita allocations<br />
compounds confusion. In per capita terms,<br />
Swat received Rs.1,758, Nowshera<br />
Rs.1,590 and Swabi Rs.1,585. In contrast,<br />
per capita allocation for Tank was only<br />
Rs.190.81. In other words, the government<br />
spent 8-9 times more on citizens living in<br />
Swat, Nowshera or Swabi than the person<br />
residing in Tank.<br />
Districts &<br />
Development<br />
Trends over the period FY2013-14 to<br />
FY2018-19 reconfirm dominant allocations to:<br />
Nowshera Rs.23.74 billion<br />
Swat Rs.20.08 billion<br />
Swabi Rs.14.30 billion<br />
The sum allocated to these three districts<br />
is Rs.58.13 billion, which is 47 per cent<br />
more than the total development funds of<br />
Rs.30.78 billion given to the province’s<br />
seven chronically poor southern districts.<br />
The six districts of Hazara received<br />
Rs.33.26 billion or 42 per cent less than<br />
amounts given to Nowshera, Swat and<br />
Swabi.<br />
In FY2018-19, funds<br />
provided for eight people<br />
in Tank were equal to that<br />
given for one person in<br />
Nowshera.<br />
4
Nowshera<br />
Swat<br />
Swabi<br />
Mardan<br />
D I Khan<br />
Haripur<br />
Charsadda<br />
Abbottabad<br />
Torghar<br />
Lower Dir<br />
Malakand<br />
Kohat<br />
Upper Dir<br />
Bannu<br />
Chitral<br />
Buner<br />
Hangu<br />
Mansehra<br />
Karak<br />
Shangla<br />
Kohistan<br />
Lakki Marwat<br />
Battagram<br />
Tank<br />
Rs.10.38<br />
Rs.10.21<br />
Rs.8.39 Billion<br />
Rs.8.17 Billion<br />
Rs.7.97 Billion<br />
Rs.6.47 Billion<br />
Rs.6.33 Billion<br />
Rs.6.31 Billion<br />
Rs.5.46 Billion<br />
Rs.5.32 Billion<br />
Rs.5.22 Billion<br />
Rs.4.27 Billion<br />
Rs.3.29 Billion<br />
Rs.3.17 Billion<br />
Rs.3.10 Billion<br />
Rs.2.56 Billion<br />
Rs.2.45 Billion<br />
Rs.1.40 Billion<br />
Rs.1.06 Billion<br />
Rs.0.99 Billion<br />
5
Rs. 23.75 Billion Rs.23.75 Billion<br />
Rs. 20.08 Billion Rs.20.08 Billion<br />
0 Billion Rs.14.30 Billion<br />
Billion Rs.13.97 Billion<br />
Billion<br />
Billion<br />
District-wise<br />
aggregate allocation<br />
for development<br />
over the period<br />
FY2013-14 to FY2018-19<br />
*all districts of KP except urban Peshawar<br />
From FY2013-14 to FY2018-19, among the<br />
seven southern districts, Tank received the<br />
lowest amount, i.e., Rs.0.99 billion<br />
followed by Lakki Marwat’s Rs.1.4 billion.<br />
Dera Ismail Khan fared better with an<br />
allocation of Rs.10.38 billion and Kohat<br />
received Rs.6.3 billion.<br />
In Hazara, Haripur ruled the roost with an<br />
aggregate allocation of Rs.10.2 billion<br />
followed by Abbottabad’s Rs.8.17 billion.<br />
Trailing at the bottom of the pile are<br />
Kohistan with Rs.2.45 billion and<br />
Battagram receiving Rs.1.06 billion in the<br />
period FY2013-14 to FY2018-19.<br />
6
Social Accountability<br />
actions & mechanisms<br />
by citizens & CSOs<br />
to hold public officials,<br />
service providers<br />
to account<br />
7
Priorities:<br />
government, people<br />
In FY2018-19, transport and road feature<br />
as dominant sectors with total allocations<br />
of Rs.39.25 billion and Rs.14.62 billion,<br />
together accounting for 29.93 per cent or<br />
about one-third of the total development<br />
budget of Rs.180 billion. Does this<br />
emphasis sync with people’s priorities?<br />
Omar Asghar Khan Foundation’s work in<br />
Khyber Pakhtunkhwa’s 13 districts has<br />
identified lack of clean drinking water,<br />
absence of basic facilities in schools and<br />
poor healthcare services as people’s key<br />
concerns.<br />
This dataset does not claim to present<br />
statistically valid comparisons between<br />
government and public priorities.<br />
However, it provides interesting snapshots<br />
of people’s needs.<br />
Hangu<br />
Chitral<br />
Upper Dir<br />
Kohistan<br />
Lower Dir<br />
Batagram<br />
Mansehra<br />
Malakand Buner<br />
Torghar<br />
Mardan<br />
Charsada<br />
Abbottabad<br />
Peshawar Swabi<br />
Haripur<br />
Nowshera<br />
Kohat<br />
Karak<br />
Tank<br />
Bannu<br />
DI Khan<br />
Lakki<br />
Marwat<br />
The Foundation is helping<br />
more than 120 CSOs<br />
in KP’s Hazara, Malakand, Central<br />
& Southern regions to use<br />
social accountability for improving<br />
the delivery of public services.<br />
8
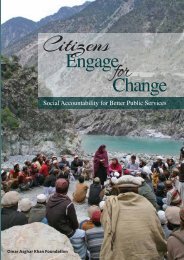
Tale of two schools<br />
Nestled in the mountains of District<br />
Abbottabad lies the small village of Dowatta.<br />
Its primary school for girls was damaged by<br />
the 2005 earthquake. The surviving structure<br />
was torn down in 2008, with the promise to<br />
build back better. More than ten years later,<br />
around 2017, a contractor finally started<br />
rebuilding the school but abandoned<br />
construction before making much headway.<br />
In March 2016, the Khyber Pakhtunkhwa’s<br />
government committed Rs.8 billion to<br />
reconstructing 760 schools destroyed by the<br />
2005 earthquake. Work is in process, but<br />
moving glacially with only Rs.1.37 billion or<br />
17.12 per cent expended as of June 2018. In<br />
FY2018-19 a further Rs.0.35 billion is allocated<br />
– but these funds have not yet made their way<br />
to Dowatta where its young schoolgirls<br />
continue attending classes in makeshift<br />
schools.<br />
A similar story, but with a happier ending is of<br />
the government primary school in village<br />
Kolay of Battagram. Jolted by the 2005<br />
earthquake, its partially damaged structure<br />
was also razed to the ground in 2006.<br />
Reconstruction started in 2010 but was<br />
abandoned before completion. It restarted in<br />
2017 and the school was reconstructed by<br />
early 2018. Its smaller design is compliant with<br />
ERRA’s specifications. Additional funds from<br />
the local PTC helped add a boundary wall and<br />
toilet.<br />
9
….not a drop of water to drink<br />
About 800 households live in Village Takht-e-Nasrati of<br />
District Karak. According to local people a gravity-flow<br />
scheme, constructed before Independence in 1947, is the<br />
key source of drinking water. Over the years, its supply is<br />
unable to meet the needs of a growing population, leaving<br />
about 300 households with severely limited access to<br />
drinking water. In FY2018-19 the provincial government has<br />
allocated Rs.35 million for drinking water to the district. This<br />
accounts for only 1.02 per cent of the total amount of<br />
Rs.3.43 billion allocated for drinking water in the province.<br />
10
89.1 %<br />
1.8%<br />
Education<br />
Rs.4.53 billion<br />
0.7%<br />
Agriculture<br />
Rs.0.04 billion<br />
Social<br />
Welfare<br />
Rs.0.09 billion<br />
0.2%<br />
Science,<br />
Tech & IT<br />
Rs.0.01 billion<br />
Pro-Women<br />
Funds<br />
Rs.5.08 Billion<br />
FY2018 -19<br />
0.1%<br />
7 %<br />
Healthcare<br />
Rs.0.36 billion<br />
0.4%<br />
Industry<br />
Rs.0.024 billion<br />
Sports &<br />
Tourism<br />
Rs.0.005 billion<br />
11
Pro-Women Funds<br />
Only Rs.5.08 billion can be identified as<br />
pro-women funds in FY2018-19. This is<br />
less than half of the Rs.12.70 billion<br />
allocated in the preceding year. This year’s<br />
allocation is about 2.82 per cent of the<br />
total development budget, whereas last<br />
year it was 6.11 per cent.<br />
Of the Rs.5.08 billion allocated this year,<br />
education has received the lion’s share --<br />
89.1 per cent. In percentage terms it has<br />
received more than the preceding year’s<br />
63 per cent. But in absolute terms, the<br />
preceding year’s Rs.8 billion is about<br />
double than the current year’s Rs.4.53<br />
billion. Similarly, healthcare received<br />
Rs.4.2 billion in FY2017-18 which is about<br />
12 times more than Rs.0.36 billion<br />
allocated this year.<br />
The absence of<br />
sex-disaggregated<br />
budgets challenge<br />
efforts to estimate<br />
pro-women funds.<br />
FY2018 -19: 2.82%<br />
FY 2017-18: 6.11%<br />
12
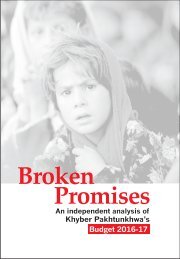
Women are not treated as<br />
equal councillors. They are<br />
denied development funds.<br />
Member, Tehsil Council,<br />
Haripur<br />
Elected councillors discuss local government in Khyber Pakhtunkhwa<br />
at a consultation organized by the Foundation, December 2018<br />
The current local<br />
government is good. More<br />
funds are available than in<br />
earlier LG structures.<br />
Member, Village Council,<br />
Abbottabad<br />
13
Fiscal decentralization<br />
Khyber Pakhtunkhwa’s Local Government<br />
Act 2013 stipulates allocating not less than<br />
30 per cent of total development funds to<br />
local governments.<br />
Since it became functional in September<br />
2015, funds allocated for local government<br />
have hovered around the 30 per cent<br />
threshold. However, in absolute terms,<br />
amounts transferred to local governments<br />
are reducing.<br />
Rs.48.54<br />
Billion<br />
Rs.43.32<br />
Billion<br />
Rs.36.46<br />
Billion<br />
Rs.34.17<br />
Billion<br />
2015-16 2016-17 2017-18 2018-19<br />
Also, budget estimates often differ from<br />
actual amounts transferred. In FY2017-18,<br />
for example, the total allocation of Rs.36.46<br />
billion included Rs.28 billion which was<br />
subsequently revised to Rs.10.94 billion.<br />
Elected councillors commend the availability<br />
of funds to different local government tiers.<br />
However, some criticize constraints in<br />
deciding priorities. Women and others<br />
elected on reserved seats also complain of<br />
discrimination.<br />
14
15<br />
Block funds<br />
compromise<br />
transparency & make<br />
it difficult to hold<br />
government to<br />
account.
Block funds<br />
60.02 per cent of total development funds for<br />
FY2018-19 are retained in block funds. In the<br />
period FY2013-14 to FY2018-19, block funds<br />
have consistently accounted for more than half<br />
of the total development budget. Block<br />
allocations peaked at 73.56 per cent in<br />
FY2016-17, and dropped to the lowest of 54.69<br />
per cent in FY2017-18.<br />
67.4%<br />
67.5%<br />
71.1%<br />
73.6%<br />
54.7%<br />
60 %<br />
Rs.119 Billion<br />
Rs.80.13 Billion<br />
Rs.139.8 Billion<br />
Rs.94.31 Billion<br />
Rs.174.88 Billion<br />
Rs.124.29 Billion<br />
Rs.161 Billion<br />
Rs.118.42 Billion<br />
Rs.208 Billion<br />
Rs.113.76 Billion<br />
Rs.180 Billion<br />
Rs.108.03 Billion<br />
2013-14 2014-15 2015-16 2016-17 2017-18 2018-19<br />
Total Development Budget<br />
Block Fund<br />
Block or umbrella funds are allocations made<br />
to sectors like education, health, etc.,<br />
without specifying their intended location,<br />
giving politicians and bureaucrats<br />
tremendous discretion to move funds<br />
around within the purpose stated for the<br />
block.<br />
16
Recommendations<br />
Establish credible and effective mechanisms for<br />
capturing a range of public perspectives on public<br />
finance priorities.<br />
Provide sex-disaggregated budget data.<br />
Devise a Provincial Finance Commission (PFC) Award<br />
for fair and transparent allocation of development<br />
funds to each district.<br />
Ensure not less than 30 per cent development funds<br />
are provided to local governments and that all<br />
councillors are given equitable access to them.<br />
Promote transparency by reducing block funds until<br />
they are effectively minimized or eliminated.<br />
Improve fiscal discipline, with better predictability of<br />
revenue & budget execution.<br />
17
December 2018<br />
18