Pasadenas-Tale-of-Two-Cities-2019

Create successful ePaper yourself
Turn your PDF publications into a flip-book with our unique Google optimized e-Paper software.
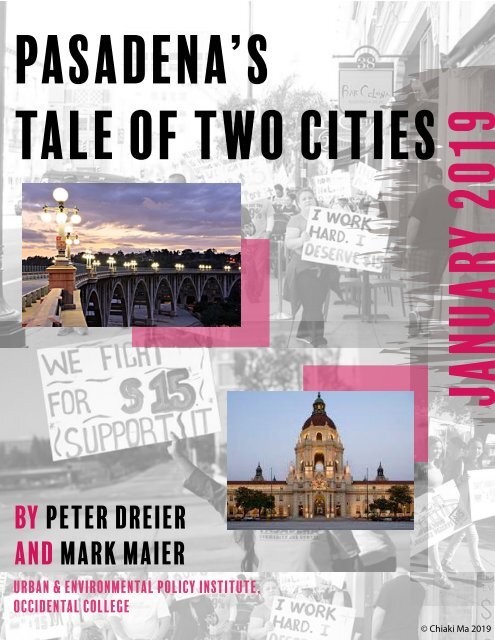
PASADENA’S<br />
TALE OF TWO CITIES<br />
JANUARY <strong>2019</strong><br />
BY PETER DREIER<br />
AND MARK MAIER<br />
Urban & environmental policy institute,<br />
occidental college<br />
© Chiaki Ma <strong>2019</strong>
ABOUT THE AUTHORS<br />
Dr. Peter Dreier is E.P. Clapp Distinguished Pr<strong>of</strong>essor <strong>of</strong> Politics and founding chair<br />
<strong>of</strong> the Urban & Environmental Policy Department at Occidental College. He is<br />
coauthor <strong>of</strong> “Place Matters: Metropolitics for the 21st Century” and “The Next Los<br />
Angeles: The Struggle for a Livable City.”<br />
Dr. Mark Maier is pr<strong>of</strong>essor <strong>of</strong> economics at Glendale Community College and is<br />
the coauthor <strong>of</strong> “Introducing Economics” and “The Data Game: Controversies in<br />
Social Science Statistics.” Both <strong>of</strong> them live in Pasadena.<br />
We’d like to acknowledge the help <strong>of</strong> Chiaki Ma, an Occidental College student, for<br />
her research assistance.<br />
1
INTRODUCTION<br />
Pasadena has a well-deserved reputation as a “livable” city. But the question must be asked:<br />
Livable for whom?<br />
Pasadena has become one <strong>of</strong> California’s most unequal cities. It welcomes affluent residents,<br />
while poor families and even many middle-class households can barely make ends meet. Many<br />
families have been pushed out <strong>of</strong> Pasadena by the combination <strong>of</strong> low incomes and rising<br />
housing prices. The city is now characterized by a widening income gulf, low wages for many,<br />
and high rents. That’s the troublesome reality as documented by the latest U.S. Census figures<br />
and other data.<br />
This harsh reality is not simply the result <strong>of</strong> inevitable economic forces. Decisions made in City<br />
Hall — particularly about jobs and housing — contribute to Pasadena’s widening income gap<br />
and the hardships encountered by a significant number <strong>of</strong> families.<br />
Pasadena is one <strong>of</strong> America’s best-known cities. Its reputation is due in large part to the annual<br />
Tournament <strong>of</strong> Roses parade, the Rose Bowl (including the annual football game as well as other<br />
events held in that iconic structure), its arts-and-crafts bungalow houses, its commitment to<br />
historic preservation, and its thriving downtown commercial center. It is home to many world-class<br />
institutions, including the Art Center College <strong>of</strong> Design, the Pasadena Playhouse, the Huntington<br />
Library, the Norton Simon Museum, and the California Institute <strong>of</strong> Technology, which has fostered<br />
several major engineering and science-oriented corporations. All this gives Pasadena a welldeserved<br />
reputation for prosperity.<br />
But there’s a big disconnect between the city’s image and its reality. Pasadena is indeed<br />
prosperous, but its prosperity is not widely shared. Less than half a mile from where the<br />
Tournament <strong>of</strong> Roses parade route begins, near Millionaires Row, Pasadena becomes a city <strong>of</strong> lowwage<br />
workers, predominantly Latino and Black. In this city <strong>of</strong> 140,000 people, tens <strong>of</strong> thousands<br />
<strong>of</strong> workers and families struggle to meet their basic needs.<br />
2
As tourists spend their money in Pasadena’s hotels, restaurants, stores, and rental car agencies, they<br />
probably don’t realize that most <strong>of</strong> the hotel housekeepers, waiters and waitresses, kitchen workers,<br />
retail clerks, and janitors don’t earn enough to make ends meet. If they don’t wander <strong>of</strong>f the<br />
parade route or travel to the residential areas not far from the Rose Bowl, they won’t see the small<br />
homes and apartment buildings that house the other part <strong>of</strong> Pasadena. We have reported twice<br />
before on Pasadena’s <strong>Tale</strong> <strong>of</strong> <strong>Two</strong> <strong>Cities</strong>, most recently in 2014. We have written this new<br />
report to update the facts that can help inform and guide public discussion and government<br />
policy.<br />
Our investigation led to three conclusions:<br />
First, Pasadena remains a city characterized by a wide economic divide. Pasadena ranks second<br />
among California’s 50 largest cities in terms <strong>of</strong> the concentration <strong>of</strong> income among the<br />
wealthiest residents and the gap between the richest and poorest households. For example, the<br />
average income <strong>of</strong> the richest five percent <strong>of</strong> Pasadena households ($547,864) is more than 45<br />
times greater than the average income <strong>of</strong> the poorest 20 percent <strong>of</strong> households ($12,153).<br />
Second, the economic chasm has widened since we wrote our earlier reports. The percentage <strong>of</strong><br />
low-income households remains the same, while the percentage <strong>of</strong> households with incomes over<br />
$200,000 increased. This trend results in a hollowed out middle class. The Pasadena City<br />
Council’s decision to adopt a municipal minimum wage (currently $13.25 for employees <strong>of</strong><br />
businesses with 26 or more employees and $12 for employees <strong>of</strong> other businesses) has helped<br />
improve the lives <strong>of</strong> thousands <strong>of</strong> Pasadena workers and their families, but it still remains far<br />
below what is needed to make ends meet. In February this year, the Pasadena City Council will<br />
vote whether to freeze the minimum wage at its current level or continue, like Los Angeles and<br />
Altadena, on the path to $15/hour by July 2020 (for businesses with over 25 employees) and by<br />
July 2021 (for all other businesses).<br />
Third, Pasadena is becoming more and more expensive to live in. City policies are fueling<br />
gentrification, making it harder for low-income and middle-class families to live here. Housing<br />
costs – for single-family homes, condominiums, and apartments – have skyrocketed. Pasadena is<br />
now one <strong>of</strong> the most expensive cities in California.<br />
3
INEQUALITY<br />
Almost a decade ago, the Occupy Wall Street movement popularized the phrase “the 1 percent<br />
vs. the 99 percent” to characterize America’s widening economic divide and the growing<br />
influence <strong>of</strong> Wall Street and big business in our political system. Indeed, nation’s super-rich have<br />
gained a growing share <strong>of</strong> the nation’s wealth. Recent studies show that the top 10 percent <strong>of</strong><br />
households garner over 78 percent <strong>of</strong> the country’s wealth and that the top 1/1000 <strong>of</strong> households<br />
has over 15 percent <strong>of</strong> the wealth, a higher percentage than in 1983. 1<br />
In some ways, Pasadena is a prosperous city. In 2017 the city’s average household income was<br />
$109,871. Among California’s 50 largest cities, Pasadena ranks tenth that category, as shown in<br />
Table 1. That means that, on average, Pasadena residents have more money to spend in local<br />
stores, restaurants, and other businesses than their counterparts in most other cities. Because<br />
Pasadena is also a major tourist destination, much <strong>of</strong> the money spent in the local economy<br />
comes from people visiting the city.<br />
The average household income reveals the size <strong>of</strong> a city’s overall economic pie, but it doesn’t<br />
reveal anything about how that pie is divided.<br />
We have utilized several standard ways to measure inequality in Pasadena.<br />
The first is to look at the concentration <strong>of</strong> income among the rich — how the economic pie is<br />
divided. In 2013-2017, the richest five percent <strong>of</strong> Pasadena households — those with incomes<br />
over $250,000-- had almost one-quarter (24.93 percent) <strong>of</strong> the income earned by city residents.<br />
1<br />
Edward Wolff, Household Wealth Trends in the United States, 1962 to 2016: Has Middle Class Wealth<br />
Recovered? Cambridge, MA: National Bureau <strong>of</strong> Economic Research, November 2018.<br />
4
On this measure, Pasadena ranks second among California’s 50 largest cities, behind Los<br />
Angeles (27.06 percent) (See Table 2). 2<br />
The richest 20 percent Pasadena households — those with household incomes above $156,810 --<br />
have over half (53.61 percent) <strong>of</strong> city residents’ total income. On this measure, too, only Los<br />
Angeles has a higher concentration <strong>of</strong> income among the richest twenty percent. (See Table 3)<br />
In contrast, the poorest one-fifth <strong>of</strong> Pasadena households -- those with incomes below $26,059<br />
— combined have only 2.22 percent <strong>of</strong> all residents’ income. As Table 3 reveals, in California<br />
only in San Francisco and Lancaster do poor households have a smaller share <strong>of</strong> citywide<br />
income. Pasadena is even more unequal than the country and California.<br />
Another standard way to measure inequality is to consider the gap between the rich and poor. To<br />
do this, we compared the average income <strong>of</strong> households at the top (the richest five percent <strong>of</strong><br />
households) with the average income <strong>of</strong> those at the bottom (the poorest 20 percent <strong>of</strong><br />
households).<br />
In Pasadena, the average income <strong>of</strong> the richest five percent <strong>of</strong> households ($547,864) is more<br />
than 45 times greater than the average income <strong>of</strong> the poorest 20 percent <strong>of</strong> households ($12,153).<br />
Only San Francisco has a wider rich-poor gap (See Table 4).<br />
When we compare the gap between the richest 20 percent and the poorest 20 percent, Pasadena<br />
is, once again, nearly the most unequal California city. The average income <strong>of</strong> the richest 20<br />
percent <strong>of</strong> Pasadena households ($294,533) is 24 times greater than the average income <strong>of</strong> the<br />
poorest 20 percent ($12,153). On this measure, only San Francisco and Lancaster outdo<br />
Pasadena as California’s capital <strong>of</strong> inequality (See Table 5).<br />
2<br />
In these tables, we use data from the U.S. Census Bureau’s American Community Survey 2013-2017 5-<br />
year estimates. The data be found on the American FactFinder page <strong>of</strong> the U.S. Census Bureau website.<br />
5
MAKING ENDS MEET IN<br />
PASADENA<br />
Many Pasadena families do not earn enough to make ends meet. The number <strong>of</strong> Pasadena<br />
households surviving on a low income, less than $25,000 per year, stayed the same between<br />
2013 and 2017. (The city’s minimum wage law began on July 1, 2016). About 10,000 Pasadena<br />
households, 19 percent <strong>of</strong> the total, get by on incomes below $25,000 (See Table 6). The $25,000<br />
threshold does not adjust for five percent inflation since 2013, so in actual buying power poor<br />
households are doing worse.<br />
The story at the top end is quite different. Over the five-year period between 2013 and 2017, the<br />
number <strong>of</strong> households with incomes over $200,000 jumped by nearly 1,000, so that they now<br />
comprise one in eight Pasadena households. The percentage <strong>of</strong> these affluent families in<br />
Pasadena is almost double the national rate <strong>of</strong> 6.3 percent.<br />
With the percentage <strong>of</strong> low-income households staying the same and percentage <strong>of</strong> affluent<br />
households rising, it isn’t surprising that the middle-income group shrank. Between 2013 and<br />
2017 those with incomes between $25,000 and $100,000 per year fell from 45.9 percent to 42.6<br />
percent <strong>of</strong> Pasadena households. The next highest group, households with incomes $100,000 to<br />
$200,000 increased by 1.5 percent <strong>of</strong> the total.<br />
A recent report by the California Budget and Policy Center examined the economic challenges<br />
faced by many Californians by showing the monthly and annual cost <strong>of</strong> supporting a family or a<br />
single individual in different parts <strong>of</strong> the state. Its analysis presented basic family budgets for<br />
each <strong>of</strong> California’s 58 counties for four types <strong>of</strong> households: a single adult, a single-parent<br />
family, a two-parent family with one parent working, and a two-working-parent family. (All<br />
6
family types except single adult are assumed to have one preschool-aged child and one schoolaged<br />
child). These family budgets estimate the amount <strong>of</strong> income that households need to cover<br />
basic expenses.<br />
In Los Angeles County, a family with two income earners and two children needs an annual<br />
household income <strong>of</strong> $74,679 to make ends meet. A family with two parents, one <strong>of</strong> whom<br />
works, and two children, needs to earn $59,338 a year to make ends meet. A single-parent<br />
family with two children needs to earn $65,865 a year to make ends meet (because child care<br />
costs are higher for a single parent than a two-parent family where one parent is not working). A<br />
single adult needs to make $29,217 to make ends meet. 3 The report identifies the specific costs<br />
<strong>of</strong> the major items in household budgets – housing and utilities, food, child care, health care,<br />
transportation, taxes, and miscellaneous.<br />
Because <strong>of</strong> high housing costs (discussed below), the cost <strong>of</strong> living in Pasadena is higher than in<br />
most other Los Angeles County cities. For example, the budgets calculated by the California<br />
Budget and Policy Center for Los Angeles County assumes that households pay $1,545 for<br />
housing and utilities. Housing costs in Pasadena are considerably higher. As a result, few<br />
Pasadena households earn enough to make ends meet based on the California Budget and Policy<br />
Center calculations.<br />
3<br />
Sara Kimberlin and Amy Rose, “Making Ends Meet: How Much Does It Cost to Support a Family in<br />
California?” California Budget and Policy Center, December 2017.<br />
https://calbudgetcenter.org/resources/making-ends-meet-much-cost-support-family-california/<br />
7
WAGES<br />
One-third <strong>of</strong> Pasadena workers earn less than $15 per hour. That percentage is unchanged since<br />
our last report five years ago. Because there are more employees in Pasadena, the number <strong>of</strong><br />
these low wage workers increased slightly to 23,117. (See Table 7) As in the past, most low<br />
wage earners, 59 percent, work full time and full year, and another 26 percent work part-time<br />
and full year. Thus, the stereotype <strong>of</strong> a minimum wage worker as a summer employed teenager is<br />
entirely misleading.<br />
The new data show that low wage workers are concentrated in a few sectors: food services,<br />
accommodations such as motels and hotels, health care, education services (primarily early<br />
childhood), retail trade, and construction (See Table 8). Since our last report, the greatest<br />
increases in low wage employment have occurred in the construction, retail trade, and food<br />
services sectors.<br />
More than half the workers within the hotel, motel, food service and retail trade sectors earn low<br />
wages. Health care and education have large numbers <strong>of</strong> low wage workers, although not<br />
surprisingly, in those industries a majority earns more than $15 per hour.<br />
These <strong>of</strong>ficial government data underestimate the number <strong>of</strong> low-wage workers because they<br />
omit some workers in the informal economy such as day laborers, home care workers, and<br />
gardeners, who are not completely counted in the U.S. Census Bureau surveys.<br />
Pasadena low wage workers are concentrated in sectors that cannot easily leave to avoid higher<br />
wages. Unlike clothing factories, for example, hotels, restaurants, retail shops, day care centers,<br />
and construction are local businesses that are tied to the Pasadena economy. They cannot easily<br />
relocate to Asia, Mexico, or Alabama. In fact, the attractiveness <strong>of</strong> doing business in Pasadena –<br />
and taking advantage <strong>of</strong> its amenities, the concentration <strong>of</strong> hotels and restaurants, its shopping<br />
districts, and other factors -- means that most local businesses prefer locating in Pasadena over<br />
even adjacent cities and suburbs. This makes it easier for Pasadena to maintain its current<br />
8
minimum wage in line with Los Angeles City and County and for Pasadena businesses to absorb<br />
gradual increases in the minimum wage.<br />
In public debate, some restaurant owners have taken the lead in opposing the minimum wage.<br />
Around the country, restaurants experience high turnover, but not because they provide high<br />
wages, but because <strong>of</strong> poor management, changing consumer tastes, competition from other<br />
eateries, and rising commercial rents. Indeed, nationwide about 60 percent <strong>of</strong> restaurants fold<br />
within three years <strong>of</strong> openings – more <strong>of</strong>ten than other business. 4 As far as Pasadena finances<br />
go, restaurants are not one <strong>of</strong> the city’s major industry sectors. Restaurants account for about 19<br />
percent <strong>of</strong> total city sales tax revenue, less than the revenue collected from consumer goods<br />
purchases and from automobile related purchases. 5<br />
4<br />
H.G. Para, John T. Self, David Njite, and Tiffany, King, “Why Restaurants Fail,” Cornell Hotel and<br />
Restaurant Administration Quarterly, Volume 46, Number 3, August 2005.<br />
https://daniels.du.edu/assets/research-hg-parsa-part-1-2015.pdf<br />
5<br />
https://www.city<strong>of</strong>pasadena.net/wp-content/uploads/sites/27/Sales-Tax-3rd-Qtr-2016-City-<strong>of</strong>-<br />
Pasadena.pdf<br />
9
HOUSING<br />
Pasadena is an expensive place to live, primarily because <strong>of</strong> skyrocketing housing prices and rents.<br />
People who have owned their houses for many years have seen dramatic appreciation in the value<br />
<strong>of</strong> their homes, even those who have done little or nothing to improve the physical condition <strong>of</strong> the<br />
house and yard. The median price <strong>of</strong> a single-family in Pasadena increased from $680,000 in<br />
2013 to $960,000 in 2018, an increase <strong>of</strong> 41.2 percent. During that same period,<br />
the average price <strong>of</strong> a single-family home increased from $919,599 to $1,239,966, a 34.8 percent<br />
increase, according to CoreLogic.<br />
Pasadenans still aspire to own their own homes, but the cost is out <strong>of</strong> reach for most <strong>of</strong> them.<br />
Among households with incomes below $35,000, only 22.5 percent own their homes. Among<br />
households with incomes between $35,000 and $99,999, 35.6 percent own their homes. Among<br />
households with incomes <strong>of</strong> $100,000 or more, 65.3 percent own their homes. (See Table 14).<br />
Many current homeowners who purchased their homes a decade or more ago could not afford to<br />
buy the same home today. The median household income <strong>of</strong> Pasadena renters is $55,752 compared<br />
with $115,074 for homeowners, as shown in Table 13.<br />
The housing developments approved by the City have exacerbated this situation. Most housing<br />
developments approved by the City Council since 2002 are luxury condos and expensive<br />
apartments targeted for high-income residents. According to city data, only 18 percent <strong>of</strong> the 5,311<br />
new housing units are within reach <strong>of</strong> low-income and moderate-income families. For example, in<br />
the new 201-unit Avila apartment complex on Walnut Street, 171 units are market rate. Rents for<br />
two-bedroom apartments range from $3,641 to $4,111 a month.<br />
It will surprise no one that Pasadena housing costs are on the rise. But the impact<br />
disproportionately affects the two <strong>Pasadenas</strong>.<br />
10
Renters make up a majority-- over 56 percent-- <strong>of</strong> Pasadena households, and their plight is<br />
particularly insecure. In the past five years, the median rent for a two-bedroom apartment has<br />
increased from $2,200 to $2,900, according to Zillow. That amounts to a 31.8 percent increase,<br />
much, much faster than increases in incomes, especially for the bottom one-third <strong>of</strong> Pasadena<br />
households (See Table 9). A family needs to earn $115,750 a year to pay a $2,900 monthly rent<br />
without spending over 30 percent <strong>of</strong> its income – the rule-<strong>of</strong>-thumb among housing experts. More<br />
than half (52 percent) <strong>of</strong> all Pasadena renters pay over 30 percent <strong>of</strong> household incomes just to<br />
keep a ro<strong>of</strong> over their heads, as shown in Table 10. More than one-third <strong>of</strong> Pasadena’s renter<br />
households have incomes below $35,000/year. High rents hit these households particularly hard.<br />
A whopping 95 percent <strong>of</strong> those with household incomes under $35,000 spend more than 30<br />
percent <strong>of</strong> their incomes on housing (See Table 10).<br />
Among renters who earn less than $15 per hour, housing is a tremendous burden. An astonishing<br />
31 percent <strong>of</strong> renters in this group pay over one-half <strong>of</strong> their earnings in rent and 62 percent pay<br />
more than the recommended 30 percent level. (See Table 11) Moreover, 20 percent <strong>of</strong> families<br />
with wage-earners earning below $15/hour live in overcrowded conditions, with six percent<br />
living in severely overcrowded situations, defined as more than one and one-half people per<br />
room. (See Table 12)<br />
Homeowners feel the squeeze, too. Among homeowners with household incomes under $35,000,<br />
83.5 percent spend more than 30 percent <strong>of</strong> their incomes on housing. Among those with<br />
household incomes between $35,000 and $49,999, 62.7 percent spend more than 30 percent <strong>of</strong><br />
their incomes on housing (See Table 10).<br />
11
CONCLUSIONS AND<br />
RECOMMENDATIONS<br />
Pasadenans justifiably take pride in Caltech, the Rose Bowl, our museums and theaters, and our<br />
other world-class institutions. But some <strong>of</strong> our business, civic, and political leaders don’t seem to<br />
prioritize the needs <strong>of</strong> the city’s low-income and working-class residents who are the backbone<br />
<strong>of</strong> the Pasadena economy.<br />
Many <strong>of</strong> Pasadena’s businesses, including its hotels and other parts <strong>of</strong> the tourism economy, are<br />
thriving, but that prosperity is not “trickling down” to the city’s low-income and working class<br />
residents.<br />
In an astonishing turnaround, cities and states across the country have embraced minimum wages<br />
significantly higher than the national $7.25/hour rate. Pasadena was among the first, following<br />
the lead <strong>of</strong> Los Angeles, and then later Los Angeles County (for unincorporated areas, including<br />
Altadena), to adopt local laws raising the minimum wage. All three jurisdictions adopted laws<br />
intending to gradually increase the minimum wage to $15/hour by 2020 for employers with 26 or<br />
more employees and by 2021 for all other employers. However, the Pasadena City Council<br />
adopted a unique law that calls for a pause in <strong>2019</strong>. The City minimum wage will stay stuck at<br />
its current $12/hour (for small businesses) and $13.25/hour (for others) unless the Pasadena City<br />
Council votes in February to stay on the same schedule as Los Angeles City and Los Angeles<br />
County.<br />
All signs suggest that the economic recovery since the 2008- 2009 recession has boosted<br />
employment and business prospects. Most importantly it has put dollars in the wallets <strong>of</strong> lowincome<br />
earners, improving their living standards and adding to consumer spending in Pasadena.<br />
The impact is across the region as Pasadena residents gain from the higher minimum wage in<br />
neighboring Los Angeles and Altadena. At the same time, residents in those jurisdictions<br />
12
(especially those who work in Pasadena) spend their higher income in Pasadena.<br />
Thus it is important that Pasadena stay on the same track to $15/hour as Los Angeles and<br />
Altadena. Falling behind our neighbors will not only hurt Pasadena workers but also will lead to<br />
confusion if employers have different minimum pay mandates across the Pasadena-LA and<br />
Pasadena-Altadena borders.<br />
Equally important is enforcement. Currently Pasadena has a small contract with the Pasadena<br />
Community Job Center to inform businesses and employers about their responsibilities and rights<br />
regarding the new minimum wage. This outreach effort has revealed widespread ignorance about<br />
pay rules, cases <strong>of</strong> wage theft through unpaid hours <strong>of</strong> work, and even kickbacks to employers<br />
(particularly for vulnerable immigrant workers).<br />
The fact that so many Pasadenans spend so much <strong>of</strong> their incomes on housing places a burden on<br />
many families. But it also hurts the local business community. When families spend so much <strong>of</strong><br />
their incomes on housing, they have less to spend on food, clothing, dry cleaning, household<br />
items, movies, and other goods and services, which hurts local businesses. It also makes it more<br />
difficult for local employers to find employees who live in the city. Long commutes into<br />
Pasadena exacerbate traffic congestion and pollution.<br />
High housing costs have contributed to the decline in enrollment in Pasadena Unified School<br />
District schools, as low-income families have been pushed out <strong>of</strong> Pasadena. Declining<br />
enrollment means that PUSD receives less revenue from the state government, which is based on<br />
average daily attendance. To make things worse, PUSD has still not recovered from years <strong>of</strong><br />
state budget cuts, which means that PUSD has larger class sizes, and more bare-bones arts,<br />
music, sports, and other programs, than those who attend public schools in more affluent<br />
surrounding districts. The additional sales tax, approved by Pasadena voters in November 2018,<br />
will direct some <strong>of</strong> the new revenue to PUSD. But it will not come close to closing the spending<br />
gap between PUSD and more affluent school districts.<br />
13
Thanks to the city’s Inclusionary Zoning law, a few <strong>of</strong> the new luxury housing projects include a<br />
handful <strong>of</strong> units that are affordable to nurses, school teachers, and firefighters and even some<br />
units that secretaries, janitors, security guards, and hotel workers can afford. But these affordable<br />
units are insufficient to make much <strong>of</strong> a dent in the city’s housing crisis, as is evident by the long<br />
waiting lists for these affordable apartments. Moreover, the city’s Inclusionary Zoning law has a<br />
huge loophole. Most developers pay the city a small fee in-lieu <strong>of</strong> creating affordable housing<br />
within these developments. City <strong>of</strong>ficials then have to figure out how to spend these funds to<br />
create housing affordable to low- and moderate-income families — a difficult task in light <strong>of</strong> the<br />
escalating cost <strong>of</strong> land in Pasadena.<br />
All this new residential development has done little if anything to address Pasadena’s worsening<br />
housing crisis. These new projects’ expensive rents and condo prices don’t reduce pressure on<br />
existing rents. Contrary to those who argue that simply adding more expensive housing relieves<br />
market pressures (a theory called "filtering"), it does nothing to help low- and middle-income<br />
families. We cannot build our way out <strong>of</strong> the housing crisis with more and more luxury housing.<br />
We need to dramatically increase the city's housing supply to meet current and projected<br />
population growth, primarily by adding new units that are affordable to low-income and middleincome<br />
families.<br />
We also need to preserve the existing stock <strong>of</strong> rental housing, which far exceeds the number <strong>of</strong><br />
new units that can be produced in the next several decades. As city adds more high-end housing,<br />
landlords in the existing rental units raise rents to get closer to the rents in the pricy new<br />
apartments. Unless the city adopts policies to protect the existing (and shrinking) supply <strong>of</strong><br />
affordable rental housing, Pasadena’s housing crisis will only get worse.<br />
What can the city do on the housing front?<br />
<br />
The city government can help nonpr<strong>of</strong>it developers purchase existing apartment buildings<br />
and preserve them as permanently affordable rental or co-operative housing.<br />
14
The city government can adopt a “just cause” eviction law that prevents landlords from<br />
arbitrarily evicting tenants unless there is a valid reason, such as not paying rent,<br />
destruction <strong>of</strong> property, or exhibiting loud or violent behavior.<br />
<br />
The city government can adopt a version <strong>of</strong> rent control, which a number <strong>of</strong> other<br />
California cities have done. Rent control does not freeze rents. It allows landlords to<br />
raise rents each year based on increases in costs but limits how much they can increase<br />
rents. It allows landlords to make a fair pr<strong>of</strong>it, but not to take advantage <strong>of</strong> the housing<br />
crisis by gouging tenants. Over half (53 percent) <strong>of</strong> Pasadena voters supported<br />
Proposition 10 – which would have changed state law to allow cities more flexibility in<br />
adopting rent control policies -- despite the fact that the real estate industry statewide<br />
spent over $75 million, most <strong>of</strong> it in misleading media propaganda, to confuse voters.<br />
<br />
The city government can also adopt laws to restrict the conversion <strong>of</strong> apartments to<br />
condominiums. Condo conversions increase the cost <strong>of</strong> housing without increasing the<br />
supply.<br />
<br />
The city government can revise its in-lieu fee policy to require developers to build<br />
affordable units within the market-rate developers rather than pay a small fee to avoid<br />
having to create mixed-income developments.<br />
The city government can also adopt other policies that require local businesses to be more<br />
socially responsible. For example:<br />
<br />
The city government can increase hotel occupancy tax (paid for by tourists) and/or add a<br />
small surcharge on Rose Bowl tickets and direct the additional revenues to help subsidize<br />
new affordable housing or reduce class size in PUSD schools.<br />
<br />
The city government can follow the lead <strong>of</strong> many other cities that extract “community<br />
benefit agreements” — including guarantees <strong>of</strong> decent jobs, affordable housing, park<br />
15
space, and other much-needed priorities — in exchange for public funds and city<br />
approvals. One <strong>of</strong> the biggest new development sites in Pasadena is the campus <strong>of</strong> the<br />
Fuller Theological Seminary, which is gradually moving to Pomona. The city should<br />
adopt a “community development agreement” on the entire site so that any developer<br />
who wants to purchase and build on that prime real estate site has to incorporate at least<br />
one-third <strong>of</strong> any housing units targeted to teachers, day care workers, secretaries, janitors,<br />
cooks and waiters, and other working people.<br />
Until our community starts asking “livable for whom?” and begins addressing the need for<br />
affordable housing and good-paying jobs, Pasadena will continue to be a tragic tale <strong>of</strong> two cities.<br />
16
TABLE 1<br />
AVERAGE INCOME FOR HOUSEHOLDS<br />
(50 Largest <strong>Cities</strong> in California)<br />
City<br />
Average Household Income<br />
Sunnyvale $151,042<br />
Fremont $143,043<br />
San Francisco $137,761<br />
Thousand Oaks $134,885<br />
Santa Clara $129,755<br />
Irvine $125,316<br />
San Jose $124,356<br />
Huntington Beach $115,884<br />
Simi Valley $114,788<br />
Pasadena $109,871<br />
Santa Clarita $109,104<br />
Torrance $107,980<br />
Orange $107,415<br />
Elk Grove $104,270<br />
Rancho Cucamonga $100,140<br />
Roseville $99,930<br />
San Diego $98,632<br />
Fullerton $95,697<br />
Concord $93,929<br />
Oakland $93,849<br />
Hayward $92,906<br />
Corona $91,095<br />
Chula Vista $87,894<br />
Santa Rosa $86,806<br />
Los Angeles $86,758<br />
Glendale $86,639<br />
Anaheim $85,960<br />
Oxnard $83,206<br />
Oceanside $82,243<br />
17
Fontana $80,700<br />
Long Beach $80,613<br />
Garden Grove $79,981<br />
Vallejo $78,413<br />
Bakersfield $78,129<br />
Riverside $78,001<br />
Escondido $77,041<br />
Sacramento $74,469<br />
Visalia $73,305<br />
Santa Ana $73,156<br />
Palmdale $72,275<br />
Moreno Valley $72,005<br />
Modesto $71,393<br />
Ontario $69,644<br />
Salinas $69,026<br />
Pomona $67,948<br />
Stockton $67,393<br />
Fresno $63,830<br />
Lancaster $63,312<br />
Victorville $61,558<br />
San Bernardino $53,310<br />
Source: U.S. Census, American Community Survey, 2013-2017, Five-year estimates<br />
18
TABLE 2<br />
CONCENTRATION OF INCOME IN CALIFORNIA CITIES, 2013-2017<br />
THE SHARE OF TOTAL INCOME OF THE RICHEST 5 PERCENT AND POOREST 20 PERCENT<br />
(50 Largest <strong>Cities</strong> in California)<br />
City<br />
Share <strong>of</strong> Total Income <strong>of</strong><br />
Richest 5 Percent <strong>of</strong> the<br />
Population<br />
Share <strong>of</strong> Total Income <strong>of</strong><br />
Poorest 20 Percent <strong>of</strong> the<br />
Population<br />
Ratio <strong>of</strong> Share <strong>of</strong> Income <strong>of</strong><br />
Richest 5 Percent/Poorest 20<br />
Percent<br />
San Francisco 23.85 2.03 11.75<br />
Pasadena 24.93 2.22 11.23<br />
Los Angeles 27.06 2.52 10.74<br />
Lancaster 19.10 1.95 9.79<br />
Oakland 23.74 2.51 9.46<br />
Irvine 21.27 2.44 8.72<br />
Glendale 22.85 2.76 8.28<br />
Fresno 22.62 2.98 7.59<br />
Stockton 22.62 3.07 7.37<br />
San Diego 22.16 3.14 7.06<br />
Sacramento 21.49 3.05 7.05<br />
Long Beach 21.56 3.12 6.91<br />
Fullerton 20.44 3.18 6.43<br />
Huntington Beach 22.28 3.53 6.31<br />
Visalia 20.47 3.42 5.99<br />
San Jose 19.08 3.22 5.93<br />
Oceanside 19.59 3.31 5.92<br />
Bakersfield 20.04 3.47 5.78<br />
Sunnyvale 19.14 3.36 5.70<br />
Thousand Oaks 20.03 3.56 5.63<br />
Torrance 19.15 3.44 5.57<br />
Modesto 20.09 3.62 5.55<br />
Palmdale 19.23 3.48 5.53<br />
Anaheim 20.00 3.64 5.49<br />
Chula Vista 19.60 3.58 5.47<br />
San Bernardino 19.39 3.55 5.46<br />
Orange 20.18 3.73 5.41<br />
Vallejo 18.20 3.38 5.38<br />
19
Escondido 19.35 3.72 5.20<br />
Victorville 17.94 3.54 5.07<br />
Riverside 18.41 3.65 5.04<br />
Santa Rosa 19.54 3.90 5.01<br />
Corona 18.39 3.75 4.90<br />
Roseville 17.59 3.60 4.89<br />
Elk Grove 18.71 3.98 4.70<br />
Pomona 18.26 3.92 4.66<br />
Concord 17.99 3.93 4.58<br />
Santa Clara 16.95 3.70 4.58<br />
Simi Valley 18.64 4.10 4.55<br />
Hayward 17.56 3.91 4.49<br />
Rancho Cucamonga 17.18 3.98 4.32<br />
Oxnard 18.71 4.55 4.11<br />
Ontario 16.85 4.11 4.10<br />
Garden Grove 18.48 3.77 4.09<br />
Fremont 16.79 4.14 4.06<br />
Santa Ana 17.74 4.62 3.84<br />
Santa Clarita 16.47 4.32 3.81<br />
Salinas 17.11 4.50 3.80<br />
Fontana 16.16 4.35 3.71<br />
Moreno Valley 16.41 4.58 3.58<br />
Source: U.S. Census, American Community Survey, 2013-2017, Five-year estimates<br />
20
TABLE 3<br />
CONCENTRATION OF INCOME IN CALIFORNIA CITIES, 2013-2017<br />
THE SHARE OF TOTAL INCOME OF THE RICHEST 20 PERCENT AND POOREST 20 PERCENT<br />
(50 Largest <strong>Cities</strong> in California)<br />
City<br />
Share <strong>of</strong> Total Income <strong>of</strong><br />
Richest 20 Percent <strong>of</strong> the<br />
Population<br />
Share <strong>of</strong> Total Income <strong>of</strong><br />
Poorest 20 Percent <strong>of</strong> the<br />
Population<br />
Ratio <strong>of</strong> Share <strong>of</strong> Income <strong>of</strong><br />
Richest 20 Percent/Poorest 20<br />
Percent<br />
San Francisco 53.60 2.03 26.40<br />
Lancaster 48.49 1.95 24.87<br />
Pasadena 53.61 2.22 24.15<br />
Los Angeles 56.24 2.52 22.32<br />
Oakland 53.93 2.51 21.49<br />
Irvine 49.46 2.44 20.27<br />
Glendale 53.19 2.76 19.27<br />
Fresno 51.92 2.98 17.42<br />
Stockton 51.25 3.07 16.70<br />
Sacramento 50.14 3.05 16.44<br />
Long Beach 50.62 3.12 16.22<br />
San Diego 50.62 3.14 16.12<br />
Fullerton 49.28 3.18 15.50<br />
San Jose 47.84 3.22 14.86<br />
Oceanside 48.27 3.31 14.58<br />
Visalia 49.02 3.42 14.33<br />
Sunnyvale 47.04 3.36 14.00<br />
Huntington Beach 49.28 3.53 13.96<br />
Bakersfield 48.28 3.47 13.91<br />
Vallejo 46.80 3.38 13.85<br />
Torrance 47.40 3.44 13.78<br />
Palmdale 47.71 3.48 13.71<br />
San Bernardino 48.19 3.55 13.57<br />
Thousand Oaks 48.05 3.56 13.50<br />
Modesto 48.09 3.62 13.28<br />
Victorville 46.83 3.54 13.23<br />
Anaheim 48.13 3.64 13.22<br />
21
Chula Vista 46.90 3.58 13.10<br />
Escondido 47.68 3.72 12.82<br />
Riverside 46.63 3.65 12.78<br />
Orange 47.44 3.73 12.72<br />
Roseville 45.39 3.60 12.61<br />
Garden Grove 46.98 3.77 12.46<br />
Corona 45.81 3.75 12.22<br />
Santa Clara 44.88 3.70 12.13<br />
Santa Rosa 47.24 3.90 12.11<br />
Pomona 46.20 3.92 11.79<br />
Hayward 45.57 3.91 11.65<br />
Concord 45.48 3.93 11.57<br />
Elk Grove 44.92 3.98 11.29<br />
Rancho Cucamonga 44.57 3.98 11.20<br />
Simi Valley 45.65 4.10 11.13<br />
Ontario 44.38 4.11 10.80<br />
Fremont 43.78 4.14 10.57<br />
Santa Clarita 43.93 4.32 10.17<br />
Oxnard 45.92 4.55 10.09<br />
Salinas 45.18 4.50 10.04<br />
Fontana 43.50 4.35 10.00<br />
Santa Ana 45.70 4.62 9.90<br />
Moreno Valley 43.42 4.58 9.48<br />
Source: U.S. Census, American Community Survey, 2013-2017, Five-year estimates<br />
22
TABLE 4<br />
THE RICH-POOR GAP<br />
INCOME INEQUALITY AMONG CALIFORNIA'S 50 LARGEST CITIES: THE RICHEST 5 PERCENT AND<br />
POOREST 20 PERCENT<br />
City<br />
Average Income <strong>of</strong> Richest<br />
5 Percent<br />
Average Income <strong>of</strong> Poorest<br />
20 Percent<br />
Ratio <strong>of</strong> Richest 5 Percent to<br />
Poorest 20 Percent<br />
San Francisco $657,116 $14,007 46.91<br />
Pasadena $547,864 $12,153 45.08<br />
Los Angeles $469,520 $10,923 42.98<br />
Lancaster $241,837 $6,164 39.23<br />
Oakland $445,610 $11,778 37.83<br />
Irvine $533,009 $15,260 34.93<br />
Glendale $395,892 $11,962 33.10<br />
Fresno $288,823 $9,511 30.37<br />
Stockton $304,864 $10,343 29.48<br />
San Diego $437,061 $15,455 28.28<br />
Sacramento $320,103 $11,344 28.22<br />
Long Beach $347,561 $12,583 27.62<br />
Fullerton $391,301 $15,205 25.74<br />
Huntington Beach $516,459 $20,469 25.23<br />
Visalia $300,146 $12,535 23.94<br />
Oceanside $322,242 $13,554 23.77<br />
San Jose $474,623 $20,018 23.71<br />
Bakersfield $313,166 $13,544 23.12<br />
Sunnyvale $578,178 $25,353 22.81<br />
Thousand Oaks $540,433 $23,958 22.56<br />
Torrance $413,677 $18,555 22.29<br />
Modesto $286,833 $12,911 22.22<br />
Palmdale $278,011 $12,580 22.10<br />
Anaheim $343,768 $15,650 21.97<br />
Chula Vista $344,530 $15,728 21.91<br />
San Bernardino $206,700 $9,473 21.82<br />
Orange $433,647 $20,012 21.67<br />
23
Vallejo $285,374 $13,242 21.55<br />
Escondido $298,157 $14,310 20.84<br />
Victorville $220,857 $10,907 20.25<br />
Riverside $287,277 $14,234 20.18<br />
Santa Rosa $339,300 $16,898 20.08<br />
Corona $335,137 $17,062 19.64<br />
Garden Grove $295,643 $15,060 19.63<br />
Roseville $351,483 $17,967 19.56<br />
Elk Grove $390,132 $20,744 18.81<br />
Pomona $248,241 $13,272 18.70<br />
Santa Clara $439,870 $24,000 18.33<br />
Concord $337,871 $18,439 18.32<br />
Simi Valley $427,957 $23,498 18.21<br />
Hayward $326,245 $18,147 17.98<br />
Rancho Cucamonga $344,046 $19,904 17.29<br />
Oxnard $311,332 $18,922 16.45<br />
Ontario $234,711 $14,292 16.42<br />
Fremont $480,509 $29,547 16.26<br />
Santa Ana $259,518 $16,907 15.35<br />
Santa Clarita $359,374 $23,516 15.28<br />
Salinas $236,143 $15,548 15.19<br />
Fontana $260,901 $17,550 14.87<br />
Moreno Valley $236,320 $16,487 14.33<br />
Source: U.S. Census, American Community Survey, 2013-2017, Five-year estimates<br />
24
TABLE 5<br />
THE RICH-POOR GAP<br />
INCOME INEQUALITY AMONG CALIFORNIA'S 50 LARGEST CITIES: THE RICHEST 20 PERCENTAND<br />
POOREST 20 PERCENT<br />
City<br />
Average Income <strong>of</strong> Richest<br />
20 Percent<br />
Average Income <strong>of</strong> Poorest<br />
20 Percent<br />
Ratio <strong>of</strong> Richest 20 Percent<br />
to Poorest 20 Percent<br />
San Francisco $369,196 $14,007 26.36<br />
Lancaster $153,518 $6,164 24.91<br />
Pasadena $294,533 $12,153 24.24<br />
Los Angeles $243,982 $10,923 22.34<br />
Oakland $253,076 $11,778 21.49<br />
Irvine $309,883 $15,260 20.31<br />
Glendale $230,426 $11,962 19.26<br />
Fresno $165,718 $9,511 17.42<br />
Stockton $172,705 $10,343 16.70<br />
Sacramento $186,688 $11,344 16.46<br />
Long Beach $204,029 $12,583 16.21<br />
San Diego $249,643 $15,455 16.15<br />
Fullerton $235,815 $15,205 15.51<br />
San Jose $297,432 $20,018 14.86<br />
Oceanside $198,527 $13,554 14.65<br />
Visalia $179,669 $12,535 14.33<br />
Sunnyvale $355,260 $25,353 14.01<br />
Huntington Beach $285,553 $20,469 13.95<br />
Bakersfield $188,613 $13,544 13.93<br />
Vallejo $183,470 $13,242 13.86<br />
Torrance $255,925 $18,555 13.79<br />
Palmdale $172,435 $12,580 13.71<br />
San Bernardino $128,447 $9,473 13.56<br />
Thousand Oaks $324,094 $23,958 13.53<br />
Modesto $171,657 $12,911 13.30<br />
Anaheim $206,886 $15,650 13.22<br />
Victorville $144,150 $10,907 13.22<br />
25
Chula Vista $206,136 $15,728 13.11<br />
Escondido $183,673 $14,310 12.84<br />
Riverside $181,854 $14,234 12.78<br />
Orange $254,810 $20,012 12.73<br />
Roseville $226,781 $17,967 12.62<br />
Garden Grove $187,877 $15,060 12.48<br />
Corona $208,677 $17,062 12.23<br />
Santa Clara $291,185 $24,000 12.13<br />
Santa Rosa $205,040 $16,898 12.13<br />
Pomona $156,970 $13,272 11.83<br />
Hayward $211,677 $18,147 11.66<br />
Concord $213,598 $18,439 11.58<br />
Elk Grove $234,196 $20,744 11.29<br />
Rancho Cucamonga $223,165 $19,904 11.21<br />
Simi Valley $261,992 $23,498 11.15<br />
Ontario $154,530 $14,292 10.81<br />
Fremont $313,143 $29,547 10.60<br />
Santa Clarita $239,632 $23,516 10.19<br />
Oxnard $191,060 $18,922 10.10<br />
Salinas $155,929 $15,548 10.03<br />
Fontana $175,507 $17,550 10.00<br />
Santa Ana $167,175 $16,907 9.89<br />
Moreno Valley $156,338 $16,487 9.48<br />
Source: U.S. Census, American Community Survey, 2013-2017, Five-year estimates<br />
26
TABLE 6<br />
DISTRIBUTION OF PASADENA HOUSEHOLDS BY INCOME GROUP:<br />
2013 AND 2017<br />
2013<br />
Number <strong>of</strong><br />
Households<br />
2013<br />
Percent <strong>of</strong> Total<br />
2017<br />
Number <strong>of</strong><br />
Households<br />
2017<br />
Percent <strong>of</strong> Total<br />
Households with incomes<br />
below $25,000<br />
Households with incomes<br />
between<br />
$25,000- $100,000<br />
Households with incomes<br />
between<br />
$100,000 - $200,000<br />
Households with incomes<br />
over $200,000<br />
10,582 19.2 percent 10,501 19.3 percent<br />
25,308 45.9 percent 23,287 42.6 percent<br />
13,173 23.9 percent 13,917 25.4 percent<br />
6,047 11.0 percent 7,029 12.6 percent<br />
Poverty rate 13.2 percent 15.5 percent<br />
Source: U.S. Census, American Community Survey 5-year Estimates<br />
27
TABLE 7<br />
PASADENA LOW-WAGE WORKFORCE<br />
PASADENA RESIDENTS WITH MORE THAN $500 IN WAGE AND SALARY INCOME EARNING LESS<br />
THAN $15 PER HOUR WORKING FULL YEAR AND FULL TIME (2016)<br />
Earning less than $15/hour Number <strong>of</strong> workers Percentage <strong>of</strong> categorized<br />
Total categorized 19,730 100 percent<br />
Full-time, year-round 11,658 59 percent<br />
Part-time, year-round 5,139 26 percent<br />
Part-time, part-year 2,933 15 percent<br />
Total including not categorized 23,117<br />
Source: U.S. Census Bureau, American Community Survey Public Use Microdata Sample including only<br />
workers with $500 or more income in the survey year. Los Angeles Economic Roundtable analysis.<br />
28
TABLE 8<br />
PASADENA LOW-WAGE WORKFORCE BY SECTOR<br />
2016<br />
Sector<br />
Number <strong>of</strong> workers<br />
Number <strong>of</strong> workers<br />
earning less than<br />
$15/hour<br />
Percentage <strong>of</strong><br />
workers earning less<br />
than $15/hour<br />
Accommodation and food service 4,931 3,362 68 percent<br />
Other services (except public) 3,525 1,947 55 percent<br />
Retail trade 5,602 2,960 53 percent<br />
Administrative support and waste<br />
management<br />
2,598 1,334 51 percent<br />
Construction 3,150 1,342 43 percent<br />
Transportation and warehouse 1,756 658 37 percent<br />
Arts, entertainment and recreation 2,434 876 36 percent<br />
Health care and social assistance 10,260 3,425 33 percent<br />
Educational services 9,569 2,689 28 percent<br />
Manufacturing 4,111 935 23 percent<br />
Public administration 2,875 483 17 percent<br />
Information, finance, real estate,<br />
17,431 2,559 15 percent<br />
pr<strong>of</strong>essional, scientific and technical<br />
Source: U.S. Census Bureau, American Community Survey Public Use Microdata Sample including only<br />
workers with $500 or more income in the survey year. Los Angeles Economic Roundtable analysis.<br />
29
TABLE 9<br />
MEDIAN RENT FOR A TWO-BEDROOM APARTMENT IN PASADENA<br />
2013-2018<br />
(FOR NOVEMBER)<br />
Year 2013 2014 2015 2016 2017 2018<br />
Rent $2200 $2400 $2650 $2590 $2700 $2900<br />
Annual Change 9.1 percent 10.4 percent -2.2 percent 4.2 percent 7.4 percent<br />
Total Change<br />
Source: Zillow<br />
https://www.zillow.com/pasadena-ca/home-values/<br />
31.8 percent<br />
30
TABLE 10<br />
HOUSING COSTS OF PASADENA HOUSEHOLDS BY INCOME AMONG OWNER-OCCUPIED AND<br />
RENTER-OCCUPIED UNITS<br />
PERCENT PAYING OVER 30 PERCENT OF HOUSEHOLD INCOME FOR HOUSING<br />
Income<br />
Less than<br />
$20,000<br />
$20,000 to<br />
$34,999<br />
$35,000 to<br />
$49,999<br />
$50,000 to<br />
$74,999<br />
$75,000 or<br />
more<br />
Number <strong>of</strong> Owner<br />
Households<br />
Paying Over 30<br />
Percent for<br />
Housing<br />
Percentage <strong>of</strong> Owner<br />
Households Paying<br />
Over 30 Percent for<br />
Housing<br />
Number <strong>of</strong> Renter<br />
Households Paying<br />
Over 30 Percent for<br />
Housing<br />
Percentage <strong>of</strong> Renter<br />
Households paying<br />
Over 30 Percent for<br />
Housing<br />
1,532 90.5 5,499 93.3<br />
919 73.8 3,791 96.2<br />
767 62.7 2,586 83.5<br />
1,593 56.5 2,975 52.4<br />
3,337 20.0 1,174 10.7<br />
Total 8,148 34.1 16,025 51.9<br />
Source: Table B25106 Tenure by Housing Costs as a Percentage <strong>of</strong> Household Income, U.S. Census,<br />
American Community Survey, 2013-2017, Five-year estimates<br />
31
TABLE 11<br />
Rent Burdens for Households with Workers Earning Less than and Over $15/ hour<br />
2016<br />
Number <strong>of</strong><br />
households; wages<br />
less than $15/hour<br />
Percent <strong>of</strong><br />
households with<br />
wages less than<br />
$15/hour<br />
Severe rent burden (above 50<br />
percent <strong>of</strong> income)<br />
4,928 31 percent<br />
Rent burden 31percent – 50 percent<br />
<strong>of</strong> income<br />
5,034 31 percent<br />
Rent burden 30 percent or less <strong>of</strong><br />
income<br />
6,047 38 percent<br />
Source: U.S. Census Bureau, American Community Survey Public Use Microdata Sample including only<br />
workers with $500 or more income in the survey year. Los Angeles Economic Roundtable analysis.<br />
32
TABLE 12<br />
OVERCROWDING FOR LOW-INCOME PASADENA RENTING FAMILY HOUSEHOLDS<br />
Number <strong>of</strong> families with<br />
wages less than $15/hour<br />
Percentage <strong>of</strong> families with<br />
wages less than $15/hour<br />
Not crowded 13,539 80 percent<br />
Overcrowded (1.01 -1.50<br />
people per room)<br />
Severely overcrowded (above<br />
1.51 people per room)<br />
2,328 14 percent<br />
1,012 6 percent<br />
Source: U.S. Census Bureau, American Community Survey Public Use Microdata Sample including only<br />
workers with $500 or more income in the survey year. Economic Roundtable analysis.<br />
33
TABLE 13<br />
HOUSEHOLD INCOME DISTRIBUTION AMONG OWNER-OCCUPIED HOUSEHOLDS AND RENTER-<br />
OCCUPIED HOUSEHOLDS<br />
Household Income<br />
Number <strong>of</strong><br />
Owner<br />
Households<br />
Percentage <strong>of</strong><br />
Owner<br />
Households<br />
Number <strong>of</strong><br />
Renter<br />
Households<br />
Percentage<br />
<strong>of</strong> Renter<br />
Households<br />
Less than $5,000 594 2.4 1,879 6.0<br />
$5,000 to $9,999 245 1.0 1,151 3.7<br />
$10,000 to $14,999 483 2.0 2,559 8.3<br />
$15,000 to $19,999 603 2.5 1,257 4.0<br />
$20,000 to $24,999 375 1.6 1,355 4.3<br />
$25,000 to $34,999 870 3.6 2,670 8.6<br />
$35,000 to $49,999 1,223 5.1 3,156 10.2<br />
$50,000 to $74,999 2,816 11.7 5,763 18.7<br />
$75,000 to $99,999 2,988 12.5 3,801 12.3<br />
$100,000 to $149,999 4,940 20.7 4,038 13.1<br />
$150,000 or more 8,735 36.6 3,233 10.5<br />
Total 23,872 30,862<br />
Median household<br />
$115,074 $55,752<br />
income<br />
Source: Table B25118 Tenure by Household Income, U.S. Census, American Community Survey, 2013-2017,<br />
Five-year estimates<br />
34
TABLE 14<br />
PROPORTION OF OWNERS AND RENTERS BY INCOME GROUP<br />
Household Income<br />
Number <strong>of</strong><br />
Households<br />
Percentage Owner<br />
Households in Income<br />
Group<br />
Percentage Renter<br />
Households in Income<br />
Group<br />
Less than $5,000 2,473 24.0 86.0<br />
$5,000 to $9,999 1,396 17.5 82.5<br />
$10,000 to $14,999 3,042 15.8 84.2<br />
$15,000 to $19,999 1,860 32.4 67.6<br />
$20,000 to $24,999 1,730 21.6 78.4<br />
$25,000 to $34,999 3,540 24.5 75.5<br />
$35,000 to $49,999 4,379 27.9 72.1<br />
$50,000 to $74,999 8,579 32.8 67.2<br />
$75,000 to $99,999 6,789 44.0 56.0<br />
$100,000 to $149,999 8,978 55.0 45.0<br />
$150,000 or more 11,968 73.0 27.0<br />
Total 54,732 23,872 (43.6 percent) 30,862 (56.4 percent)<br />
Source: Table B25106 Tenure by Housing Cots as a Percentage <strong>of</strong> Household Income, U.S. Census, American<br />
Community Survey, 2013-2017, Five-year estimates<br />
35