Pasadenas-Tale-of-Two-Cities-2019

You also want an ePaper? Increase the reach of your titles
YUMPU automatically turns print PDFs into web optimized ePapers that Google loves.
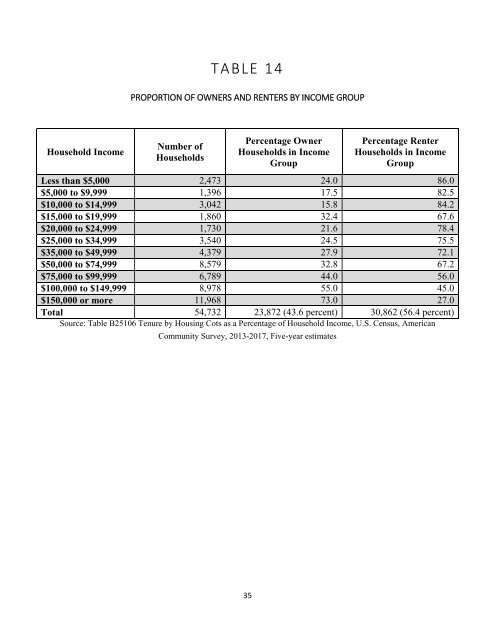
TABLE 14<br />
PROPORTION OF OWNERS AND RENTERS BY INCOME GROUP<br />
Household Income<br />
Number <strong>of</strong><br />
Households<br />
Percentage Owner<br />
Households in Income<br />
Group<br />
Percentage Renter<br />
Households in Income<br />
Group<br />
Less than $5,000 2,473 24.0 86.0<br />
$5,000 to $9,999 1,396 17.5 82.5<br />
$10,000 to $14,999 3,042 15.8 84.2<br />
$15,000 to $19,999 1,860 32.4 67.6<br />
$20,000 to $24,999 1,730 21.6 78.4<br />
$25,000 to $34,999 3,540 24.5 75.5<br />
$35,000 to $49,999 4,379 27.9 72.1<br />
$50,000 to $74,999 8,579 32.8 67.2<br />
$75,000 to $99,999 6,789 44.0 56.0<br />
$100,000 to $149,999 8,978 55.0 45.0<br />
$150,000 or more 11,968 73.0 27.0<br />
Total 54,732 23,872 (43.6 percent) 30,862 (56.4 percent)<br />
Source: Table B25106 Tenure by Housing Cots as a Percentage <strong>of</strong> Household Income, U.S. Census, American<br />
Community Survey, 2013-2017, Five-year estimates<br />
35