

OHI+ Tanzania_Technical Report_2018

Create successful ePaper yourself
Turn your PDF publications into a flip-book with our unique Google optimized e-Paper software.
Ocean Health Index – <strong>Tanzania</strong> <strong>2018</strong> 39<br />
8.6. Method - calculating the index<br />
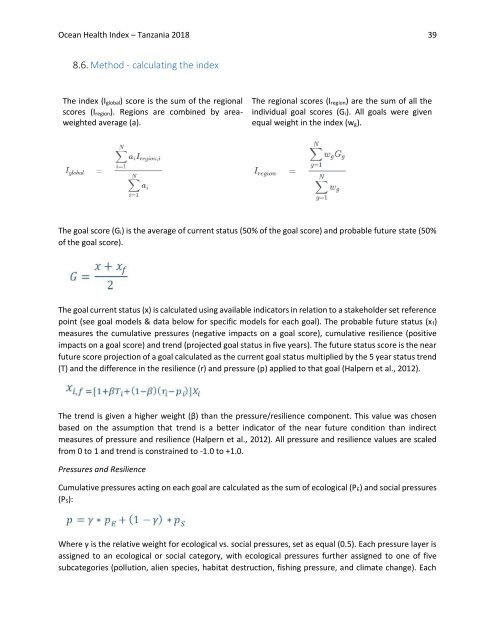
The index (I global ) score is the sum of the regional<br />
scores (I region ). Regions are combined by areaweighted<br />
average (a).<br />
The regional scores (I region ) are the sum of all the<br />
individual goal scores (G i ). All goals were given<br />
equal weight in the index (w g ).<br />
The goal score (G i ) is the average of current status (50% of the goal score) and probable future state (50%<br />
of the goal score).<br />
The goal current status (x) is calculated using available indicators in relation to a stakeholder set reference<br />
point (see goal models & data below for specific models for each goal). The probable future status (x f )<br />
measures the cumulative pressures (negative impacts on a goal score), cumulative resilience (positive<br />
impacts on a goal score) and trend (projected goal status in five years). The future status score is the near<br />
future score projection of a goal calculated as the current goal status multiplied by the 5 year status trend<br />
(T) and the difference in the resilience (r) and pressure (p) applied to that goal (Halpern et al., 2012).<br />
The trend is given a higher weight (β) than the pressure/resilience component. This value was chosen<br />
based on the assumption that trend is a better indicator of the near future condition than indirect<br />
measures of pressure and resilience (Halpern et al., 2012). All pressure and resilience values are scaled<br />
from 0 to 1 and trend is constrained to -1.0 to +1.0.<br />
Pressures and Resilience<br />
Cumulative pressures acting on each goal are calculated as the sum of ecological (P E ) and social pressures<br />
(P S ):<br />
Where γ is the relative weight for ecological vs. social pressures, set as equal (0.5). Each pressure layer is<br />
assigned to an ecological or social category, with ecological pressures further assigned to one of five<br />
subcategories (pollution, alien species, habitat destruction, fishing pressure, and climate change). Each


