

OHI+ Tanzania_Technical Report_2018

Create successful ePaper yourself
Turn your PDF publications into a flip-book with our unique Google optimized e-Paper software.
Ocean Health Index – <strong>Tanzania</strong> <strong>2018</strong> 44<br />
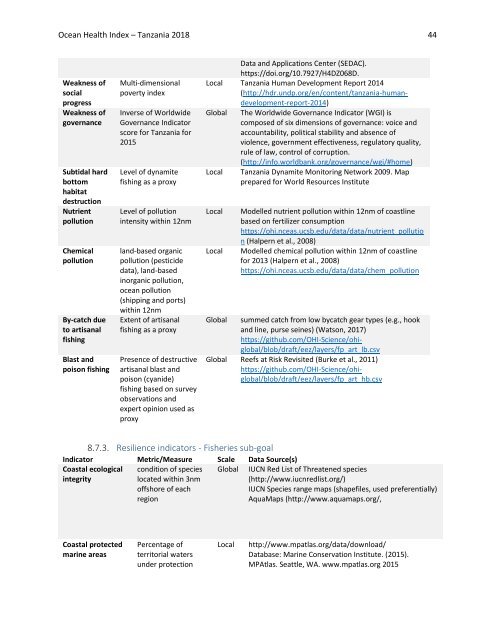
Weakness of<br />
social<br />
progress<br />
Weakness of<br />
governance<br />
Subtidal hard<br />
bottom<br />
habitat<br />
destruction<br />
Nutrient<br />
pollution<br />
Chemical<br />
pollution<br />
By-catch due<br />
to artisanal<br />
fishing<br />
Blast and<br />
poison fishing<br />
Multi-dimensional<br />
poverty index<br />
Inverse of Worldwide<br />
Governance Indicator<br />
score for <strong>Tanzania</strong> for<br />
2015<br />
Level of dynamite<br />
fishing as a proxy<br />
Level of pollution<br />
intensity within 12nm<br />
land-based organic<br />
pollution (pesticide<br />
data), land-based<br />
inorganic pollution,<br />
ocean pollution<br />
(shipping and ports)<br />
within 12nm<br />
Extent of artisanal<br />
fishing as a proxy<br />
Presence of destructive<br />
artisanal blast and<br />
poison (cyanide)<br />
fishing based on survey<br />
observations and<br />
expert opinion used as<br />
proxy<br />
Data and Applications Center (SEDAC).<br />
https://doi.org/10.7927/H4DZ068D.<br />
Local <strong>Tanzania</strong> Human Development <strong>Report</strong> 2014<br />
(http://hdr.undp.org/en/content/tanzania-humandevelopment-report-2014)<br />
Global The Worldwide Governance Indicator (WGI) is<br />
composed of six dimensions of governance: voice and<br />
accountability, political stability and absence of<br />
violence, government effectiveness, regulatory quality,<br />
rule of law, control of corruption.<br />
(http://info.worldbank.org/governance/wgi/#home)<br />
Local <strong>Tanzania</strong> Dynamite Monitoring Network 2009. Map<br />
prepared for World Resources Institute<br />
Local<br />
Local<br />
Modelled nutrient pollution within 12nm of coastline<br />
based on fertilizer consumption<br />
https://ohi.nceas.ucsb.edu/data/data/nutrient_pollutio<br />
n (Halpern et al., 2008)<br />
Modelled chemical pollution within 12nm of coastline<br />
for 2013 (Halpern et al., 2008)<br />
https://ohi.nceas.ucsb.edu/data/data/chem_pollution<br />
Global summed catch from low bycatch gear types (e.g., hook<br />
and line, purse seines) (Watson, 2017)<br />
https://github.com/OHI-Science/ohiglobal/blob/draft/eez/layers/fp_art_lb.csv<br />
Global Reefs at Risk Revisited (Burke et al., 2011)<br />
https://github.com/OHI-Science/ohiglobal/blob/draft/eez/layers/fp_art_hb.csv<br />
8.7.3. Resilience indicators - Fisheries sub-goal<br />
Indicator Metric/Measure Scale Data Source(s)<br />
Coastal ecological<br />
integrity<br />
Global<br />
condition of species<br />
located within 3nm<br />
offshore of each<br />
region<br />
IUCN Red List of Threatened species<br />
(http://www.iucnredlist.org/)<br />
IUCN Species range maps (shapefiles, used preferentially)<br />
AquaMaps (http://www.aquamaps.org/,<br />
Coastal protected<br />
marine areas<br />
Percentage of<br />
territorial waters<br />
under protection<br />
Local<br />
http://www.mpatlas.org/data/download/<br />
Database: Marine Conservation Institute. (2015).<br />
MPAtlas. Seattle, WA. www.mpatlas.org 2015


