Akter, S., Wamba, S. F., Gunasekaran, A., Dubey, R., & Childe, S. J. (2016). How to improve firm performance using BDAC and business strategy alignment.

Create successful ePaper yourself
Turn your PDF publications into a flip-book with our unique Google optimized e-Paper software.
122<br />
S. <strong>Akter</strong> et al. / Int. J. Production Economics 182 (<strong>2016</strong>) 113–131<br />
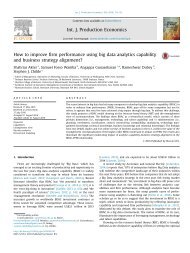
Table 7<br />
Equations for hierarchical modeling <strong>using</strong> partial least squares (PLS).<br />
First-order <strong>BDAC</strong> model Second-order <strong>BDAC</strong> model Third-order <strong>BDAC</strong> model<br />
y i = Λy.<br />
ηj εi ηj = Γ.<br />
ζκ<br />
+ ζj ηj = β. ηj + Γ.<br />
ζκ<br />
+ ζj<br />
y i ¼manifest variables (e.g., items of BDA<br />
planning)<br />
η j ¼first-order fac<strong>to</strong>rs (e.g., BDA planning) η j ¼second-order fac<strong>to</strong>rs (i.e., management, technology <strong>and</strong> talent<br />
capability)<br />
Λ y ¼loadings of first-order LVs<br />
Γ ¼loadings of second-order LVs<br />
η j ¼first-order LVs (e.g., BDA planning)<br />
ζ κ ¼second-order LVs (e.g., BDA management<br />
capability)<br />
β η j ¼higher-order LVs with loadings (i.e., from first <strong>to</strong> the nth order,<br />
except the highest order)<br />
ε i ¼measurement error ζ j ¼error of first-order fac<strong>to</strong>rs Γ ζ κ ¼the highest-order LV with loadings (i.e., third-order <strong>BDAC</strong><br />
construct)<br />
ζ j ¼error of second-order fac<strong>to</strong>rs<br />
more on its own construct than on other constructs <strong>and</strong>, therefore,<br />
all constructs share a substantial amount of variance with their<br />
own items (Chin, 1998b; Fornell <strong>and</strong> Bookstein, 1982). In all cases,<br />
the item’s relationship <strong>to</strong> its own construct has a shared variance<br />
of more than 56% (i.e., 0.75*0.75), which is substantial in magnitude<br />
in comparison with other constructs (Chin, 2010). Overall, the<br />
measurement model was considered satisfac<strong>to</strong>ry due <strong>to</strong> the evidence<br />
of adequate reliability (AVE40.50, CR40.80) <strong>and</strong> convergent<br />
validity (loadings40.75), as shown in Table 8, <strong>and</strong> discriminant<br />
validity ( AVE 4correlations), as shown in Table 9. The<br />
first-order measurement model was thus con<strong>firm</strong>ed as satisfac<strong>to</strong>ry:<br />
it was then employed for testing the higher-order measurement<br />
model <strong>and</strong> the structural model which is described in the<br />
next sections.<br />
5.2. Higher-order measurement model<br />
In Table 10, the study estimated the measurement properties of<br />
the higher-order constructs, that is, the third-order <strong>BDAC</strong> construct<br />
<strong>and</strong> second-order management capability, technology capability,<br />
<strong>and</strong> talent capability constructs. The third-order <strong>BDAC</strong><br />
construct consists of 44 items (16þ12þ16) of which 16 items<br />
(4þ4þ4þ4) represent BDA planning capability, 12 items<br />
(4þ4þ4) represent BDA technology capability, <strong>and</strong> 16 items<br />
(4þ4þ4þ4) represent talent capability. As higher-order constructs<br />
are reflective, the study con<strong>firm</strong>ed that the loadings of<br />
items of both the third-order <strong>BDAC</strong> construct <strong>and</strong> the second-order<br />
constructs (management capability, technology capability, <strong>and</strong><br />
talent capability) are significant at po0.05.<br />
The degree of variance of the third-order <strong>BDAC</strong> construct was<br />
explained by its second-order antecedents, that is, BDAMAC (88%),<br />
BDATEC (83%), <strong>and</strong> BDATLC (90%). Accordingly, the variances of the<br />
second-order constructs were explained by their corresponding<br />
first-order components (see Appendix 2). For ex<strong>amp</strong>le, the degree<br />
of explained variance of BDAMAC was explained by BDAPL (82%),<br />
BDAID (79%), <strong>BDAC</strong>O (72%), <strong>and</strong> <strong>BDAC</strong>T (85%). Similarly, BDATEC<br />
was explained by <strong>BDAC</strong>N (75%), <strong>BDAC</strong>M (85%), <strong>and</strong> BDAMD (81%).<br />
Finally, BDATLC was explained by BDATM (86%), BDATK (89%),<br />
BDABK (87%), <strong>and</strong> BDARK (88%). All these path coefficients from<br />
the first-order <strong>to</strong> the second-order <strong>to</strong> the third-order constructs<br />
were significant at po0.01.<br />
5.3. Structural model<br />
To assess the validity of the structural model, the study estimated<br />
the relationship between the higher-order <strong>BDAC</strong> <strong>and</strong> FPER.<br />
The results provide a st<strong>and</strong>ardized beta of 0.709 for the <strong>BDAC</strong>–<br />
FPER path in the main, thus supporting H1. In order <strong>to</strong> identify the<br />
moderating effect of ACBSA on FPER, we applied PLS product-indica<strong>to</strong>r<br />
approach (Chin et al., 2003). We created the interaction<br />
construct by multiplying the hierarchical <strong>BDAC</strong> construct with<br />
ACBSA construct following the guidelines of Chin et al. (2003).<br />
Thus, <strong>to</strong> estimate the interaction effect, we separately estimated<br />
the influence of <strong>BDAC</strong> on FPER, ACBSA on FPER <strong>and</strong> the impact of<br />
<strong>BDAC</strong>*ACBSA (interaction variable) on FPER. For the interaction<br />
model, the results provide us a st<strong>and</strong>ardized beta of 0.261 for<br />
<strong>BDAC</strong>–FPER (po0.01), 0.542 for ACBSA-FPER (po0.01) <strong>and</strong> 0.153<br />
(po0.05) for <strong>BDAC</strong>*ACBSA-FPER respectively. We con<strong>firm</strong> the<br />
significance of the modera<strong>to</strong>r because the path coefficient of the<br />
<strong>BDAC</strong>*ACBSA-FPER is significant, independently of <strong>BDAC</strong>–FPER <strong>and</strong><br />
ACBSA-FPER relationships in the interaction model (Henseler <strong>and</strong><br />
Fassott, 2010). According <strong>to</strong> the guidelines of Cohen (1988), the<br />
size of the moderating effect is medium (f 2 ¼0.23) but significant<br />
at po0.05. Thus, the results provide support for the H2. InTable<br />
11, we evaluated the main model (m) with the interaction<br />
model (i) <strong>using</strong> an incremental F test <strong>to</strong> investigate whether inclusion<br />
of moderating variable (ACBSA) significantly enhances the<br />
R 2 for FPER. The findings con<strong>firm</strong> a superior prediction power of<br />
the interaction model, which is reflected in <strong>firm</strong> <strong>performance</strong><br />
(ΔR 2 ¼0.093, f 2 ¼0.23, po0.01). Similarly, we investigated the<br />
impact of control variables (COVA) on FPER, however, the results<br />
show insignificant impact of COVA as the R 2 change is very small<br />
after including this construct in the model.<br />
5.4. Additional analyses<br />
The findings of the study con<strong>firm</strong> the impact of <strong>BDAC</strong> <strong>and</strong><br />
ACBSA on FPER, thereby ensuring the nomological validity of the<br />
overall research model. The study also conducted few additional<br />
analyses <strong>to</strong> ensure overall validity of the findings. First, <strong>to</strong> address<br />
the concern of non-response bias, we checked the profiles of the<br />
survey respondents <strong>and</strong> those on the panel in terms of organization<br />
size <strong>and</strong> industry, <strong>and</strong> no non-response bias was found<br />
through the chi-square tests (Kim et al., 2012). We also compared<br />
the early (20%) <strong>and</strong> late (20%) response groups, <strong>and</strong> the paired t-<br />
test did not provide any significant difference on the survey items<br />
between two groups. Second, we checked common method variance<br />
(CMV) by applying Harman’s one-fac<strong>to</strong>r test (Podsakoff <strong>and</strong><br />
Organ, 1986) on the 11 first-order constructs <strong>and</strong> the results did<br />
not provide any significant common fac<strong>to</strong>r loading on all the<br />
measures. Third, we applied S<strong>to</strong>ne–Geisser's Q 2 <strong>to</strong> test the predictive<br />
validity of the model (<strong>Akter</strong> et al., 2011). Using the crossvalidated<br />
redundancy approach (omission distance¼7), this study<br />
obtained a Q 2 0.503 for FPER, which adequately demonstrate the<br />
predictive validity of the <strong>BDAC</strong> construct on FPER in the big data<br />
environment (Chin, 2010). Finally, the study conducted power<br />
analysis (1 β) <strong>to</strong> validate the empirical findings on the 152 responses<br />
in the s<strong>amp</strong>le. Power (1 β) indicates the probability of<br />
successfully rejecting a null hypothesis (Cohen, 1992). Using<br />
G*Power 3.1.3 by Faul et al. (2009), the study conducted the power<br />
test (post hoc) <strong>to</strong> estimate the validity of the hypothesized relationships.<br />
Cohen (1988) suggests that a threshold level of 0.80 be