
You also want an ePaper? Increase the reach of your titles
YUMPU automatically turns print PDFs into web optimized ePapers that Google loves.
Methodology of the study<br />
Data from multiple sources, including 42<br />
population-based cancer registries and<br />
the national sample registration system<br />
of India was used. The study presents<br />
data on:<br />
1 The incidence of 28 types of cancer<br />
in every state of India from 1990 to<br />
2016<br />
2. Death rates and trends of all<br />
types of cancers<br />
3. Disability-adjusted life years<br />
(DALYs) for each type of<br />
cancer<br />
4. The contribution of<br />
major risk factors<br />
to the cancer<br />
DALYs in<br />
India<br />
Rajasthan<br />
58.8<br />
72.6<br />
Haryana<br />
71.0<br />
103.3<br />
Himachal<br />
Pradesh<br />
69.8<br />
91.6<br />
Punjab<br />
58.0<br />
85.5<br />
Jammu &<br />
Kashmir<br />
69.1<br />
79.2<br />
Delhi<br />
64.6<br />
102.9<br />
Uttarakhand<br />
69.3<br />
91.0<br />
Uttar Pradesh<br />
72.0<br />
79.0<br />
Bihar<br />
44.9<br />
53.9<br />
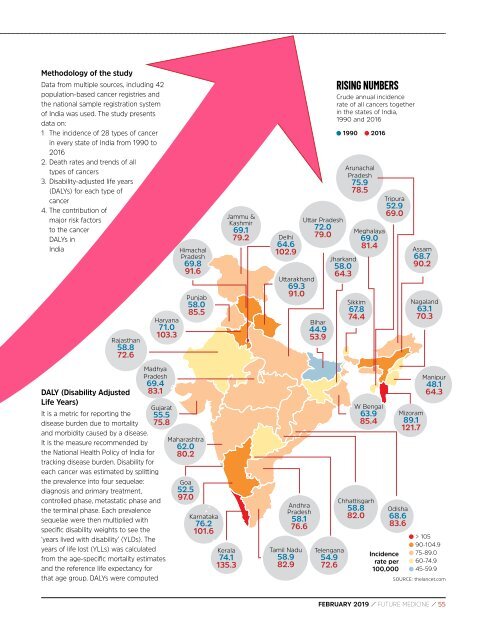
RISING NUMBERS<br />
Crude annual incidence<br />
rate of all cancers together<br />
in the states of India,<br />
1990 and 2016<br />
1990 2016<br />
Jharkand<br />
58.0<br />
64.3<br />
Arunachal<br />
Pradesh<br />
75.9<br />
78.5<br />
Meghalaya<br />
69.0<br />
81.4<br />
Sikkim<br />
67.8<br />
74.4<br />
Tripura<br />
52.9<br />
69.0<br />
Assam<br />
68.7<br />
90.2<br />
Nagaland<br />
63.1<br />
70.3<br />
DALY (Disability Adjusted<br />
Life Years)<br />
Madhya<br />
Pradesh<br />
69.4<br />
83.1<br />
Gujarat<br />
55.5<br />
75.8<br />
It is a metric for reporting the<br />
disease burden due to mortality<br />
and morbidity caused by a disease.<br />
It is the measure recommended by<br />
the National Health Policy of India for<br />
tracking disease burden. Disability for<br />
each cancer was estimated by splitting<br />
the prevalence into four sequelae:<br />
diagnosis and primary treatment,<br />
controlled phase, metastatic phase and<br />
the terminal phase. Each prevalence<br />
sequelae were then multiplied with<br />
specific disability weights to see the<br />
‘years lived with disability’ (YLDs). The<br />
years of life lost (YLLs) was calculated<br />
from the age-specific mortality estimates<br />
and the reference life expectancy for<br />
that age group. DALYs were computed<br />
Maharashtra<br />
62.0<br />
80.2<br />
Goa<br />
52.5<br />
97.0<br />
Karnataka<br />
76.2<br />
101.6<br />
Kerala<br />
74.1<br />
135.3<br />
Andhra<br />
Pradesh<br />
58.1<br />
76.6<br />
Tamil Nadu<br />
58.9<br />
82.9<br />
Telengana<br />
54.9<br />
72.6<br />
W Bengal<br />
63.9<br />
85.4<br />
Chhattisgarh<br />
58.8<br />
82.0<br />
Odisha<br />
68.6<br />
83.6<br />
Incidence<br />
rate per<br />
100,000<br />
Mizoram<br />
89.1<br />
121.7<br />
Manipur<br />
48.1<br />
64.3<br />
> 105<br />
90-104.9<br />
75-89.0<br />
60-74.9<br />
45-59.9<br />
SOURCE: thelancet.com<br />
<strong>FEBRUARY</strong> <strong>2019</strong> / FUTURE MEDICINE / 55