

Rebirth of Water 2018-2019
Continued water quality monitoring throughout the City of Saint John and the Greater Saint John area helps to gain insight into the aquatic habitats that these watercourses provide, as well as their safety for recreational use for humans. The watercourses that have had continuous monitoring this year include: Marsh Creek, Inner Harbour, Newman’s Brook, Caledonia Brook, Alder Brook, Hazen Creek, Taylor Brook, Salmon Creek and Mispec River. Additional sampling sites were added this year on the west side of the City, which include Mill Creek, Spruce Lake Stream, Walker Creek, Mosquito Cove, Manawagonish Creek, and Dominion Park. These new locations were added this year to more accurately portray the water quality of the city’s waterways as a whole. Overall, the watercourses included in this year’s sampling all continue to have the capability to provide sufficient aquatic habitats for various forms of aquatic life. There are several factors that potentially affect the water courses such as stormwater runoff, sanitary sewer overflows and riparian degradation. The stormwater runoff and riparian degradation as well as the hot, dry weather led to elevated temperatures and slightly decreased dissolved oxygen levels as compared to previous years. On average, most sites this year saw an increase in orthophosphate concentration when compared to previous data. At this time, there is no official guideline or recommendation for orthophosphate levels in place. The considerable improvements of water quality parameters for aquatic life seen in Marsh Creek since the completion of Harbour Cleanup in 2014 solidifies that the funding and resources put into the project were much needed. The most notable difference in the water quality is the dissolved oxygen concentrations, although lower in 2018 than 2017, they are still above the Canadian Council of Ministers of the Environment guideline recommended concentration of 6.5 mg/L on average at all the sites sampled.
Continued water quality monitoring throughout the City of Saint John and the Greater Saint John area helps to gain insight into the aquatic habitats that these watercourses provide, as well as their safety for recreational use for humans. The watercourses that have had continuous monitoring this year include: Marsh Creek, Inner Harbour, Newman’s Brook, Caledonia Brook, Alder Brook, Hazen Creek, Taylor Brook, Salmon Creek and Mispec River. Additional sampling sites were added this year on the west side of the City, which include Mill Creek, Spruce Lake Stream, Walker Creek, Mosquito Cove, Manawagonish Creek, and Dominion Park. These new locations were added this year to more accurately portray the water quality of the city’s waterways as a whole.
Overall, the watercourses included in this year’s sampling all continue to have the capability to provide sufficient aquatic habitats for various forms of aquatic life. There are several factors that potentially affect the water courses such as stormwater runoff, sanitary sewer overflows and riparian degradation. The stormwater runoff and riparian degradation as well as the hot, dry weather led to elevated temperatures and slightly decreased dissolved oxygen levels as compared to previous years. On average, most sites this year saw an increase in orthophosphate concentration when compared to previous data. At this time, there is no official guideline or recommendation for orthophosphate levels in place.
The considerable improvements of water quality parameters for aquatic life seen in Marsh Creek since the completion of Harbour Cleanup in 2014 solidifies that the funding and resources put into the project were much needed. The most notable difference in the water quality is the dissolved oxygen concentrations, although lower in 2018 than 2017, they are still above the Canadian Council of Ministers of the Environment guideline recommended concentration of 6.5 mg/L on average at all the sites sampled.

Create successful ePaper yourself
Turn your PDF publications into a flip-book with our unique Google optimized e-Paper software.
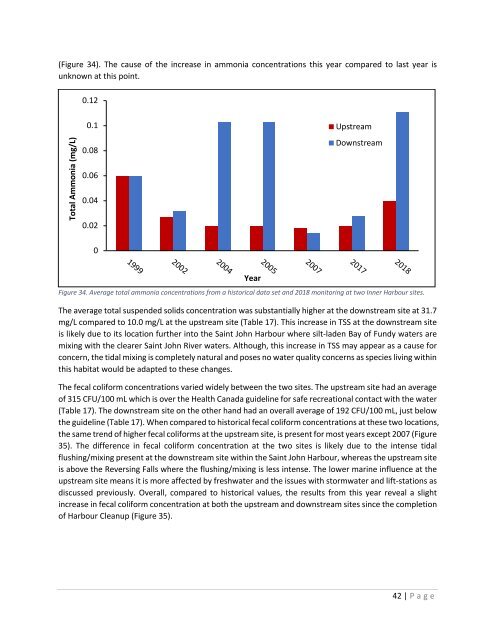
(Figure 34). The cause <strong>of</strong> the increase in ammonia concentrations this year compared to last year is<br />
unknown at this point.<br />
0.12<br />
Total Ammonia (mg/L)<br />
0.1<br />
0.08<br />
0.06<br />
0.04<br />
0.02<br />
Upstream<br />
Downstream<br />
0<br />
1999<br />
2002<br />
2004<br />
Figure 34. Average total ammonia concentrations from a historical data set and <strong>2018</strong> monitoring at two Inner Harbour sites.<br />
Year<br />
The average total suspended solids concentration was substantially higher at the downstream site at 31.7<br />
mg/L compared to 10.0 mg/L at the upstream site (Table 17). This increase in TSS at the downstream site<br />
is likely due to its location further into the Saint John Harbour where silt-laden Bay <strong>of</strong> Fundy waters are<br />
mixing with the clearer Saint John River waters. Although, this increase in TSS may appear as a cause for<br />
concern, the tidal mixing is completely natural and poses no water quality concerns as species living within<br />
this habitat would be adapted to these changes.<br />
The fecal coliform concentrations varied widely between the two sites. The upstream site had an average<br />
<strong>of</strong> 315 CFU/100 mL which is over the Health Canada guideline for safe recreational contact with the water<br />
(Table 17). The downstream site on the other hand had an overall average <strong>of</strong> 192 CFU/100 mL, just below<br />
the guideline (Table 17). When compared to historical fecal coliform concentrations at these two locations,<br />
the same trend <strong>of</strong> higher fecal coliforms at the upstream site, is present for most years except 2007 (Figure<br />
35). The difference in fecal coliform concentration at the two sites is likely due to the intense tidal<br />
flushing/mixing present at the downstream site within the Saint John Harbour, whereas the upstream site<br />
is above the Reversing Falls where the flushing/mixing is less intense. The lower marine influence at the<br />
upstream site means it is more affected by freshwater and the issues with stormwater and lift-stations as<br />
discussed previously. Overall, compared to historical values, the results from this year reveal a slight<br />
increase in fecal coliform concentration at both the upstream and downstream sites since the completion<br />
<strong>of</strong> Harbour Cleanup (Figure 35).<br />
2005<br />
2007<br />
2017<br />
<strong>2018</strong><br />
42 | P age


