Global Hearing Aid Market
The report analyzes the Hearing Aid Market By Product Type (Behind the Ear, In the Ear, Receiver in the Ear, In the Canal, Completely in the Canal, Others), By Type of Hearing Loss (Conductive, Sensorineural); By Technology (Analog, Digital), By Distribution Channel (Independent Sellers, Retailers, Wholesale, E- Commerce, Hospital Pharmacy, Others) and By End User (Pediatric, Adult). The hearing aid Market has been analyzed By Region (North America, Europe, Asia Pacific and Rest of the World) and By Country (US, Canada, UK, Germany, China, Japan, India, Brazil) for the historical period of 2014-2018 and the forecast period of 2019-2024. Request free Sample of this Report @: http://azothanalytics.com/report/healthcare-pharma/global-hearing-aid-market-world-market-review-and-analysis-by-technology-analog-digital-product-type-type-of-hearing-loss-end-user-sales-channel-2019-edition-opportunities-and-forecast-2014-2024-r33208 Visit us: http://azothanalytics.com/research/healthcare-pharma-c1
The report analyzes the Hearing Aid Market By Product Type (Behind the Ear, In the Ear, Receiver in the Ear, In the Canal, Completely in the Canal, Others), By Type of Hearing Loss (Conductive, Sensorineural); By Technology (Analog, Digital), By Distribution Channel (Independent Sellers, Retailers, Wholesale, E- Commerce, Hospital Pharmacy, Others) and By End User (Pediatric, Adult). The hearing aid Market has been analyzed By Region (North America, Europe, Asia Pacific and Rest of the World) and By Country (US, Canada, UK, Germany, China, Japan, India, Brazil) for the historical period of 2014-2018 and the forecast period of 2019-2024. Request free Sample of this Report @: http://azothanalytics.com/report/healthcare-pharma/global-hearing-aid-market-world-market-review-and-analysis-by-technology-analog-digital-product-type-type-of-hearing-loss-end-user-sales-channel-2019-edition-opportunities-and-forecast-2014-2024-r33208
Visit us: http://azothanalytics.com/research/healthcare-pharma-c1
Create successful ePaper yourself
Turn your PDF publications into a flip-book with our unique Google optimized e-Paper software.
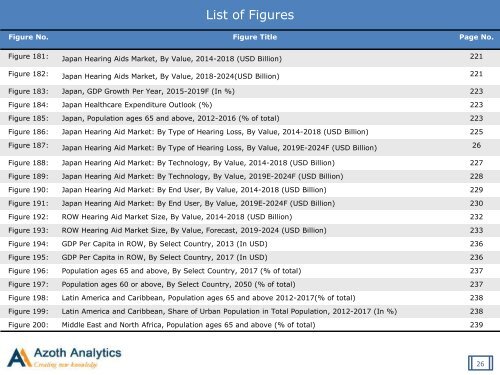
List of Figures<br />
Figure No. Figure Title Page No.<br />
Figure 181: Japan <strong>Hearing</strong> <strong>Aid</strong>s <strong>Market</strong>, By Value, 2014-2018 (USD Billion) 221<br />
Figure 182: Japan <strong>Hearing</strong> <strong>Aid</strong>s <strong>Market</strong>, By Value, 2018-2024(USD Billion) 221<br />
Figure 183: Japan, GDP Growth Per Year, 2015-2019F (In %) 223<br />
Figure 184: Japan Healthcare Expenditure Outlook (%) 223<br />
Figure 185: Japan, Population ages 65 and above, 2012-2016 (% of total) 223<br />
Figure 186: Japan <strong>Hearing</strong> <strong>Aid</strong> <strong>Market</strong>: By Type of <strong>Hearing</strong> Loss, By Value, 2014-2018 (USD Billion) 225<br />
Figure 187: Japan <strong>Hearing</strong> <strong>Aid</strong> <strong>Market</strong>: By Type of <strong>Hearing</strong> Loss, By Value, 2019E-2024F (USD Billion) 26<br />
Figure 188: Japan <strong>Hearing</strong> <strong>Aid</strong> <strong>Market</strong>: By Technology, By Value, 2014-2018 (USD Billion) 227<br />
Figure 189: Japan <strong>Hearing</strong> <strong>Aid</strong> <strong>Market</strong>: By Technology, By Value, 2019E-2024F (USD Billion) 228<br />
Figure 190: Japan <strong>Hearing</strong> <strong>Aid</strong> <strong>Market</strong>: By End User, By Value, 2014-2018 (USD Billion) 229<br />
Figure 191: Japan <strong>Hearing</strong> <strong>Aid</strong> <strong>Market</strong>: By End User, By Value, 2019E-2024F (USD Billion) 230<br />
Figure 192: ROW <strong>Hearing</strong> <strong>Aid</strong> <strong>Market</strong> Size, By Value, 2014-2018 (USD Billion) 232<br />
Figure 193: ROW <strong>Hearing</strong> <strong>Aid</strong> <strong>Market</strong> Size, By Value, Forecast, 2019-2024 (USD Billion) 233<br />
Figure 194: GDP Per Capita in ROW, By Select Country, 2013 (In USD) 236<br />
Figure 195: GDP Per Capita in ROW, By Select Country, 2017 (In USD) 236<br />
Figure 196: Population ages 65 and above, By Select Country, 2017 (% of total) 237<br />
Figure 197: Population ages 60 or above, By Select Country, 2050 (% of total) 237<br />
Figure 198: Latin America and Caribbean, Population ages 65 and above 2012-2017(% of total) 238<br />
Figure 199: Latin America and Caribbean, Share of Urban Population in Total Population, 2012-2017 (In %) 238<br />
Figure 200: Middle East and North Africa, Population ages 65 and above (% of total) 239<br />
26


