Estimation of Genetic Diversity among Oat Genotypes through Agro-morphological Traits
During the present study diverse germplasm comprising 124 oat accessions including three checks was evaluated for various quantitative agro-morphological traits in the research field of PGRI, NARC, Islamabad during the year 2013-14. The principal objective of the research was to study the magnitude of genetic diversity and relationships between different genotypes and to identify promising genotypes of oat for the traits of economical importance. The seed material was collected from diverse ecologies of Pakistan and USA. Most of the traits showed considerable variations. Analysis of variance showed highest variance for number of spikelets spike-1 followed by plant height, seed yield plant-1, days to 50% panicle initiation, days to maturity, leaf length, number of tillers plant-1, spike length, grains spikelet-1, 100 seed weight, leaves per tiller. Correlation analysis indicated that seed yield per plant was highly significantly and positively correlated with all the studied traits except days to 50% germination which showed non-significant relationship with seed yield per plant. PCA showed that 3 out of 13 PCs with eigen value of more than 1 accounted for 71.06% of the overall variations found among 124 genotypes of oat. Cluster analysis distributed 124 accessions of oat into five main clusters (I, II, III, IV & V) having 49, 1, 50, 21 and 3 genotypes. These outcomes can be successfully utilized for successful characterization and preservation of oat genetic resources.
During the present study diverse germplasm comprising 124 oat accessions including three checks was evaluated for various quantitative agro-morphological traits in the research field of PGRI, NARC, Islamabad during the year 2013-14. The principal objective of the research was to study the magnitude of genetic diversity and relationships between different genotypes and to identify promising genotypes of oat for the traits of economical importance. The seed material was collected from diverse ecologies of Pakistan and USA. Most of the traits showed considerable variations. Analysis of variance showed highest variance for number of spikelets spike-1 followed by plant height, seed yield plant-1, days to 50% panicle initiation, days to maturity, leaf length, number of tillers plant-1, spike length, grains spikelet-1, 100 seed weight, leaves per tiller. Correlation analysis indicated that seed yield per plant was highly significantly and positively correlated with all the studied traits except days to 50% germination which showed non-significant relationship with seed yield per plant. PCA showed that 3 out of 13 PCs with eigen value of more than 1 accounted for 71.06% of the overall variations found among 124 genotypes of oat. Cluster analysis distributed 124 accessions of oat into five main clusters (I, II, III, IV & V) having 49, 1, 50, 21 and 3 genotypes. These outcomes can be successfully utilized for successful characterization and preservation of oat genetic resources.
You also want an ePaper? Increase the reach of your titles
YUMPU automatically turns print PDFs into web optimized ePapers that Google loves.
Int. J. Biosci. 2016<br />
Gene bank <strong>of</strong> Plant <strong>Genetic</strong> Resources Institute<br />
(PGRI). Out <strong>of</strong> these 124 accessions, 114 accessions<br />
belong to Avena sativa L. while remaining 10<br />
accessions belong to Avena fatua L. The germplasm<br />
were evaluated for different qualitative and<br />
quantitative agro-<strong>morphological</strong> traits. The<br />
experiment was planted on 28 th November, 2013 at<br />
Pakistan <strong>Genetic</strong> Resource Institute (PGRI) field in<br />
the augmented design. Row length was maintained at<br />
3m, row to row distance was kept at 50cm having one<br />
accession per row.<br />
<strong>Agro</strong>nomic practices<br />
All agronomic practices such as land preparation,<br />
weeding, irrigation etc were uniformly applied.<br />
Morphological data was recorded on five selected<br />
plants according to descriptors <strong>of</strong> International<br />
Board <strong>of</strong> Plant <strong>Genetic</strong> Resources (IBPGR) for oat.<br />
Statistical analysis<br />
Quantitative traits that were recorded during the<br />
present study includes days to 50% germination, days<br />
to 50% panicle initiation, plant height, leaf length,<br />
leaf width, number <strong>of</strong> tillers plant-1, number <strong>of</strong> leaves<br />
tiller-1, days to maturity, spike length, number <strong>of</strong><br />
grains spikelet-1, number <strong>of</strong> spikelets spike-1, seed<br />
yield plant-1 and 100-seed weight.<br />
.All the recorded data was averaged and the means <strong>of</strong><br />
all the accessions were analyzed for simple<br />
statistics (mean, standard deviation, coefficient <strong>of</strong><br />
variation and variance) <strong>among</strong> all the genotypes for<br />
different parameters. Simple correlation coefficient<br />
was calculated <strong>through</strong> the procedure <strong>of</strong> Steel and<br />
Torrie (1980) by means <strong>of</strong> plot mean values using<br />
s<strong>of</strong>tware statistica 7.0. The agro-<strong>morphological</strong> traits<br />
recorded during the present study were also analyzed<br />
by arithmetical taxonomic techniques <strong>through</strong><br />
multivariate analysis including cluster and principle<br />
component analysis followed by Sneath and Sokal,<br />
(1973). Means <strong>of</strong> all the traits were standardized<br />
<strong>through</strong> Z-scores to avoid the effects <strong>of</strong> scaling<br />
differences before the multivariate analysis.<br />
Euclidean distances coefficient were determined for<br />
the total pairs <strong>of</strong> genotypes. Resultant Euclidean<br />
distances coefficient matrices were used to assess the<br />
association <strong>among</strong> the oat genotypes <strong>through</strong> cluster<br />
analysis (NTSYS-pc, version 2.1). Furthermore, PCA<br />
(principal component analysis) was performed<br />
<strong>through</strong> the similar data matrix. The first three<br />
principle components were plotted to observe the<br />
differences between the studied accessions (Statistica,<br />
Version 7.0).<br />
Results and discussions<br />
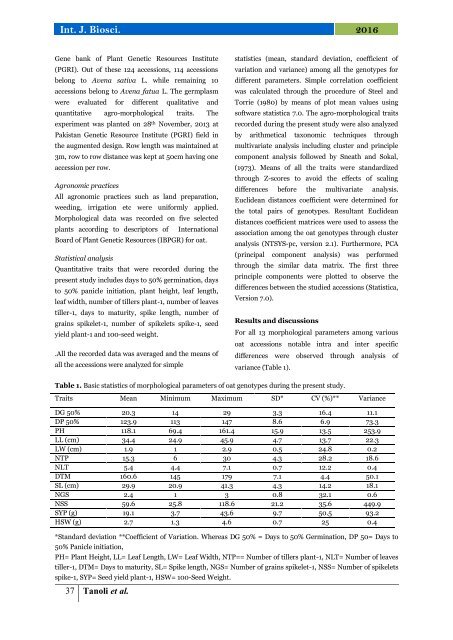
For all 13 <strong>morphological</strong> parameters <strong>among</strong> various<br />
oat accessions notable intra and inter specific<br />
differences were observed <strong>through</strong> analysis <strong>of</strong><br />
variance (Table 1).<br />
Table 1. Basic statistics <strong>of</strong> <strong>morphological</strong> parameters <strong>of</strong> oat genotypes during the present study.<br />
<strong>Traits</strong> Mean Minimum Maximum SD* CV (%)** Variance<br />
DG 50% 20.3 14 29 3.3 16.4 11.1<br />
DP 50% 123.9 113 147 8.6 6.9 73.3<br />
PH 118.1 69.4 161.4 15.9 13.5 253.9<br />
LL (cm) 34.4 24.9 45.9 4.7 13.7 22.3<br />
LW (cm) 1.9 1 2.9 0.5 24.8 0.2<br />
NTP 15.3 6 30 4.3 28.2 18.6<br />
NLT 5.4 4.4 7.1 0.7 12.2 0.4<br />
DTM 160.6 145 179 7.1 4.4 50.1<br />
SL (cm) 29.9 20.9 41.3 4.3 14.2 18.1<br />
NGS 2.4 1 3 0.8 32.1 0.6<br />
NSS 59.6 25.8 118.6 21.2 35.6 449.9<br />
SYP (g) 19.1 3.7 43.6 9.7 50.5 93.2<br />
HSW (g) 2.7 1.3 4.6 0.7 25 0.4<br />
*Standard deviation **Coefficient <strong>of</strong> Variation. Whereas DG 50% = Days to 50% Germination, DP 50= Days to<br />
50% Panicle initiation,<br />
PH= Plant Height, LL= Leaf Length, LW= Leaf Width, NTP== Number <strong>of</strong> tillers plant-1, NLT= Number <strong>of</strong> leaves<br />
tiller-1, DTM= Days to maturity, SL= Spike length, NGS= Number <strong>of</strong> grains spikelet-1, NSS= Number <strong>of</strong> spikelets<br />
spike-1, SYP= Seed yield plant-1, HSW= 100-Seed Weight.<br />
37 Tanoli et al.


