Elder Index Summary for IFP

You also want an ePaper? Increase the reach of your titles
YUMPU automatically turns print PDFs into web optimized ePapers that Google loves.
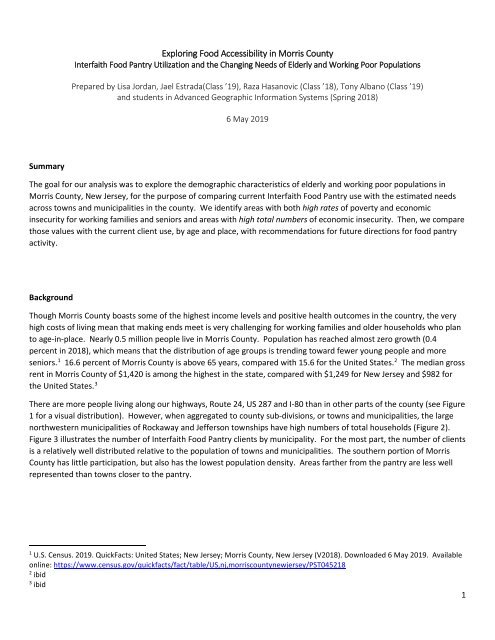
Exploring Food Accessibility in Morris County<br />
Interfaith Food Pantry Utilization and the Changing Needs of <strong>Elder</strong>ly and Working Poor Populations<br />
Prepared by Lisa Jordan, Jael Estrada(Class ’19), Raza Hasanovic (Class ’18), Tony Albano (Class ’19)<br />
and students in Advanced Geographic In<strong>for</strong>mation Systems (Spring 2018)<br />
6 May 2019<br />
<strong>Summary</strong><br />
The goal <strong>for</strong> our analysis was to explore the demographic characteristics of elderly and working poor populations in<br />
Morris County, New Jersey, <strong>for</strong> the purpose of comparing current Interfaith Food Pantry use with the estimated needs<br />
across towns and municipalities in the county. We identify areas with both high rates of poverty and economic<br />
insecurity <strong>for</strong> working families and seniors and areas with high total numbers of economic insecurity. Then, we compare<br />
those values with the current client use, by age and place, with recommendations <strong>for</strong> future directions <strong>for</strong> food pantry<br />
activity.<br />
Background<br />
Though Morris County boasts some of the highest income levels and positive health outcomes in the country, the very<br />
high costs of living mean that making ends meet is very challenging <strong>for</strong> working families and older households who plan<br />
to age-in-place. Nearly 0.5 million people live in Morris County. Population has reached almost zero growth (0.4<br />
percent in 2018), which means that the distribution of age groups is trending toward fewer young people and more<br />
seniors. 1 16.6 percent of Morris County is above 65 years, compared with 15.6 <strong>for</strong> the United States. 2 The median gross<br />
rent in Morris County of $1,420 is among the highest in the state, compared with $1,249 <strong>for</strong> New Jersey and $982 <strong>for</strong><br />
the United States. 3<br />
There are more people living along our highways, Route 24, US 287 and I-80 than in other parts of the county (see Figure<br />
1 <strong>for</strong> a visual distribution). However, when aggregated to county sub-divisions, or towns and municipalities, the large<br />
northwestern municipalities of Rockaway and Jefferson townships have high numbers of total households (Figure 2).<br />
Figure 3 illustrates the number of Interfaith Food Pantry clients by municipality. For the most part, the number of clients<br />
is a relatively well distributed relative to the population of towns and municipalities. The southern portion of Morris<br />
County has little participation, but also has the lowest population density. Areas farther from the pantry are less well<br />
represented than towns closer to the pantry.<br />
1<br />
U.S. Census. 2019. QuickFacts: United States; New Jersey; Morris County, New Jersey (V2018). Downloaded 6 May 2019. Available<br />
online: https://www.census.gov/quickfacts/fact/table/US,nj,morriscountynewjersey/PST045218<br />
2<br />
ibid<br />
3<br />
ibid<br />
1
Figure 1. Population Distribution of Morris County, New Jersey, Gridded Population of the World, Version 5, 2015. 4<br />
Available online. (The population over 65 can be explored here.)<br />
4<br />
Center <strong>for</strong> International Earth Science In<strong>for</strong>mation Network – CIESIN – Columbia University. 2018. Gridded Population of the World,<br />
Version 4 (GPWv4): Population Count, Revision 11. Palisades, NY: NASA Socioeconomic Data and Applications Center (SEDAC).<br />
https://doi.org/10/7927/H4JW8BX5. Accessed 6 May 2019.<br />
2
Figure 2. Total Households by Municipality, American Community Survey (2013-2017) 5-Year Average, Available online.<br />
Figure 3. Morris County Interfaith Food Pantry Clients (2017) by Municipality<br />
Where are the working poor in Morris County, and How Well Are They Served?<br />
The United Way has developed a measure to help expand the idea of economic insecurity from beyond measures of<br />
poverty to include families that are working, but struggling to make ends meet. The acronym <strong>for</strong> their index is ALICE:<br />
3
Asset Limited, Income Constrained, Employed. 5 New Jersey was a pilot of the ALICE project, and data <strong>for</strong> county subdivisions<br />
is available <strong>for</strong> 2010, 2012, 2014 and 2016. According to the most recent United Way County Factsheets, 24<br />
percent of households in Morris County can be described as ALICE. 6 ALICE has increased during each iteration of the<br />
project from 18 to 24 percent, even while poverty has remained fairly constant (see Figure 4). Figure 5 highlights the<br />
number of ALICE households in Morris County by municipality.<br />
Figure 4. Household Summaries <strong>for</strong> Morris County, Reproduced from the ALICE New Jersey County Report, p. 27. 7<br />
Compared with the population distribution map, the distribution of ALICE households is more uneven.<br />
5<br />
United Way. 2018. ALICE: A Study of Financial Hardship in New Jersey. October 19. Downloaded 6 May 2019. Available online:<br />
https://www.dropbox.com/s/h3huycfbak512t2/18_UW_ALICE_Report_NJ_Update_10.19.18_Lowres.pdf?dl=0<br />
6<br />
United Way. 2018. ALICE: County Pages. August 13. Downloaded 6 May 2019. Available online:<br />
https://www.dropbox.com/s/tvoyrbq737q9fm9/18UW%20ALICE%20Report_COUNTY_NJ_8.13.18_FINAL.pdf?dl=0 (Morris County,<br />
p. 27-28).<br />
7<br />
Ibid, p. 27.<br />
4
Figure 5. ALICE Households (2016) in Morris County, Data from United Way 8 . Available online.<br />
It is also important to note that the concentration of ALICE populations differs from the locations of total number of<br />
ALICE households. Figure 6 shows the number of ALICE households divided by the total number of households. When<br />
compared with Figure 5, it is useful to note that some areas with small numbers, such as Victory Gardens, Netcong,<br />
Mountain Lakes Borough, and Mine Hill Township, have high concentrations of working poor.<br />
Figure 6. ALICE Households (2016) as a Proportion of Total Households (2013-2017), Available online.<br />
8<br />
United Way. 2018. New Jersey State Level Details: Data File. Sheet: Sub-County. Downloaded 6 May 2019. Available online:<br />
https://www.dropbox.com/s/c8rjxuffmgk8ddr/18UW_ALICE_Report_NJ_Data%20Sheet.xlsx?dl=0<br />
5
The question is: how well is <strong>IFP</strong> work distributed among the working poor? To answer this question Figures 7 and 8<br />
illustrate bivariate charts and a bivariate map to visualize the relationship between ALICE households and <strong>IFP</strong> clients.<br />
Morristown<br />
Above<br />
Average<br />
ALICE:<br />
Above<br />
Average <strong>IFP</strong><br />
Jefferson<br />
Pequannock<br />
Parsippany<br />
Troy-Hills<br />
Above Average ALICE:<br />
Below Average <strong>IFP</strong><br />
Non-standardized Scatterplot<br />
Standardized Scatterplot<br />
Figure 7. Scatterplots of the Relationship between ALICE Households and <strong>IFP</strong> Clients<br />
Figure 8. Thematic Map of the Relationship between ALICE Households and <strong>IFP</strong> Clients, available online.<br />
6
The message from Figures 7 and Figure 8 is that the number of working poor households are over-represented in<br />
Pequannock, Jefferson and Morris Townships, but under-represented in the number of <strong>IFP</strong> clients served in those<br />
communities. Under-representation in Morris Township could simply be an artifact of data collection, since it may be<br />
possible the clients from Morris Township are mistakenly placed in the Morristown total. Further study of this would be<br />
needed.<br />
Where are Economically Insecure Seniors and How Well Are They Served?<br />
The <strong>Elder</strong> <strong>Index</strong> was developed by the University of Massachusetts Boston Gerontology Institute (GI) to measure the<br />
costs of living <strong>for</strong> older adults and to estimate adequate income necessary to “age in place.” 9,10 Not surprisingly,<br />
housing situation significantly influences the capacity of elders to meet their needs and to adapt to significant life<br />
changes. House ownership status, with or without a mortgage, and marital status were identified as the most significant<br />
factors in determining the elder index. Northern New Jersey, including Morris County, was found to have the highest<br />
costs of living and the highest costs of long-term care. According to the New Jersey Department of Health and latest<br />
report on the <strong>Elder</strong> <strong>Index</strong>, “In every county in the state, elders who live at the federal poverty level, or are totally<br />
dependent on the average Social Security benefit in 2016, need housing and health care supports to make ends meet.” 11<br />
Using GI methodology, the New Jersey Foundation <strong>for</strong> Aging produced county fact sheets <strong>for</strong> the state, finding that in<br />
the five years between 2009 and 2015, the elder index increased between five and twelve percent, depending on the<br />
housing and marital status of elders. 12 All seniors at or below the federal poverty line were below the <strong>Elder</strong> <strong>Index</strong>, and<br />
an additional 27 percent of seniors (9,725 households) were identified as falling below the <strong>Elder</strong> <strong>Index</strong> in Morris County.<br />
The minimum income needed to meet housing, food, transportation, health care (in times of good health) and<br />
miscellaneous expenses was calculated as $27,228 <strong>for</strong> single households over 65, and $38,712 <strong>for</strong> elder couples. The<br />
minimum values are found <strong>for</strong> households that are home owners without a mortgage. The maximum elder index values,<br />
<strong>for</strong> individuals with a mortgage, was $39,480 <strong>for</strong> individuals and $50,964 <strong>for</strong> couples.<br />
The Interfaith Food Pantry has expressed an interest in meeting the needs of elders falling in the gap. <strong>Elder</strong> needs within<br />
our county is limited by household home ownership by age, income and marital status at the county-sub-division. Using<br />
income and age tables from the US Census American Community Survey estimates, 2013-2017, we can identify a<br />
baseline number of households in the <strong>Elder</strong> <strong>Index</strong>. Figure 9 highlights the geographic distribution of economically<br />
insecure senior households in Morris County, identifying senior households with incomes less than $25,000 per year.<br />
Figure 10 illustrates the proportion of <strong>Elder</strong> <strong>Index</strong> Households in municipalities, ranging from 2.5-7.7 percent. Figure 11<br />
shows the number of <strong>IFP</strong> clients who are seniors by township.<br />
9<br />
Gerontology Institute, University of Massachusetts Boston. 2012. “The National <strong>Elder</strong> Economic Security Standard <strong>Index</strong>.”<br />
Gerontology Institute Publications. Paper 75.<br />
http://scholarworks.umb.edu/gerontologyinstitute_pubs/75?utm_source=scholarworks.umb.edu%2Fgerontologyinstitute_pubs%2F<br />
75&utm_medium=PDF&utm_campaign=PDFCoverPages<br />
10<br />
New Jersey Department of Human Services (NJ DHS). 2018. The 2016 New Jersey <strong>Elder</strong> Economic Security Standard <strong>Index</strong>.<br />
January. Available at: https://www.state.nj.us/humanservices/news/reports/NJ%20EESSI%202016%20-%200118.pdf<br />
11<br />
Ibid, p. 32.<br />
12<br />
New Jersey Foundation <strong>for</strong> Aging. 2014 <strong>Elder</strong> Economic Security Standard <strong>Index</strong>, County Fact Sheets. p. 20-21. Available at:<br />
https://www.njfoundation<strong>for</strong>aging.org/storage/2013/12/County-Fact-Sheets1.pdf.<br />
7
Figure 9. <strong>Elder</strong> <strong>Index</strong>: Number of Households (2013-2017) by Municipality, Available online.<br />
Figure 10. <strong>Elder</strong> <strong>Index</strong> Households as a Proportion of Total Households (2013-2017) by Municipality, Available online.<br />
8
Figure 11. Morris County – Interfaith Food Pantry Senior Clients (2017), available online.<br />
To further explore the ratio of elder to working poor in Morris County, Figure 12 compares the <strong>Elder</strong> <strong>Index</strong> to ALICE, and<br />
the percent of <strong>IFP</strong> clients who are seniors.<br />
Ratio of <strong>Elder</strong> <strong>Index</strong> to ALICE, as Percent (online map)<br />
Percent of <strong>IFP</strong> Clients That Are Seniors (online map)<br />
Figure 12. Comparison of <strong>Elder</strong> to ALICE Ratios across Morris County Towns, and Percent of <strong>IFP</strong> Clients Who Are Seniors<br />
How well is <strong>IFP</strong> work distributed among the elderly populations who are economically insecure? To answer this question<br />
Figures 13 and 14 illustrate bivariate charts and a bivariate map to visualize the relationship between elder index<br />
households and <strong>IFP</strong> clients.<br />
9
Morristown<br />
Above<br />
Average EI:<br />
Above<br />
Average <strong>IFP</strong><br />
Parsippany<br />
Troy-Hills<br />
Florham Park<br />
Pequannock<br />
Above Average EI:<br />
Below Average <strong>IFP</strong><br />
Non-standardized Scatterplot<br />
Standardized Scatterplot<br />
Figure 13. Scatterplots of the Relationship between the <strong>Elder</strong> <strong>Index</strong> Households and <strong>IFP</strong> Clients<br />
Figure 14. Thematic Map of the Relationship between ALICE Households and <strong>IFP</strong> Clients, available online.<br />
As found with ALICE populations, elder population with high need and high <strong>IFP</strong> visibility are in Morristown and<br />
Parsippany. <strong>Elder</strong>ly populations with high need and below average <strong>IFP</strong> visibility include Pequannock and Florham Park.<br />
10
The data prepared <strong>for</strong> this report can be found both in the maps, with embedded tables, and from the spreadsheet<br />
available here.<br />
We had hoped to create and provide a <strong>for</strong>ecast of aging populations in Morris County. This provided to be too uncertain<br />
with available data. Forecasting the <strong>Elder</strong> <strong>Index</strong> into the future will depend on two trends: our aging populations and<br />
changes in the cost of living.<br />
11