UNICEF, The Financial and Economic Impact of Swachh Bharat Mission in India, 2017

Create successful ePaper yourself
Turn your PDF publications into a flip-book with our unique Google optimized e-Paper software.
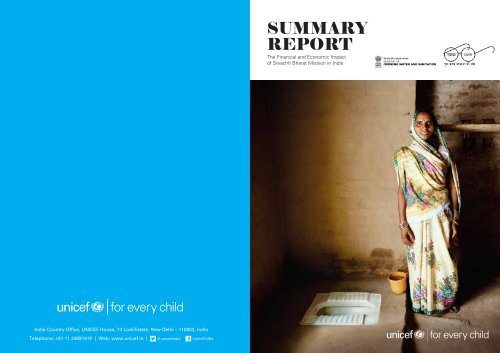
SUMMARY<br />
REPORT<br />
<strong>The</strong> <strong>F<strong>in</strong>ancial</strong> <strong>and</strong> <strong>Economic</strong> <strong>Impact</strong><br />
<strong>of</strong> <strong>Swachh</strong> <strong>Bharat</strong> <strong>Mission</strong> <strong>in</strong> <strong>India</strong><br />
<strong>India</strong> Country Office, <strong>UNICEF</strong> House, 73 Lodi Estate, New Delhi – 110003, <strong>India</strong><br />
Telephone: +91 11 24691410 | Web: www.unicef.<strong>in</strong> | @unicef<strong>in</strong>dia /unicef<strong>in</strong>dia
Interim report on SBM costs <strong>and</strong> benefits<br />
<strong>UNICEF</strong> was requested by the M<strong>in</strong>istry <strong>of</strong> Dr<strong>in</strong>k<strong>in</strong>g Water <strong>and</strong> Sanitation to conduct a study to assess the economic<br />
impacts <strong>of</strong> the <strong>Swachh</strong> <strong>Bharat</strong> Gram<strong>in</strong> <strong>in</strong> rural areas. Key f<strong>in</strong>d<strong>in</strong>gs were as follows:<br />
• On an average households <strong>in</strong> ODF villages accrued cumulative benefits <strong>of</strong> Rs.50,000 per year<br />
• Households with a toilet saw a property <strong>in</strong>crease <strong>of</strong> Rs.19,000<br />
• On an average, total benefits exceed costs by 4.7 times for households<br />
<strong>UNICEF</strong> implemented an <strong>in</strong>dependent survey on a sample <strong>of</strong> 18,376 respondents represent<strong>in</strong>g 10,068 rural households,<br />
r<strong>and</strong>omly selected from 550 Gram Panchayats across 12 states account<strong>in</strong>g for 90% <strong>of</strong> open defecation <strong>in</strong> <strong>India</strong><br />
1 . <strong>The</strong> survey was carried out from 20 July – 11 August <strong>2017</strong>. This <strong>in</strong>terim reports provides an overview <strong>of</strong> key<br />
f<strong>in</strong>d<strong>in</strong>gs, show<strong>in</strong>g differences between population ‘qu<strong>in</strong>tiles’ reflect<strong>in</strong>g household wealth, based on an asset <strong>in</strong>dex.<br />
SBM Costs per wealth qu<strong>in</strong>tile<br />
SBM Benefits per wealth qu<strong>in</strong>tile<br />
<strong>The</strong> study results presented below considered 4 types <strong>of</strong> benefit that accrue to households from hav<strong>in</strong>g a household<br />
latr<strong>in</strong>e <strong>and</strong> us<strong>in</strong>g it. A fifth type, reuse/recycl<strong>in</strong>g <strong>of</strong> excreta <strong>and</strong> organic waste, is also expected to provide<br />
an important benefit which will be analysed <strong>in</strong> a separate study.<br />
1) Medical costs averted: f<strong>in</strong>ancial sav<strong>in</strong>gs from pay<strong>in</strong>g less medical costs based on reductions <strong>in</strong> illness<br />
episodes (average INR 8,024 per household per year).<br />
2) Value <strong>of</strong> time sav<strong>in</strong>gs: reduced time lost from sickness <strong>and</strong> seek<strong>in</strong>g a place for open defecation (average INR<br />
24,646 per household per year).<br />
3) Value <strong>of</strong> saved lives: economic value <strong>of</strong> saved lives due to lower mortality rates (average INR 17,622 per household<br />
per year).<br />
4) Property value: Rs 18,991 per household was estimated as the average <strong>in</strong>crease <strong>in</strong> property value from hav<strong>in</strong>g<br />
a latr<strong>in</strong>e, made by the household occupants. In the analysis, it is a one-<strong>of</strong>f cash benefits that is assumed to<br />
accrue at the end <strong>of</strong> a 10 year period.<br />
To estimate SBM (G) costs, the study considered three types <strong>of</strong> expenditures:<br />
1) <strong>F<strong>in</strong>ancial</strong> costs paid by household from own funds. On average: INR 9,942 was spent by those receiv<strong>in</strong>g<br />
government support, <strong>and</strong> INR 29,900 by those not receiv<strong>in</strong>g any government support, thus averag<strong>in</strong>g INR<br />
16,262 across all households. Spend<strong>in</strong>g on operations <strong>and</strong> ma<strong>in</strong>tenance O&M) costs averaged INR 2,359 per<br />
year (see columns labelled 1. In table).<br />
1<br />
2<br />
3<br />
4<br />
2) <strong>F<strong>in</strong>ancial</strong> <strong>in</strong>vestment from the government. 70% <strong>of</strong> sampled households reported to have received support for<br />
capital <strong>in</strong>vestment. <strong>The</strong> f<strong>in</strong>ancial <strong>in</strong>centive to these households averaged INR 11,800 per household, or an average<br />
<strong>of</strong> INR 8,199 per household across all households obta<strong>in</strong><strong>in</strong>g latr<strong>in</strong>es. In addition, the average s<strong>of</strong>tware cost<br />
is estimated at INR 960 per household= (8% <strong>of</strong> INR 12,000).<br />
Medical costs<br />
averted<br />
Value <strong>of</strong> time<br />
sav<strong>in</strong>gs<br />
Value <strong>of</strong> saved<br />
lives<br />
Property value<br />
3) Non-f<strong>in</strong>ancial costs covered by household <strong>in</strong>cluded time <strong>in</strong> build<strong>in</strong>g, clean<strong>in</strong>g <strong>and</strong> ma<strong>in</strong>ta<strong>in</strong><strong>in</strong>g the latr<strong>in</strong>e (see<br />
columns labelled 3. <strong>in</strong> table). Time is valued at the rural wage rate <strong>of</strong> INR 250 per day.<br />
Group<br />
1.<strong>F<strong>in</strong>ancial</strong> costs paid by<br />
household from own funds<br />
2. <strong>F<strong>in</strong>ancial</strong> costs paid by<br />
government <strong>and</strong> household<br />
3. Non-f<strong>in</strong>ancial costs (time)<br />
covered by household<br />
Group<br />
All<br />
Medical costs<br />
averted<br />
INR 8,024<br />
Annual benefits at 100% latr<strong>in</strong>e usage<br />
Value <strong>of</strong><br />
time sav<strong>in</strong>gs<br />
INR 24,646<br />
Value <strong>of</strong><br />
saved lives<br />
INR 17,622<br />
Total<br />
INR 50,482<br />
Property value<br />
(one-<strong>of</strong>f benefit)<br />
INR 18,991<br />
Investment<br />
Annual O&M<br />
Investment<br />
Annual O&M<br />
Investment<br />
Annual O&M<br />
Poorest<br />
INR 6,599<br />
INR 21,466<br />
INR 20,184<br />
INR 48,613<br />
INR 11,757<br />
All<br />
INR 16,626<br />
INR 2,359<br />
INR 25,785<br />
INR 2,359<br />
INR 1,007<br />
INR 6,082<br />
Q2<br />
INR 5,940<br />
INR 24,869<br />
INR 18,853<br />
INR 49,781<br />
INR 16,884<br />
Poorest<br />
INR 6,971<br />
INR 1,743<br />
INR 17,622<br />
INR 1,743<br />
INR 1,192<br />
INR 4,189<br />
Q3<br />
INR 7,278<br />
INR 23,361<br />
INR 16,650<br />
INR 47,289<br />
INR 18,698<br />
Q2<br />
INR 13,874<br />
INR 2,286<br />
INR 23,659<br />
INR 2,286<br />
INR 917<br />
INR 5,104<br />
Q4<br />
INR 8,961<br />
INR 26,337<br />
INR 15,665<br />
INR 51,246<br />
INR 20,808<br />
Q3<br />
INR 16,499<br />
INR 2,397<br />
INR 25,842<br />
INR 2,397<br />
INR 803<br />
INR 5,958<br />
Richest<br />
INR 13,182<br />
INR 28,614<br />
INR 16,813<br />
INR 58,905<br />
INR 26,144<br />
Q4<br />
INR 19,160<br />
INR 2,653<br />
INR 27,923<br />
INR 2,653<br />
INR 744<br />
INR 6,772<br />
Richest<br />
INR 26,613<br />
INR 2,752<br />
INR 33,801<br />
INR 2,752<br />
INR 895<br />
INR 8,650<br />
<strong>The</strong> table shows cost data for five qu<strong>in</strong>tiles as well as overall. It is clear that households from poorer qu<strong>in</strong>tiles spent less <strong>of</strong> their own resources <strong>and</strong> received more government<br />
support: 82% <strong>of</strong> households <strong>in</strong> poorest qu<strong>in</strong>tile received government support compared to 53% <strong>in</strong> the richest qu<strong>in</strong>tile. Consequently, the poorest households received about INR<br />
3,500 more, on average, than the richest households. Poorer households also <strong>in</strong>vested more <strong>of</strong> their own time <strong>in</strong> toilet construction (see <strong>in</strong>vestment column labelled 3. <strong>in</strong> table).<br />
1<br />
Andhra Pradesh, Assam, Bihar, Jharkh<strong>and</strong>, Bihar, Madhya Pradesh, Maharashtra, Odisha, Rajasthan, Tamil Nadu, Telangana <strong>and</strong> Uttar Pradesh<br />
2<br />
<strong>The</strong>re is <strong>in</strong>deed considerable potential to safely reuse human excreta <strong>in</strong> <strong>India</strong>, given the survey found 40% <strong>of</strong> households to have a double pit<br />
latr<strong>in</strong>e. However, when asked, only 14.5% <strong>of</strong> households said they plan to use it as a compost <strong>in</strong> their plot <strong>and</strong> 0.6% plan to sell it. Currently<br />
80% <strong>of</strong> households with animals reuse the animal excreta <strong>in</strong> some way, <strong>and</strong> 40% <strong>of</strong> households compost their organic waste. Hence there is<br />
still some potential for clos<strong>in</strong>g the sanitation value cha<strong>in</strong>, <strong>and</strong> reus<strong>in</strong>g more household <strong>and</strong> farm waste. However, it will need more <strong>in</strong>-depth<br />
scientific study to value these waste accurately. For adults, if they say they lost <strong>in</strong>come, then that <strong>in</strong>come was recorded.<br />
3<br />
For other adults, value <strong>of</strong> time was INR 250 per day (rural unskilled wage, NREGS). For children <strong>of</strong> school age, 50% <strong>of</strong> rural wage was used.
SBM Cost-Benefits<br />
When costs <strong>and</strong> benefits are compared over a 10 year time period 3 , the f<strong>in</strong>ancial sav<strong>in</strong>gs exceed the f<strong>in</strong>ancial<br />
costs to the household by 1.7 times, on average. For the poorest households, the value is higher at 2.4 times (see<br />
column 1. <strong>in</strong> table).<br />
When household time sav<strong>in</strong>gs (from closer latr<strong>in</strong>e access <strong>and</strong> less sickness) <strong>and</strong> the time for clean<strong>in</strong>g <strong>and</strong> ma<strong>in</strong>ta<strong>in</strong><strong>in</strong>g<br />
the latr<strong>in</strong>e are valued, the benefits exceed costs by 3.0 times (see column 2. <strong>in</strong> table). When benefits <strong>of</strong><br />
lives saved are <strong>in</strong>cluded, the benefits exceed costs by 4.7 times (see column 3. <strong>in</strong> table). If the government contribution<br />
to the latr<strong>in</strong>e cost is <strong>in</strong>cluded, reflect<strong>in</strong>g a broader societal perspective, the benefits exceed costs by 4.3<br />
times (see column 4. <strong>in</strong> table).<br />
Convenience <strong>of</strong> a nearby latr<strong>in</strong>e<br />
Convenience at night or dur<strong>in</strong>g ra<strong>in</strong>s<br />
Convenience for menstruation<br />
Convenience to elder house hold members<br />
Privacy dur<strong>in</strong>g defecation<br />
Improves status or prestige<br />
Reduces diseases<br />
100% Use <strong>of</strong> sanitation <strong>and</strong> hygiene facilities<br />
Safety for girls <strong>and</strong> women<br />
Group<br />
1. Household<br />
f<strong>in</strong>ancial<br />
perspective<br />
2. Household<br />
f<strong>in</strong>ancial<br />
perspective + time<br />
3. Household<br />
f<strong>in</strong>ancial perspective<br />
+ time impact + lives<br />
4. Societal perspective<br />
(<strong>in</strong>cludes government<br />
subsidy)<br />
Cleanl<strong>in</strong>ess <strong>and</strong> hygienic<br />
0% 10% 20% 30% 40% 50% 60% 70% 80% 90% 100%<br />
All<br />
1.7<br />
3.0<br />
4.7<br />
4.3<br />
Strongly Agree Agree Neutral Disagree Strongly Disagree<br />
Poorest<br />
2.4<br />
4.0<br />
7.0<br />
5.8<br />
Q2<br />
1.4<br />
3.3<br />
5.4<br />
4.7<br />
In conclusion, this study has shown that the<br />
<strong>Swachh</strong> <strong>Bharat</strong> Gram<strong>in</strong> is highly cost-beneficial<br />
from both a f<strong>in</strong>ancial <strong>and</strong> an economic<br />
Q3<br />
Q4<br />
Richest<br />
1.6<br />
1.7<br />
2.1<br />
2.9<br />
2.9<br />
2.8<br />
4.5<br />
4.3<br />
4.0<br />
4.0<br />
3.9<br />
3.7<br />
perspective. It should also be noted that some<br />
benefits <strong>of</strong> improved sanitation have not been<br />
quantified <strong>in</strong> this study (reuse value, tourism<br />
value, impact on water quality) or not quantified<br />
fully (e.g. some diseases could not be assessed<br />
due to lack <strong>of</strong> <strong>India</strong>- wide data, e.g. Hepatitis A<br />
<strong>and</strong> E, soil-transmitted helm<strong>in</strong>thes).<br />
<strong>The</strong> figure (on adjacent page) shows the <strong>in</strong>tangible benefits which are hard to quantify <strong>in</strong> monetary terms, but are<br />
largely <strong>in</strong> addition to the benefits evaluated above. <strong>The</strong> results <strong>in</strong>dicate very strongly that household toilets have<br />
a range <strong>of</strong> important benefits, as perceived by households, cover<strong>in</strong>g convenience, privacy, safety <strong>and</strong> status<br />
aspects.<br />
<strong>The</strong> two impacts with approximately 10% <strong>of</strong> households rais<strong>in</strong>g some doubts over are the disease <strong>and</strong> cleanl<strong>in</strong>ess<br />
aspects – which are unlikely to perform well if the toilet is not cleaned properly.<br />
Hence the f<strong>in</strong>ancial <strong>and</strong> economic costs will be<br />
greater than those presented here. Furthermore,<br />
the impacts <strong>of</strong> reduc<strong>in</strong>g sanitation - related<br />
diseases such as diarrhea <strong>and</strong> tropical<br />
enteropathy go way beyond the saved medical<br />
expenditure <strong>and</strong> time <strong>of</strong> the patient <strong>and</strong> carer,<br />
but reduces suffer<strong>in</strong>g <strong>and</strong> provides added<br />
quality <strong>of</strong> life to the population.<br />
4<br />
Andres LA, Briceño B, Chase C, Echenique JA (2011). Sanitation <strong>and</strong> externalities: evidence from early childhood health <strong>in</strong> rural <strong>India</strong>. Policy<br />
Research Work<strong>in</strong>g Paper 6737. <strong>The</strong> World Bank: Wash<strong>in</strong>gton DC.<br />
5<br />
Future values (years 2 to 10) are deflated to the year <strong>2017</strong> us<strong>in</strong>g an annual discount rate <strong>of</strong> 8%. Household latr<strong>in</strong>es are assumed to last for at<br />
least 10 years, <strong>and</strong> with the annual O&M costs it is assumed that the toilet functions properly over (at least) this 10 year period.<br />
Source: (Manpreet Romana) Krishna Bhuyan (L), 50, <strong>and</strong> Dhanarajia Devi (R), 42, poses for a picture outside a<br />
toilet build at their home <strong>in</strong> village Hemza Bigha <strong>in</strong> district Aurangabad, Bihar