Artificial Intelligence in Energy Market Forecast 2024
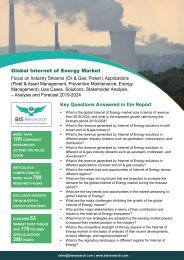
The emerging trends of the AI in energy market vary across different regions. In 2018, North America was at the forefront of the market, with huge market concentration in the U.S. During the forecast period, the Asia-Pacific region is expected to flourish as one of the most lucrative markets for AI in energy. Rising demand for decentralized power generation drive the growth of global AI in energy market.
The emerging trends of the AI in energy market vary across different regions. In 2018, North America was at the forefront of the market, with huge market concentration in the U.S. During the forecast period, the Asia-Pacific region is expected to flourish as one of the most lucrative markets for AI in energy. Rising demand for decentralized power generation drive the growth of global AI in energy market.

Create successful ePaper yourself
Turn your PDF publications into a flip-book with our unique Google optimized e-Paper software.
Global Artificial Intelligence (AI) in Energy Market
Focus on Product Type (Software, AI- as-a-Service, Hardware, Support Services),
Industry (Oil & Gas, Power), Applications (Fleet & Asset, Demand Response,
Precision Drilling, Renewable Management), Funding
Analysis and Forecast, 2019-2024
Key Questions Answered in the Report
MORE THAN
100 COMPANIES
RESEARCHED
ACROSS THE VALUE
CHAIN
METICULOUS
COMPILATION OF
MORE THAN 700
RESEARCH HOURS
EXCLUSIVE INSIGHTS
FROM IN-DEPTH
EXPERT INTERVIEWS
CONTAINS 60
MARKET DATA TABLES
AND 150 FIGURES
SPREAD ACROSS
259 PAGES
• What are the key trends and opportunities in the market pertaining to AI in energy?
• What is the estimated global AI in energy market size in terms of revenue for the time period
2018-2024, and what is the expected compound annual growth rate (CAGR) during the forecast
period 2019-2024?
• What is the expected future outlook and revenue to be generated by the different types of
product offerings including software, hardware, AI-as-a-Service, and support services?
• What is the revenue generated by AI solutions in both power and oil & gas industry for the time
period 2018-2024?
• What is the revenue generated by AI solutions in different power industry streams such as
generation, transmission, and distribution for the time period 2018-2014?
• What is the revenue generated by AI solutions in different oil & gas industry streams such as
upstream, midstream, and downstream for the time period 2018-2024?
• What is the revenue generated by AI solutions in different applications of power and oil & gas
industry for the time period 2018-2024?
• What is the current market size and opportunities of AI solutions in energy industry across
different regions including North America, Europe, Asia-Pacific, and Rest-of-the-World?
• What are the major driving forces that are expected to increase the demand for the global AI in
energy market during the forecast period?
• What are the major restraints inhibiting the growth of the global AI in energy market?
• What kind of new strategies are being adopted by the existing market players to expand their
market position in the industry?
• What is the competitive strength of the key players in the AI energy market on the basis of
analysis of their recent developments, product offerings, and regional presence?
• How is the competitive benchmarking of the key AI focused IT companies in the energy market
on the basis of analysis of their market coverage and market potential?
• What is the funding and investment landscape in the global artificial intelligence in energy
market?
• Which type of players and stakeholders operate in the market ecosystem of AI in energy, and
what are their significance in the global market?
• Which are the leading consortiums and associations in the global AI in energy market, and what
is their role in the market?
• How does the regulatory landscape differ in different regions for AI in energy?
sales@bisresearch.com | www.bisresearch.com
Table of Contents
MARKET DYNAMICS
COMPETITIVE LANDSCAPE
INDUSTRY ANALYSIS
GLOBAL ARTIFICIAL
INTELLIGENCE (AI) IN
ENERGY MARKET
(BY INDUSTRY STREAM)
GLOBAL ARTIFICIAL
INTELLIGENCE (AI) IN
ENERGY MARKET
(BY PRODUCT OFFERING)
GLOBAL ARTIFICIAL
INTELLIGENCE (AI) IN
ENERGY MARKET
(BY APPLICATION)
GLOBAL ARTIFICIAL
INTELLIGENCE (AI) IN
ENERGY MARKET
(BY REGION)
• Market Drivers
• Market Restraints
• Market Opportunities
• Key Market Developments and
Strategies
• Competitive Benchmarking of IT
Solution Providers in AI in Energy
Market
• Artificial Intelligence in Energy
Market Ecosystem
• Artificial Intelligence in Energy
Technology Ecosystem
• Key AI Use Cases in Energy
• Investment and Funding Landscape
• Key Consortiums and Associations
• Oil & Gas Industry
• Power Industry
• Software
• Hardware
• AI-as-a-Service
• Support Services
• Oil & Gas Applications
• Power Applications
• North America
• Europe
• Asia-Pacific
• Rest-of-the-World (RoW
COMPANY PROFILES
• IT Solution Providers
• Accenture Plc
• Amazon Web Services,
Inc.
• AutoGrid Systems, Inc.
• Cisco Systems Inc.
• C3 IoT, Inc.
• General Electric
• HCL Technologies Ltd..
• Huawei Technologies Co.,
Ltd
• International Business
Machines Corporation (IBM)
• Intel Corporation.
• Kellton Tech Solutions Ltd.
• Microsoft Corporation.
• Oracle Corporation
• Rockwell Automation Inc.
• SAP SE
• Wipro Limited
• Other Key Companies
• ABB Ltd.
• Actility S.A.
• Enel X North America, Inc.
• Equinor ASA
• Ingersoll Rand Plc
• Royal Dutch Shell PLC
• Siemens AG
• Schneider Electric
• Schlumberger Limited
• Tokyo Electric Power
Company
RESEARCH
SCOPE AND BIS
METHODOLOGY
• Report Scope
• Market Research Methodology
ANNEXURE
• Annexure A : List of Key
Strategies and Developments
in Global Artificial Intelligence in
Energy Market (Jan 2017-Sep
2019)
VIEW COMPLETE TABLE OF CONTENT
sales@bisresearch.com | www.bisresearch.com
List of Tables
1. Impact Analysis of Drivers
2. List of Investors Promoting Decentralized Energy
System
3. Applications of Battery Storage Systems in the
Power Supply Network
4. Impact Analysis of Restraints
5. Initiatives for the Advancement of the U.S. Grid
Network
6. Advantages and Growth Enablers of Smart Buildings
7. Applications of Energy Storage Systems in the
Power Supply Network
8. Regulatory Policies to Promote Variable Renewable
Energy
9. Key Consortiums and Associations in Global AI in
Energy Market
10. Global Artificial Intelligence in Energy Market (by
Industry Stream), $Million, 2018-2024
11. Global Artificial Intelligence in Oil & Gas Market (by
Industry Stream), 2018-2024, $Million
12. Some of the AI Solution Providers in the Upstream
Sector
13. Key AI Solution Providers in the Downstream Sector
14. Global Artificial Intelligence in the Power Market (by
Industry Stream), 2018-2024, $Million
15. Global Artificial Intelligence in Energy Market (by
Product Offering), $Million, 2018-2024
16. Key Artificial Intelligence Software Providers
17. Hardware Offering by Key Players in Artificial
Intelligence in Energy Market
18. Product Portfolio of the Key Players Providing AIaaS
19. Global Artificial Intelligence in Oil & Gas Market (by
Application), $Million 2018-2024
20. Key Companies with AI Products for Fleet and Asset
Management in Global AI in Energy Market
21. Key Companies with AI Products for Precision
Drilling in Global AI in Energy Market
22. Global Artificial Intelligence in Power Market (by
Application), $Million 2018-2024
23. Key Companies with AI Products for Renewable
Energy Management in Global AI in Energy Market
24. Features of Demand Response Mechanism
25. Demand Response Programs in the U.S.
26. Global Artificial Intelligence in Energy Market (by
Region), 2018-2024, $Million
27. North America in Artificial Intelligence in Energy (by
Industry), 2018-2024, $Million
28. North America in Artificial Intelligence in Energy
Market (by Country), 2018-2024, $Million
29. Use Cases in the U.S. in AI in Power Industry
30. Recent Developments in the Canada AI in Power
and Oil & Gas Industry
31. Europe in Artificial Intelligence in Energy (by
Industry), 2018-2024, $Million
32. Europe in Artificial Intelligence in Energy Market (by
Country), 2018-2024, $Million
33. Use cases of AI by power utilities in the U.K.
34. Recent Developments in the Germany AI in Power
Industry
35. Asia-Pacific Artificial Intelligence in Energy Market
(by Industry), 2018-2024, $Million
36. Asia-Pacific Artificial Intelligence in Energy Market
(by Country), 2018-2024, $Million
37. Australia Government Initiatives for Energy
Conservation
38. Benefits of Stakeholders from Smart Grid
39. RoW Artificial Intelligence in Energy Market (by
Industry), 2018-2024, $Million
40. RoW Artificial Intelligence in Energy Market (by
Country), 2018-2024, $Million
41. Accenture PLC: Product Portfolio
42. Amazon Web Services, Inc.: Product Portfolio
43. AutoGrid Systems, Inc: Product Portfolio
44. Cisco Systems Inc.: Product Portfolio
45. C3 IoT: Product Portfolio
46. General Electric: Product Portfolio
47. HCL Technologies Ltd.: Product Portfolio
48. Huawei Technologies Co., Ltd.: Product Portfolio
49. IBM Corporation: Product Portfolio
50. Intel Corporation: Product Portfolio
51. Kellton Tech Solutions Ltd: Product Portfolio
52. Microsoft Corporation: Product Portfolio
53. Oracle Corporation: Product Portfolio
54. Rockwell Automation Inc.: Product Portfolio
55. SAP SE: Product Portfolio
56. Schneider Electric: Product Portfolio
57. Enel X North America, Inc.: Product Portfolio
58. Equinor ASA: Product Portfolio
59. Ingersoll Rand Plc: Product Portfolio
60. Schlumberger Limited: Product Portfolio
sales@bisresearch.com | www.bisresearch.com
List of Figures
1. Artificial Intelligence in Oil & Gas Industry
2. Driving and Restraint Factors in the Global Artificial
Intelligence in Energy Market
3. Global Artificial Intelligence in Energy Market
Snapshot
4. Global Artificial Intelligence in Energy (by Product
Offering), $Million, 2019 and 2024,
5. Global Artificial Intelligence in Energy Market (by
Application), $Million, 2019-2024
6. Global Artificial Intelligence in Oil & Gas Market (by
Industry Stream), $Million, 2019 and 2024
7. Global Artificial Intelligence in Power Market (by
Industry Stream), $Million, 2019 and 2024
8. Regional Artificial Intelligence in Energy Market
Snapshot
9. Market Dynamics
10. Global Energy Demand Projection, 2015-2040
11. Market Strategies Adopted by the Key Players
(January 2017-September 2019)
12. Share of Key Market Strategies and Developments
(January 2017-September 2019)
13. Partnerships, Collaborations, and Joint Ventures
Share (by Company)
14. New Product Launches and Developments Share
(by Company)
15. Business Expansions and Contracts Share (by
Company)
16. Mergers and Acquisitions Share (by Company)
17. Competitive Benchmarking Matrix
18. Stakeholders of AI in Energy Market
19. Process Flow Chart of Power Industry
20. Process Flow Chart of Oil & Gas Industry
21. Value Chain of Artificial Intelligence
22. An Overview of Artificial Intelligence Technology
Ecosystem
23. Types of Artificial Intelligence Technology Based on
Capability
24. Artificial Intelligence in Energy: Key Use Cases
25. Global Artificial Intelligence in Energy Market:
Investment and Funding, November 2016-October
2019
26. Investment and Funding Landscape Share (by
Product Offering), $Million, November 2016-October
2019
27. Investment and Funding Landscape Share (by
Round), $Million
28. Industry Streams in Global AI in Energy Market
29. Global Artificial Intelligence in Upstream (in Oil &
Gas) Market, 2018-2024
30. Major Activities in the Midstream Sector
31. Global Artificial Intelligence in Midstream (in Oil &
Gas) Market, 2018-2024
32. Major Activities in the Downstream Sector
33. Global Artificial Intelligence in Downstream (in Oil &
Gas) Market, 2018-2024
34. Global Artificial Intelligence in Generation (in Power)
Market, 2018-2024
35. Major Activities in the Transmission Sector
36. Global Artificial Intelligence in Transmission (in
Power) Market, 2018-2024
37. Global Artificial Intelligence in Distribution (in Power)
Market, 2018-2024
38. Global Artificial Intelligence Software in Energy
Market, $Million, 2018-2024
39. Advantages of Software as a Service (SaaS)
40. Global Artificial Intelligence Hardware in Energy
Market, 2018-2024
41. Hardware Product Offerings in Global Artificial
Intelligence in Energy Market
42. Advantages of Artificial Intelligence as a Service
(AIaaS)
43. Global AI-as-a-Service in Energy Market, $Million,
2018-2024
44. Key Artificial Intelligence Support Services in Energy
Market
45. Global Artificial Intelligence Support Services in
Energy Market, 2018-2024
46. Key Applications in Global Artificial Intelligence in
Energy Market
47. Key Applications of Artificial Intelligence in Oil & Gas
Industry
48. Fleet and Asset Management in Global Artificial
Intelligence in Oil & Gas Market (by Application),
2018-2024
49. Precision Drilling in Global Artificial Intelligence in Oil
& Gas Market (by Application), 2018-2024
50. Demand Forecasting in Global Artificial Intelligence
in Oil & Gas Market (by Application), 2018-2024
51. Other Applications in Global Artificial Intelligence in
Oil & Gas Market (by Application), 2018-2024
52. Key Artificial Intelligence Applications in Power
Industry
53. Renewable Energy Management in Global Artificial
Intelligence in Power Market (by Application), 2018-
2024
sales@bisresearch.com | www.bisresearch.com
List of Figures
54. Artificial Intelligence based Process for Renewable
Energy Forecast
55. Infrastructure Management in Global Artificial
Intelligence in Power Market (by Application), 2018-
2024
56. Demand Response Management in Global Artificial
Intelligence in Power Market (by Application), 2018-
2024
57. Other Applications in Global Artificial Intelligence in
Power Market (by Application), 2018-2024
58. Global Artificial Intelligence in Energy Regional
Market Snapshot
59. North America Artificial Intelligence in Energy
Market, 2018-2024, $Million
60. U.S. Electricity Generation (by Sector) in 2018
61. U.S. Artificial Intelligence in Energy Market, 2018-
2024
62. Canada Artificial Intelligence in Energy Market,
2018-2024
63. Rest-of-North America Artificial Intelligence in Energy
Market, $Million, 2018-2024
64. Europe Artificial Intelligence in Energy Market, 2018-
2024
65. The U.K. Artificial Intelligence in Energy Market,
2018-2024, $Million
66. Germany Artificial Intelligence in Energy Market,
2018-2024, $Million
67. France Artificial Intelligence in Energy Market, 2018-
2024, $Million
68. Norway Artificial Intelligence in Energy Market, 2018-
2024, $Million
69. Rest-of-Europe Artificial Intelligence in Energy
Market, 2018-2024, $Million
70. Asia-Pacific Artificial Intelligence in Energy Market,
2018-2024
71. China Artificial Intelligence in Energy Market, 2018-
2024
72. Japan Artificial Intelligence in Energy Market, 2018-
2024, $Million
73. Australia Artificial Intelligence in Energy Market,
2018-2024
74. India Artificial Intelligence in Energy Market, 2018-
2024
75. Rest-of-Asia-Pacific Artificial Intelligence in Energy
Market, 2018-2024
76. RoW Artificial Intelligence in Energy Market, 2018-
2024
77. Saudi Arabia Artificial Intelligence in Energy Market,
2018-2024
78. U.A.E Artificial Intelligence in Energy Market, 2018-
2024
79. Brazil Artificial Intelligence in Energy Market, 2018-
2024
80. Rest- of- RoW Artificial Intelligence in Energy
Market, 2018-2024, $Million
81. Segmentation of Key Companies Profiled by Type of
Company
82. Accenture PLC: Overall Financials, 2016-2018
83. Accenture Plc: Net Revenue (by Business Segment),
2016-2018
84. Accenture PLC: Net Revenue (by Regional
Segment), 2016-2018
85. Research and Development: Accenture PLC - 2016
to 2018
86. Accenture PLC: SWOT Analysis
87. Amazon.com, Inc.: Net Revenue (by Business
Segment), 2016-2018
88. Amazon.com, Inc.: SWOT Analysis
89. AutoGrid Systems, Inc: SWOT Analysis
90. Cisco Systems Inc.: Overall Financials, 2016-2018
91. Cisco Systems Inc.: Net Revenue (by Business
Segment), 2016-2018
92. Cisco Systems: Net Revenue (by Region), 2016-
2018
93. Cisco Systems Inc.: SWOT Analysis
94. C3 IoT: SWOT Analysis
95. General Electric: Overall Financials, 2016-2018
96. General Electric: Net Revenue (by Business
Segment), 2016-2018
97. General Electric: Net Revenue (by Regional
Segment), 2016-2018
98. General Electric: Research and Development: 2016-
2018
99. General Electric: SWOT Analysis
100. : HCL Technologies Ltd.: Overall Financials, 2017-
2019
101. HCL Technologies Ltd.: Net Revenue (by Business
Segment), 2017-2019
102. HCL Technologies Ltd.: Net Revenue (by Regional
Segment), 2017-2019
103. HCL Technologies Ltd.: SWOT Analysis
104. Huawei Technologies Co., Ltd.: Overall Financials,
2016-2018
sales@bisresearch.com | www.bisresearch.com
List of Figures
105. Huawei Technologies Co., Ltd.: Net Revenue (by
Business Segment), 2016-2018
106. Huawei Technologies Co., Ltd.: Net Revenue (by
Region), 2016-2018
107. Huawei Technologies Co., Ltd.: SWOT Analysis
108. IBM Corporation: Overall Financials, 2016-2018
109. IBM Corporation: Net Revenue (by Business
Segment), 2016-2018
110. IBM Corporation: Net Revenue (by Regional
Segment), 2016-2018
111. IBM Corporation: R&D Expenditure, 2016-2018
112. IBM Corporation: SWOT Analysis
113. Intel Corporation: Overall Financials, 2016-2018
114. Intel Corporation: Net Revenue (by Business
Segment), 2016-2018
115. Intel Corporation: Net Revenue (by Regional
Segment), 2016-2018
116. Research and Development: Intel Corporation -
2016 to 2018
117. Intel Corporation: SWOT Analysis
118. Kellton Tech Solutions Ltd: Overall Financials, 2017-
2019
119. Kellton Tech Solutions Ltd: Net Revenue (by
Business Segment), 2017-2019
120. Kellton Tech: Net Revenue (by Region), 2017 and
2019
121. Kellton Tech: SWOT Analysis
122. Microsoft Corporation: Overall Financials, 2016-2018
123. Microsoft Corporation: Net Revenue (by Business
Segment), 2016-2018
124. Microsoft Corporation: Net Revenue (by Regional
Segment), 2016-2018
125. Research and Development: Microsoft Corporation -
2016 to 2018
126. Microsoft Corporation: SWOT Analysis
127. Oracle Corporation: Overall Financials, 2016-2018
128. Oracle Corporation: Net Revenue by Business
Segment, 2017-2018
129. Oracle Corporation: Net Revenue by Regional
Segment, 2017-2018
130. Research and Development: Oracle Corporation -
2016 to 2018
131. Oracle Corporation: SWOT Analysis
132. Rockwell Automation Inc.: Overall Financials, 2016-
2018
133. Rockwell Automation Inc.: Net Revenue (by
Business Segment), 2016-2018
134. Rockwell Automation Inc.: Net Revenue (by Regional
Segment), 2016-2018
135. Research and Development: Rockwell Automation -
2016 to 2018
136. Rockwell Automation Inc.: SWOT Analysis
137. SAP SE: Overall Financials, 2016-2018
138. SAP SE: Net Revenue by Business Segment, 2016-
2018
139. SAP SE: Net Revenue by Regional Segment, 2016-
2018
140. SAP SE: SWOT Analysis
141. Wipro Limited: Overall Financials, 2017-2019
142. Wipro Limited: Net Revenue (by Business Segment),
2018-2019
143. Wipro Limited: Net Revenue by Regional Segment,
2018-2019
144. Wipro Limited: SWOT Analysis
145. Artificial Intelligence in Energy Market Scope
146. Report Methodology
147. Primary Interviews Breakdown, by Company,
Designation, and Region
148. Sources of Secondary Research
149. Data Triangulation
150. Top-Down and Bottom-Up Approach for Market
Estimation
sales@bisresearch.com | www.bisresearch.com
Research Scope & BIS Methodology
1. Scope of the Report
The report is a thorough study of artificial intelligence in energy market share and market size, including the analysis of
different industry stream and applications of artificial intelligence in energy market. The market trends across the regions
have also been extensively analyzed in the artificial intelligence in energy market study. Further, the market estimated
in different sections of the report considered “2019-2024” as the forecast period.
1.1 Artificial Intelligence in Energy Research Methodology
The research methodology design adopted for this specific study includes a combination of data collected from
primary and secondary researches. Both the primary sources (in-house experts, industry leaders, market players, and
independent consultants) and the secondary (a host of paid and unpaid databases) sources have been used along with
analytical tools to build the forecast and predictive models.
Primary Data Sources
The primary sources involve the industry experts from the AI in energy market. In the extensive primary research
process undertaken for this study, the primary sources include industry experts and key executives from prominent
companies, research organizations and energy management associations. All such resources have been interviewed to
obtain and verify both the qualitative and the quantitative aspects of this research study.
The key data points taken from primary sources include:
• Validation and triangulation of all the numbers and graphs
• Validation of report’s segment and key qualitative findings
• Understanding the competitive landscape
• Validation of several market segments for AI in energy
• Percentage split for countries
The research includes interviews with participants throughout the value chain. An extensive questionnaire was shared to
get insights from the experts who didn’t participate in discussions. In some cases where information was not available,
Delphi method was used to arrive at mutual consent with BIS consultants.
Secondary Data Sources
The research study involves the usage of extensive secondary sources such as databases, company websites, and
annual reports, among others. It also makes use of databases such as Hoovers, Bloomberg, Business-week, and
Factiva to collect useful information for an extensive, market-oriented, and commercial study of the global market.
Secondary research was done in order to obtain crucial information about the industry’s value chain, market’s monetary
chain, total pool of key players, and the prevalent solutions and application segments. The following figure exhibits key
secondary data sources considered:
sales@bisresearch.com | www.bisresearch.com
Research Scope & BIS Methodology
Data Triangulation
The process of market engineering involves calculation of the market statistics, market size estimation, market forecast,
market crackdown, and data triangulation (the methodology for these quantitative data processes is explained in the
further sections). An extensive primary research study was undertaken to gather information, and authenticate the
critical numbers arrived through segmentation types, industry trends, and key players of each type of solutions in the
market.
Figure 2: Data Triangulation
The following figure exhibits the key secondary data sources considered:
Information Sourced
• Key Players
• Competitive Landscape
• Opportunities/Challenges
• Market Size and Market Share (2018-2024)
• Macro-Economic Factors
• Market Estimates
• Regional Analysis
Information Sourced
DATA
TRIANGULATION
Primary Sources
Secondary Sources
Primary Sources
Secondary Sources
• Energy Management and Automation
Companies
• IT Companies
• Oil & Gas Companies
• Power Utilities
• Energy Associations
• Research Organizations
• SEC Filings
• Investor Presentations
• Journals
• Press Releases
• Paid & Unpaid Databases
• IRENA
• United States Department of Energy Reports
• Research Articles
REQUEST FOR SAMPLE
sales@bisresearch.com | www.bisresearch.com
BIS Research
39111 Paseo Padre PKWY STE 313,
Fremont CA 94538-1686,
Tel: +1-510-404-8135
Global Delivery Centre
Tapasya Corp Heights, Subarea,
Sector 126, Noida, NCR-201303 India
Tel: +91 120 4261540 / +91 120 4261544
To know more about us, please visit our website:
bisresearch.com
For other queries contact:
sales@bisresearch.com
sales@bisresearch.com | | www.bisresearch.com
www.bisresearch.com