Technical Paper - Timken
Technical Paper - Timken
Technical Paper - Timken

You also want an ePaper? Increase the reach of your titles
YUMPU automatically turns print PDFs into web optimized ePapers that Google loves.
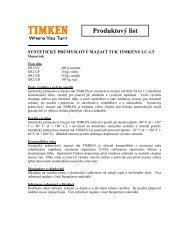
ment, tilting and gear face misalignment in the “ZZ” plane<br />
of the paper. In Fig. 18B it is shown that the lightly pre-<br />
loaded tapered roller bearing reduces these movements<br />
and misalignments.<br />
FIGURE 18A – PLANET WITH OVERTURNING MOMENT<br />
FIGURE 18B – RADIAL DISPLACEMENT WITH OVERTURNING MO-<br />
MENT<br />
Unlike the flexible pins shown in figure 4, the IFB is a<br />
unitized bearing package that has the unique feature of<br />
having its internal clearance pre-set at the bearing facto-<br />
ry to very exacting specifications. This ensures that the<br />
mounted clearance variation among IFB assemblies will<br />
be miniscule, which means that the IFB deflection charac-<br />
teristics will be extremely consistent within a large popu-<br />
lation of product. Planet-to-planet backlash variation will<br />
be minimized. Obviously, this will have an equal impact<br />
on backlash variation within a population of gear drives,<br />
as well.<br />
<strong>Timken</strong> Static Testing<br />
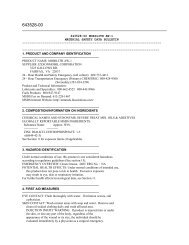
Static testing was designed and conducted at the au-<br />
thors’ company to confirm the accuracy of the analytical<br />
models. Figure 19 shows the test bed on which all exper-<br />
iments were conducted. An IFB was cantilevered from<br />
a massive and rigidly supported carrier wall, keeping in<br />
mind that it was necessary to be able to discern between<br />
the deflection of the IFB and deflection of the carrier wall<br />
as data was collected and evaluated. This was accom-<br />
plished quite successfully so that values derived for com-<br />
parison are accurate.<br />
FIGURE 19 – STATIC DEFLECTION TEST STAND<br />
Displacements were measured at numerous critical<br />
locations on the IFB and carrier wall with LVDT probes, as<br />
well as dial indictors. Strain gauges were installed on the<br />
pin fillet radius and between the planet carrier and pin to<br />
confirm our FEA predictions.<br />
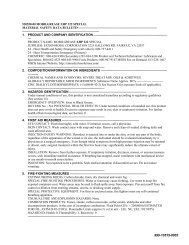
Figure 20 shows comparisons between measured<br />
and calculated results. The percentage of error is with-<br />
in reasonable accuracy for design purposes verifying that<br />
the design tool may now be used with confidence.<br />
Gear misalignment +22 %<br />
Radial deflection +5 %<br />
Stress level +10 %<br />
Linear behaviour +15 %<br />
FIGURE 20 – STATIC TEST RESULTS<br />
Measured / calculated<br />
KHb +6% (see note below)