
Create successful ePaper yourself
Turn your PDF publications into a flip-book with our unique Google optimized e-Paper software.
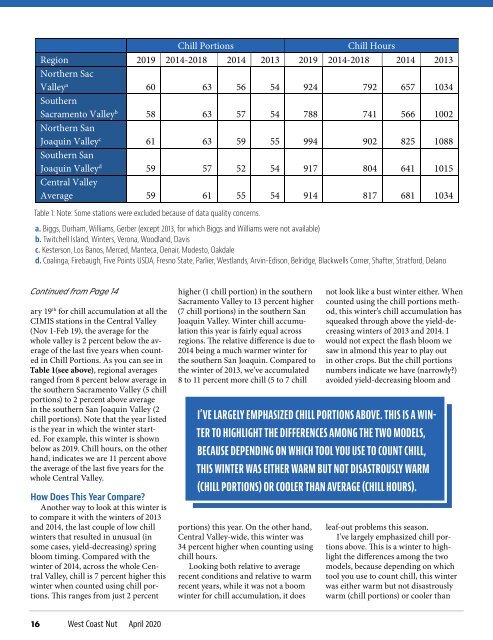
Table 1: Note: Some stations were excluded because of data quality concerns.<br />
a. Biggs, Durham, Williams, Gerber (except 2013, for which Biggs and Williams were not available)<br />
b. Twitchell Island, Winters, Verona, Woodland, Davis<br />
c. Kesterson, Los Banos, Merced, Manteca, Denair, Modesto, Oakdale<br />
d. Coalinga, Firebaugh, Five Points USDA, Fresno State, Parlier, Westlands, Arvin-Edison, Belridge, Blackwells Corner, Shafter, Stratford, Delano<br />
Continued from Page 14<br />
ary 19 th for chill accumulation at all the<br />
CIMIS stations in the Central Valley<br />
(Nov 1-Feb 19), the average for the<br />
whole valley is 2 percent below the average<br />
of the last five years when counted<br />
in Chill Portions. As you can see in<br />
Table 1(see above), regional averages<br />
ranged from 8 percent below average in<br />
the southern Sacramento Valley (5 chill<br />
portions) to 2 percent above average<br />
in the southern San Joaquin Valley (2<br />
chill portions). Note that the year listed<br />
is the year in which the winter started.<br />
For example, this winter is shown<br />
below as 2019. Chill hours, on the other<br />
hand, indicates we are 11 percent above<br />
the average of the last five years for the<br />
whole Central Valley.<br />
How Does This Year Compare?<br />
Another way to look at this winter is<br />
to compare it with the winters of 2013<br />
and 2014, the last couple of low chill<br />
winters that resulted in unusual (in<br />
some cases, yield-decreasing) spring<br />
bloom timing. Compared with the<br />
winter of 2014, across the whole Central<br />
Valley, chill is 7 percent higher this<br />
winter when counted using chill portions.<br />
This ranges from just 2 percent<br />
higher (1 chill portion) in the southern<br />
Sacramento Valley to 13 percent higher<br />
(7 chill portions) in the southern San<br />
Joaquin Valley. Winter chill accumulation<br />
this year is fairly equal across<br />
regions. The relative difference is due to<br />
2014 being a much warmer winter for<br />
the southern San Joaquin. Compared to<br />
the winter of 2013, we’ve accumulated<br />
8 to 11 percent more chill (5 to 7 chill<br />
portions) this year. On the other hand,<br />
Central Valley-wide, this winter was<br />
34 percent higher when counting using<br />
chill hours.<br />
Looking both relative to average<br />
recent conditions and relative to warm<br />
recent years, while it was not a boom<br />
winter for chill accumulation, it does<br />
not look like a bust winter either. When<br />
counted using the chill portions method,<br />
this winter’s chill accumulation has<br />
squeaked through above the yield-decreasing<br />
winters of 2013 and 2014. I<br />
would not expect the flash bloom we<br />
saw in almond this year to play out<br />
in other crops. But the chill portions<br />
numbers indicate we have (narrowly?)<br />
avoided yield-decreasing bloom and<br />
I’VE LARGELY EMPHASIZED CHILL PORTIONS ABOVE. THIS IS A WIN-<br />
TER TO HIGHLIGHT THE DIFFERENCES AMONG THE TWO MODELS,<br />
BECAUSE DEPENDING ON WHICH TOOL YOU USE TO COUNT CHILL,<br />
THIS WINTER WAS EITHER WARM BUT NOT DISASTROUSLY WARM<br />
(CHILL PORTIONS) OR COOLER THAN AVERAGE (CHILL HOURS).<br />
leaf-out problems this season.<br />
I’ve largely emphasized chill portions<br />
above. This is a winter to highlight<br />
the differences among the two<br />
models, because depending on which<br />
tool you use to count chill, this winter<br />
was either warm but not disastrously<br />
warm (chill portions) or cooler than<br />
16 West Coast Nut <strong>April</strong> <strong>2020</strong>