


You also want an ePaper? Increase the reach of your titles
YUMPU automatically turns print PDFs into web optimized ePapers that Google loves.
WESTERN INDIAN OCEAN – Regional coral <strong>bleaching</strong> <strong>alert</strong><br />
Bleaching Alert Level<br />
● ‘warning’ – indications of warmer<br />
conditions that may result in some<br />
<strong>bleaching</strong><br />
● ‘level 1’ – moderate <strong>bleaching</strong><br />
possible<br />
● ‘level 2’ – severe <strong>bleaching</strong> likely<br />
Forecasted <strong>bleaching</strong> is for the entire<br />
season (Jan-May), to facilitate<br />
preparation and early responses<br />
DATE OF THIS ALERT: 4 May <strong>20</strong><strong>20</strong><br />
http://www.cordioea.net/<strong>bleaching</strong><strong>alert</strong>/<br />
Contact: <strong>bleaching</strong>@cordioea.net<br />
4 May <strong>20</strong><strong>20</strong> – Coral <strong>bleaching</strong> forecast – Western Indian Ocean<br />
Area Region Alert Bleaching observations<br />
S Moz/S Africa Cool, south (D1) ended Bleaching risk ended<br />
S<strong>WIO</strong>/E Madag Cool, south (D2) ended Bleaching risk ended<br />
SW Madagascar Hot, south (A1) ended Bleaching risk ended<br />
South Equat Curr Moderate, central (C) remnant<br />
East Moz Cha/Comoros Hot, central (A2) ended Moderate <strong>bleaching</strong>, Comoros<br />
NW Moz Cha /Tanz Warm, central (B) ended Low <strong>bleaching</strong> (Zanzibar)<br />
NW Seychelles Hot, north (A3) remnant None reported yet<br />
Kenya-Somalia Variable, north (E) remnant Moderate <strong>bleaching</strong> (Kenya)<br />
Global & Regional Indicators<br />
The outlook for <strong>bleaching</strong> has<br />
dropped further, with only a<br />
small patch of moderate<br />
<strong>bleaching</strong> predicted in the<br />
Somali basin and Seychelles.<br />
Meanwhile, long rains continue<br />
along the equatorial belt.<br />
Virtual stations<br />
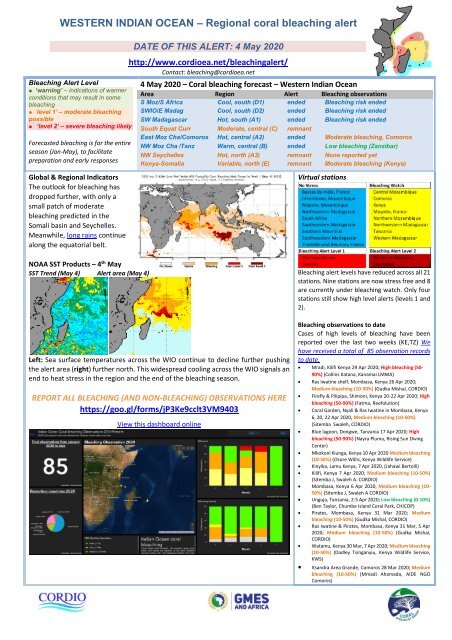
NOAA SST Products – 4 th May<br />
SST Trend (May 4) Alert area (May 4)<br />
Left: Sea surface temperatures across the <strong>WIO</strong> continue to decline further pushing<br />
the <strong>alert</strong> area (right) further north. This widespread cooling across the <strong>WIO</strong> signals an<br />
end to heat stress in the region and the end of the <strong>bleaching</strong> season.<br />
REPORT ALL BLEACHING (AND NON-BLEACHING) OBSERVATIONS HERE<br />
https://goo.gl/forms/jP3Ke9cclt3VM9403<br />
View this dashboard online<br />
Bleaching <strong>alert</strong> levels have reduced across all 21<br />
stations. Nine stations are now stress free and 8<br />
are currently under <strong>bleaching</strong> watch. Only four<br />
stations still show high level <strong>alert</strong>s (levels 1 and<br />
2).<br />
Bleaching observations to date<br />
Cases of high levels of <strong>bleaching</strong> have been<br />
reported over the last two weeks (KE,TZ) We<br />
have received a total of 85 observation records<br />
to date.<br />
• Mradi, Kilifi Kenya 29 Apr <strong>20</strong><strong>20</strong>; High <strong>bleaching</strong> (50-<br />
90%) (Collins Katana, Kanamai LMMA)<br />
• Ras Iwatine shelf, Mombasa, Kenya 26 Apr <strong>20</strong><strong>20</strong>;<br />
Medium <strong>bleaching</strong> (10-50%) (Gudka Mishal, CORDIO)<br />
• Firefly & Pilipipa, Shimoni, Kenya <strong>20</strong>-22 Apr <strong>20</strong><strong>20</strong>; High<br />
<strong>bleaching</strong> (50-90%) (Fatma, Reefolution)<br />
• Coral Garden, Nyali & Ras Iwatine in Mombasa, Kenya<br />
6, <strong>20</strong>, 22 Apr <strong>20</strong><strong>20</strong>, Medium <strong>bleaching</strong> (10-50%)<br />
(Sitemba Swaleh, CORDIO)<br />
• Blue lagoon, Dongwe, Tanzania 17 Apr <strong>20</strong><strong>20</strong>; High<br />
<strong>bleaching</strong> (50-90%) (Nayra Pluma, Rising Sun Diving<br />
Center)<br />
• Mkokoni Kiunga, Kenya 10 Apr <strong>20</strong><strong>20</strong> Medium <strong>bleaching</strong><br />
(10-50%) (Osore Willis, Kenya Wildlife Service)<br />
• Kinyika, Lamu Kenya, 7 Apr <strong>20</strong><strong>20</strong>, (Jahawi Bertolli)<br />
• Kilifi, Kenya 7 Apr <strong>20</strong><strong>20</strong>; Medium <strong>bleaching</strong> (10-50%)<br />
(Sitemba J, Swaleh A. CORDIO)<br />
• Mombasa, Kenya 6 Apr <strong>20</strong><strong>20</strong>, Medium <strong>bleaching</strong> (10-<br />
50%) (Sitemba J, Swaleh A CORDIO)<br />
• Unguja, Tanzania, 2-5 Apr <strong>20</strong><strong>20</strong>; Low <strong>bleaching</strong> (0-10%)<br />
(Ben Taylor, Chumbe Island Coral Park, CHICOP)<br />
• Pirates, Mombasa, Kenya 31 Mar <strong>20</strong><strong>20</strong>; Medium<br />
<strong>bleaching</strong> (10-50%) (Gudka Mishal, CORDIO)<br />
• Ras Iwatine & Pirates, Mombasa, Kenya 31 Mar, 5 Apr<br />
<strong>20</strong><strong>20</strong>; Medium <strong>bleaching</strong> (10-50%) (Gudka Mishal,<br />
CORDIO)<br />
• Watamu, Kenya 30 Mar, 7 Apr <strong>20</strong><strong>20</strong>; Medium <strong>bleaching</strong><br />
(10-50%) (Dadley Tsinganyiu, Kenya Wildlife Service,<br />
KWS)<br />
• Itsandra Area Grande, Comoros 28 Mar <strong>20</strong><strong>20</strong>; Medium<br />
<strong>bleaching</strong> (10-50%) (Mmadi Ahamada, AIDE NGO<br />
Comores)
WESTERN INDIAN OCEAN – Regional coral <strong>bleaching</strong> <strong>alert</strong><br />
Explanations<br />
<strong>WIO</strong> climatology regions<br />
DATE OF THIS ALERT: 4 May <strong>20</strong><strong>20</strong><br />
Since <strong>20</strong>14, <strong>bleaching</strong><br />
reporting regions are used as<br />
defined by SST analysis from<br />
the last decade (<strong>20</strong>03-<strong>20</strong>09<br />
as ‘background’ years, and<br />
<strong>20</strong>10 as a year of high<br />
<strong>bleaching</strong>), rather than a<br />
longer historical record that<br />
includes pre-1998 SSTs.<br />
Five SST zones were<br />
identified:<br />
A – the hottest region; the East Mozambique Channel<br />
and Comoros (reported as A1, SW Madagascar; A2,<br />
NE Madagascar Channel; and A3, NW Seychelles<br />
islands).<br />
B – the second hottest region; East African mainland<br />
coast from 7-18 o S (Zanzibar/Dar es Salaam to<br />
Primeiras/Segundas islands), and including the<br />
Northwest Mozambique Channel<br />
C – a moderate/intermediate region; the South<br />
Equatorial Current region, comprising the Mascarene<br />
Banks, southern Seychelles islands and NE<br />
Madagascar<br />
D – the southern cooler regions; SW Indian Ocean<br />
islands, E and S Madagascar and S Mozambique and<br />
South Africa. Split into 2 sub-regions.<br />
E – the cooler northern but highly variable region; the<br />
Kenya-Somali coast, including Pemba island and N<br />
Tanzania coast (Tanga).<br />
Because of latitudinal variation (e.g. in A) and<br />
geographic splitting (e.g. A and D), we report in 8 subregions.<br />
Alert levels<br />
Statistical analysis of <strong>alert</strong>s from <strong>20</strong>07-13 indicated<br />
that low confidence is attached to an <strong>alert</strong> of ‘low’<br />
<strong>bleaching</strong> risk (i.e. not zero risk, but not severe). By<br />
contrast, predictions of ‘mid’ and ‘high’ risk of<br />
<strong>bleaching</strong> were more reliable. Accordingly, the <strong>alert</strong> is<br />
being presented as:<br />
● ‘warning’ – indications of warmer conditions<br />
that may result in some <strong>bleaching</strong><br />
● ‘level 1’ – moderate <strong>bleaching</strong> possible<br />
●<br />
‘level 2’ – severe <strong>bleaching</strong> likely<br />
These findings match the categories used by NOAA,<br />
with ‘watch’, ‘<strong>bleaching</strong> level 1’ and <strong>bleaching</strong> level 2’<br />
categories, respectively.<br />
Sea Surface Temperatures (SST)<br />
The surface of the sea heats up by direct insolation,<br />
causing stress to corals and other shallow water<br />
organisms. Satellites directly measure the skintemperature<br />
of the sea, providing these maps and<br />
coral <strong>bleaching</strong> products for early warning.<br />
Predicted Bleaching<br />
coral<br />
The Bleaching Heat Stress Outlook is based on sea<br />
surface temperature (SST) forecasts generated by the<br />
NOAA National Centers for Environmental Prediction's<br />
Climate Forecast System Version 2 (CFSv2). In a<br />
normal year, the Outlook forecasts no potential for<br />
<strong>bleaching</strong>. The baseline years for<br />
the calculations (i.e., the climatology) are<br />
1985-<strong>20</strong>06.<br />
Wind-driven mixing<br />
Wind is an important physical factor influencing<br />
conditions conducive to coral <strong>bleaching</strong>. Wind-driven<br />
mixing reduces temperature stress and wind<br />
generated waves can scatter harmful levels of<br />
incoming solar radiation.<br />
● Cyclones - cause strong mixing, reducing SST.<br />
● Doldrums - periods of sustained low wind promote<br />
stratification, and heating of the upper layers of water.<br />
They therefore promote environmental conditions<br />
adverse to corals experiencing thermal and/or light<br />
stress.<br />
El Niño/Southern Oscillation (ENSO)<br />
The El Niño/Southern Oscillation (ENSO) is the most<br />
important coupled ocean-atmosphere phenomenon to<br />
cause global climate variability on interannual time<br />
scales.<br />
Multivariate ENSO Index (MEI) - Negative values of<br />
the MEI represent the cold ENSO phase (La Niña),<br />
while positive MEI values represent the warm ENSO<br />
phase (El Niño).<br />
The Southern Oscillation Index (SOI) is calculated<br />
from the monthly or seasonal fluctuations in the air<br />
pressure difference between Tahiti and Darwin (Note,<br />
negative SOI is equivalent to positive MEI).<br />
The Nino 3.4 index is similar to the SOI, but focused<br />
on the central Pacific Niño region, straddling the<br />
equator and from 170-1<strong>20</strong> o W. It has been found to be<br />
most strongly associated with climatic consequences<br />
in the African region, so is used here.<br />
Indian Ocean Dipole<br />
The Indian Ocean Dipole is analogous to the ENSO,<br />
but for the Indian Ocean. It is calculated using the<br />
Dipole Mode Index (DMI), which calculates the<br />
gradient between the western equatorial Indian Ocean<br />
(50E-70E and 10S-10N) and the south eastern<br />
equatorial Indian Ocean (90E-110E and 10S-0N).<br />
Global indicators<br />
Local temperatures are affected by global and regional<br />
trends. With global warming, temperatures are<br />
expected to rise over longer periods (decades), but<br />
significant variation can occur between years, and<br />
under the influence of regional and multi-year factors<br />
such as ocean-atmosphere interactions across the<br />
Pacific and Indian Ocean.<br />
Data sources<br />
https://www.metoffice.gov.uk/research/climate/seasonal-todecadal/long-range/decadal-fc/index<br />
http://coralreefwatch.noaa.gov/<br />
https://en.wikipedia.org/wiki/<strong>20</strong>19%E2%80%93<strong>20</strong>_South-<br />
West_Indian_Ocean_cyclone_season<br />
http://www.mtotec.com/<br />
http://www.bom.gov.au/climate/enso/#tabs=Indian-Ocean<br />
http://www.ioc-gooshttps://stateoftheocean.osmc.noaa.gov/sur/ind/dmi.php<br />
http://www2.cnrs.fr/en/3148.htm


