SWQM - A simple river water quality model for assessment of urban ...
SWQM - A simple river water quality model for assessment of urban ...
SWQM - A simple river water quality model for assessment of urban ...

Create successful ePaper yourself
Turn your PDF publications into a flip-book with our unique Google optimized e-Paper software.
12 nd International Conference on Urban Drainage, Porto Alegre/Brazil, 10-15 September 2011<br />
EXAMPLE APPLICATION<br />
As an example <strong>of</strong> application <strong>of</strong> <strong>SWQM</strong>, a hypothetical <strong>river</strong> described in the literature<br />
(Schütze et al., 2002) has been <strong>model</strong>led. It consists <strong>of</strong> a 40 km stretch <strong>of</strong> a <strong>river</strong> with<br />
identical pr<strong>of</strong>ile in all <strong>river</strong> sections. It has a base flow (from upstream) <strong>of</strong> 1500 l/s. The<br />
waste<strong>water</strong> treatment plant effluent has been determined by simulation <strong>of</strong> adaptations <strong>of</strong> the<br />
example sewer system (A128 example) and waste<strong>water</strong> treatment plant <strong>of</strong> the Simba<br />
simulation system (see ifak, 2009); its average flow amounts to 318 l/s. In a similar way, CSO<br />
discharges have been obtained by simulation. Figure 3a illustrates the simulation set up.<br />
Baseflow is assumed to enter the <strong>river</strong> at Section E0, whilst CSO discharges are into Section<br />
E6 and waste<strong>water</strong> treatment effluent discharges into Section E11. Each section is assumed to<br />
have a length <strong>of</strong> 1 km. Hydrodynamic simulation was carried out using an extended version <strong>of</strong><br />
SWMM, which has been integrated into SIMBA, thus allowing arbitrary biochemical<br />
trans<strong>for</strong>mation processes (such as the <strong>SWQM</strong>) to be <strong>model</strong>led. As waste<strong>water</strong> treatment<br />
<strong>model</strong>ling took place using the Activated Sludge Model No. 1 (Henze et al., 2000), <strong>model</strong>ling<br />
results (using the pollutant fractions <strong>of</strong> ASM1) had to be converted into the variable set <strong>of</strong><br />
<strong>SWQM</strong>. Appropriate converter functions have been implemented. In a similar way, sewer<br />
system <strong>model</strong>ling results had been converted from sewer system variables (COD, TKN) into<br />
the <strong>SWQM</strong> variables in order to describe the discharges into the <strong>river</strong> in an appropriate way.<br />
1000<br />
0 1 2 3 4 5<br />
Time [d]<br />
6 7 8 9 10<br />
6 <strong>SWQM</strong> - A <strong>simple</strong> <strong>river</strong> <strong>water</strong> <strong>quality</strong> <strong>model</strong><br />
[l/s]<br />
7000<br />
6000<br />
5000<br />
4000<br />
3000<br />
2000<br />
Selected <strong>river</strong> sections<br />
link E07 flow<br />
link E13 flow<br />
link E20 flow<br />
link E27 flow<br />
link E34 flow<br />
link E40 flow<br />
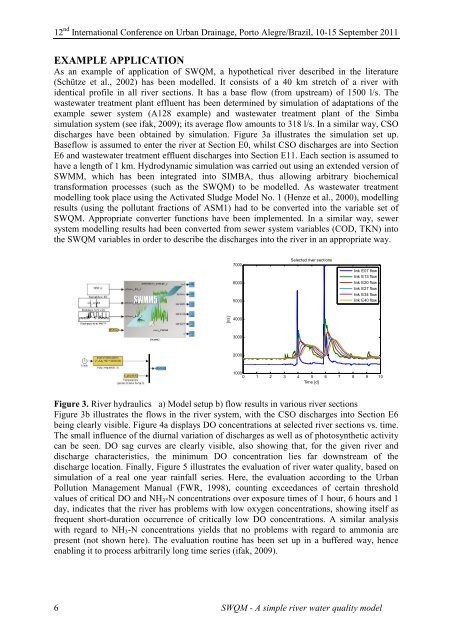
Figure 3. River hydraulics a) Model setup b) flow results in various <strong>river</strong> sections<br />
Figure 3b illustrates the flows in the <strong>river</strong> system, with the CSO discharges into Section E6<br />
being clearly visible. Figure 4a displays DO concentrations at selected <strong>river</strong> sections vs. time.<br />
The small influence <strong>of</strong> the diurnal variation <strong>of</strong> discharges as well as <strong>of</strong> photosynthetic activity<br />
can be seen. DO sag curves are clearly visible, also showing that, <strong>for</strong> the given <strong>river</strong> and<br />
discharge characteristics, the minimum DO concentration lies far downstream <strong>of</strong> the<br />
discharge location. Finally, Figure 5 illustrates the evaluation <strong>of</strong> <strong>river</strong> <strong>water</strong> <strong>quality</strong>, based on<br />
simulation <strong>of</strong> a real one year rainfall series. Here, the evaluation according to the Urban<br />
Pollution Management Manual (FWR, 1998), counting exceedances <strong>of</strong> certain threshold<br />
values <strong>of</strong> critical DO and NH3-N concentrations over exposure times <strong>of</strong> 1 hour, 6 hours and 1<br />
day, indicates that the <strong>river</strong> has problems with low oxygen concentrations, showing itself as<br />
frequent short-duration occurrence <strong>of</strong> critically low DO concentrations. A similar analysis<br />
with regard to NH3-N concentrations yields that no problems with regard to ammonia are<br />
present (not shown here). The evaluation routine has been set up in a buffered way, hence<br />
enabling it to process arbitrarily long time series (ifak, 2009).