PPAI The 2011 Estimate Of Promotional Products Distributor Sales
PPAI The 2011 Estimate Of Promotional Products Distributor Sales
PPAI The 2011 Estimate Of Promotional Products Distributor Sales

You also want an ePaper? Increase the reach of your titles
YUMPU automatically turns print PDFs into web optimized ePapers that Google loves.
8.04<br />
7.01<br />
6.22<br />
5.13 5.22<br />
<strong>PPAI</strong> <strong>The</strong> <strong>2011</strong> <strong>Estimate</strong> <strong>Of</strong> <strong>Promotional</strong> <strong>Products</strong> <strong>Distributor</strong> <strong>Sales</strong><br />
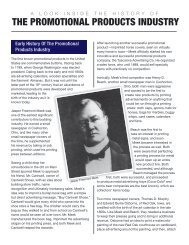
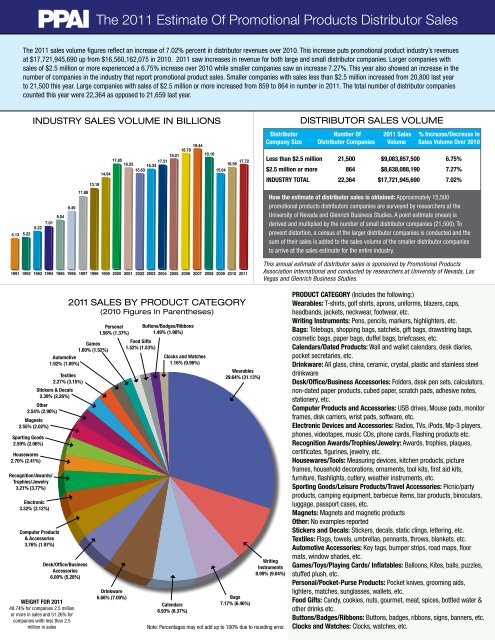
<strong>The</strong> <strong>2011</strong> sales volume figures reflect an increase of 7.02% percent in distributor revenues over 2010. This increase puts promotional product industry’s revenues<br />
at $17,721,945,690 up from $16,560,162,075 in 2010. <strong>2011</strong> saw increases in revenue for both large and small distributor companies. Larger companies with<br />
sales of $2.5 million or more experienced a 6.75% increase over 2010 while smaller companies saw an increase 7.27%. This year also showed an increase in the<br />
number of companies in the industry that report promotional product sales. Smaller companies with sales less than $2.5 million increased from 20,800 last year<br />
to 21,500 this year. Large companies with sales of $2.5 million or more increased from 859 to 864 in number in <strong>2011</strong>. <strong>The</strong> total number of distributor companies<br />
counted this year were 22,364 as opposed to 21,659 last year.<br />
INDUSTRY SALES VOLUME IN BILLIONS<br />
9.49<br />
11.88<br />
13.18<br />
17.85<br />
16.55 16.34<br />
17.72<br />
16.56<br />
14.94<br />
15.63<br />
17.31<br />
19.44<br />
18.78<br />
18.01<br />
18.10<br />
15.64<br />
1991 1992 1993 1994 1995 1996 1997 1998 1999 2000 2001 2002 2003 2004 2005 2006 2007 2008 2009 2010 <strong>2011</strong><br />
Games<br />
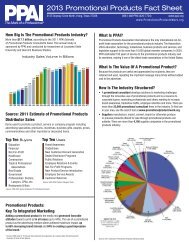
1.60% (1.52%)<br />
Automotive<br />
1.92% (1.69%)<br />
Textiles<br />
2.27% (3.15%)<br />
Stickers & Decals<br />
2.39% (2.26%)<br />
Other<br />
2.54% (2.90%)<br />
Magnets<br />
2.55% (2.02%)<br />
Sporting Goods<br />
2.59% (2.06%)<br />
Housewares<br />
2.70% (2.41%)<br />
Recognition/Awards/<br />
Trophies/Jewelry<br />
3.21% (3.77%)<br />
Electronic<br />
3.32% (3.12%)<br />
Computer <strong>Products</strong><br />
& Accessories<br />
3.76% (1.97%)<br />
Desk/<strong>Of</strong>fice/Business<br />
Accessories<br />
6.00% (5.28%)<br />
WEIGHT FOR <strong>2011</strong><br />
48.74% for companies 2.5 million<br />
or more in sales and 51.26% for<br />
companies wiith less than 2.5<br />
million in sales<br />
<strong>2011</strong> SALES BY PRODUCT CATEGORY<br />
(2010 Figures In Parentheses)<br />
Personal<br />
1.56% (1.37%)<br />
Drinkware<br />
6.68% (7.00%)<br />
Food Gifts<br />
1.52% (1.53%)<br />
Buttons/Badges/Ribbons<br />
1.49% (1.98%)<br />
Clocks and Watches<br />
1.16% (0.96%)<br />
Calendars<br />
6.93% (8.37%)<br />
Wearables<br />
29.64% (31.13%)<br />
Bags<br />
7.17% (6.46%)<br />
DISTRIBUTOR SALES VOLUME<br />
<strong>Distributor</strong> Number <strong>Of</strong> <strong>2011</strong> <strong>Sales</strong> % Increase/Decrease In<br />
Company Size <strong>Distributor</strong> Companies Volume <strong>Sales</strong> Volume Over 2010<br />
Less than $2.5 million 21,500 $9,083,857,500 6.75%<br />
$2.5 million or more 864 $8,638,088,190 7.27%<br />
INDUSTRY TOTAL 22,364 $17,721,945,690 7.02%<br />
How the estimate of distributor sales is obtained: Approximately 15,500<br />
promotional products distributors companies are surveyed by researchers at the<br />
University of Nevada and Glenrich Business Studies. A point estimate (mean) is<br />
derived and multiplied by the number of small distributor companies (21,500). To<br />
prevent distortion, a census of the larger distributor companies is conducted and the<br />
sum of their sales is added to the sales volume of the smaller distributor companies<br />
to arrive at the sales estimate for the entire industry.<br />
Writing<br />
Instruments<br />
8.99% (9.04%)<br />
Note: Percentages may not add up to 100% due to rounding error.<br />
This annual estimate of distributor sales is sponsored by <strong>Promotional</strong> <strong>Products</strong><br />
Association International and conducted by researchers at University of Nevada, Las<br />
Vegas and Glenrich Business Studies.<br />
PRODUCT CATEGORY (Includes the following:)<br />
Wearables: T-shirts, golf shirts, aprons, uniforms, blazers, caps,<br />
headbands, jackets, neckwear, footwear, etc.<br />
Writing Instruments: Pens, pencils, markers, highlighters, etc.<br />
Bags: Totebags, shopping bags, satchels, gift bags, drawstring bags,<br />
cosmetic bags, paper bags, duffel bags, briefcases, etc.<br />
Calendars/Dated <strong>Products</strong>: Wall and wallet calendars, desk diaries,<br />
pocket secretaries, etc.<br />
Drinkware: All glass, china, ceramic, crystal, plastic and stainless steel<br />
drinkware<br />
Desk/<strong>Of</strong>fice/Business Accessories: Folders, desk pen sets, calculators,<br />
non-dated paper products, cubed paper, scratch pads, adhesive notes,<br />
stationery, etc.<br />
Computer <strong>Products</strong> and Accessories: USB drives, Mouse pads, monitor<br />
frames, disk carriers, wrist pads, software, etc.<br />
Electronic Devices and Accessories: Radios, TVs, iPods, Mp-3 players,<br />
phones, videotapes, music CDs, phone cards, Flashing products etc.<br />
Recognition Awards/Trophies/Jewelry: Awards, trophies, plaques,<br />
certificates, figurines, jewelry, etc.<br />
Housewares/Tools: Measuring devices, kitchen products, picture<br />
frames, household decorations, ornaments, tool kits, first aid kits,<br />
furniture, flashlights, cutlery, weather instruments, etc.<br />
Sporting Goods/Leisure <strong>Products</strong>/Travel Accessories: Picnic/party<br />
products, camping equipment, barbecue items, bar products, binoculars,<br />
luggage, passport cases, etc.<br />
Magnets: Magnets and magnetic products<br />
Other: No examples reported<br />
Stickers and Decals: Stickers, decals, static clings, lettering, etc.<br />
Textiles: Flags, towels, umbrellas, pennants, throws, blankets, etc.<br />
Automotive Accessories: Key tags, bumper strips, road maps, floor<br />
mats, window shades, etc.<br />
Games/Toys/Playing Cards/ Inflatables: Balloons, Kites, balls, puzzles,<br />
stuffed plush, etc.<br />
Personal/Pocket-Purse <strong>Products</strong>: Pocket knives, grooming aids,<br />
lighters, matches, sunglasses, wallets, etc.<br />
Food Gifts: Candy, cookies, nuts, gourmet, meat, spices, bottled water &<br />
other drinks etc.<br />
Buttons/Badges/Ribbons: Buttons, badges, ribbons, signs, banners, etc.<br />
Clocks and Watches: Clocks, watches, etc.
Internal Promotions<br />
4.85% (4.44%)<br />
Safety Education<br />
5.44% (4.18%)<br />
Not-for-Profit<br />
Programs<br />
5.50% (7.86%)<br />
New Product/Service<br />
Introduction<br />
6.16% (9.13%)<br />
Customer Referral<br />
4.35% (3.76%)<br />
Employee Service Awards<br />
6.59% (4.72%)<br />
WEIGHT FOR <strong>2011</strong><br />
48.74% for companies with $2.5<br />
million or more in sales and<br />
51.26% for companies with less<br />
than $2.5 million in sales<br />
<strong>2011</strong> SALES BY PROGRAM CATEGORY<br />
(2010 Figures In Parentheses)<br />
Other<br />
3.56% (4.98%)<br />
Total online sales of promotional<br />
products for companies with<br />
less than $2,500,000 in sales<br />
Total online sales of promotional<br />
products for companies with<br />
sales of $2,500,000 or more<br />
TOTAL<br />
Size <strong>Of</strong> Company<br />
Less than $250,000<br />
$250,001-$500,000<br />
$500,001-$1,000,000<br />
$1,000,001-$2,500,000<br />
$2,500,001 or more<br />
TOTAL<br />
Marketing Research<br />
1.2% (1.38%)<br />
Employee Relations & Events<br />
9.40% (9.14%)<br />
Brand Awareness<br />
12.67% (11.30%)<br />
Dealer/<strong>Distributor</strong> Programs<br />
9.41% (7.59%)<br />
New Customer/Account Generation<br />
10.84% (11.52%)<br />
Trade Shows<br />
10.45% (9.28%)<br />
Public Relations<br />
9.58% (10.71%)<br />
Note: Percentages may not add up to 100% due to rounding error.<br />
ONLINE SALES OF PROMOTIONAL PRODUCTS – A LOOK BACK<br />
Online sales are defined as sales resulting from orders placed through an online store or website.<br />
PROGRAM TYPE (Includes the following:)<br />
Brand Awareness: Promotion of brand awareness<br />
and brand loyalty<br />
Trade Shows: Trade-show traffic generation<br />
New Customer/Account Generation: New<br />
customer or new account generation<br />
Dealer/<strong>Distributor</strong> Programs: Dealer incentives,<br />
co-op programs, company stores<br />
Public Relations: Corporate involvement with<br />
community, fundraising, sponsorship, school<br />
programs, media relations, corporate image<br />
Employee Relations & Events: Morale and<br />
motivation, corporate/employee events, employee<br />
orientation, organizational commitment/corporate<br />
identity, corporate communication, employee<br />
training (other than safety), employee referral<br />
programs<br />
Not-For-Profit Programs: Not-for-profit use for<br />
fundraising, public awareness campaigns (health,<br />
environment, public safety, etc.)<br />
New Product/Service Introduction: New product<br />
or service introduction<br />
Employee Service Awards: Anniversary<br />
recognition, service awards, etc.<br />
Customer Referrals: Customer referral incentive<br />
programs<br />
Internal Promotions (Incentive; Non-Safety):<br />
<strong>Sales</strong> incentive, TQM/quality programs,<br />
productivity, inventory reduction, error reduction,<br />
attendance improvement<br />
Safety Education/Incentive: Employee safety and<br />
education<br />
Other: No examples reported<br />
Marketing Research: Marketing research, survey<br />
and focus group participation programs<br />
2008 2009 2010 <strong>2011</strong><br />
$1,500,877,922 $1,253,115,203 $1,365,036,957 $1,275,870,533<br />
$1,377,168,383 $1,192,374,689 $1,351,856,824 $1,823,500,417<br />
$2,878,046,305 $2,445,489,892 $2,716,893,781 $3,099,370,950<br />
SEGMENTING INDUSTRY SALES BY SIZE OF COMPANY<br />
2008 2009 2010 <strong>2011</strong><br />
$1,614,791,538 $1,449,394,342 $1,431,535,859 $1,645,603,749<br />
$1,424,289,012 $1,141,927,375 $1,426,080,834 $1,618,544,334<br />
$2,480,709,538 $1,657,285,743 $1,945,140,287 $2,364,147,043<br />
$4,532,599,412 $3,529,885,418 $3,665,214,220 $3,455,562,374<br />
$8,048,909,308 $7,860,078,590 $8,092,190,875 $8,638,088,190<br />
$18,101,298,808 $15,638,571,468 $16,560,162,075 $17,721,945,690<br />
© 2012 <strong>Promotional</strong> <strong>Products</strong> Association International. All rights reserved. Subject to change without notice. UPIC: <strong>PPAI</strong>