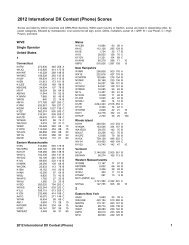
Doppler Tracking - ARRL
Doppler Tracking - ARRL
Doppler Tracking - ARRL

You also want an ePaper? Increase the reach of your titles
YUMPU automatically turns print PDFs into web optimized ePapers that Google loves.
Chuck McConaghy, WA6SYE<br />
212 Garnet Dr, Livermore, CA 94550; cmcconaghy@comcast.net<br />
1 Notes appear on page 37.<br />
30 QEX – March/April 2010<br />
<strong>Doppler</strong> <strong>Tracking</strong><br />
The author combines some simple electronics with a physics principle<br />
to measure speed and height of his model rocket launches.<br />
The “<strong>Doppler</strong> effect” is responsible for<br />
frequency shifts of the received signal just by<br />
virtue of movement of the reflecting or transmitting<br />
source. 1 It almost seems like you<br />
get something for nothing. By this I mean<br />
that no complex electronics are required to<br />
produce the frequency shift, and those that<br />
are required are familiar to the typical ham<br />
operator. The system that I will discuss uses<br />
some of my ham equipment.<br />
Most applications of the <strong>Doppler</strong> frequency<br />
shift have one thing in common:<br />
the object being measured is moving. These<br />
applications include radar to track incoming<br />
storms or fast moving motorists, medical<br />
applications to measure blood flow in arteries<br />
and veins, and astronomy applications to<br />
measure the speed of stars moving toward<br />
or away from Earth. Although the frequencies<br />
used, be they audio, RF, or optical, may<br />
differ for each application, the effect is the<br />
same.<br />
But what can Joe Ham do with the<br />
<strong>Doppler</strong> effect? My own interest in using<br />
the <strong>Doppler</strong> effect comes from a secondary<br />
hobby, model and high power rocketry.<br />
Do you think you have too many hobbies?<br />
While attending rocket launches at the<br />
Black Rock desert in Nevada, I all too often<br />
observed rockets that would make great<br />
ascents but have ballistic descents caused<br />
by parachute deployment problems. The<br />
result was a destroyed rocket and, electronics<br />
embedded in the desert floor. The thought<br />
occurred to me that if these rockets had<br />
some sort of inexpensive and sacrificial RF<br />
system, in case of a crash, maybe we could<br />
learn something about the speed and altitude<br />
of these imperfect flights.<br />
I didn’t want the project to be so sophisticated<br />
that it required extremely high RF<br />
power levels or specialized tracking antennas.<br />
For example, <strong>Doppler</strong> weather radars<br />
use many kilowatts of power. I was more<br />
interested in milliwatts. I did not consider<br />
a transponder because I thought it too complex.<br />
I was after simplicity. There was some<br />
previous work on transponder systems done<br />
by Steve Bragg, KA9MVA. Steve referred<br />
to his experimental work as the “Digital<br />
Amateur Rocket <strong>Tracking</strong> System.” 2 I also<br />
wanted to make use of ham radio equipment<br />
I already owned or could easily build.<br />
I decided early on to make use of the 23 cm<br />
band, and this decision was primarily based<br />
on owning an older ICOM IC-1271, which<br />
is a multi-mode 23 cm. transceiver. The SSB<br />
mode was very important to make these<br />
measurements, as this mode produces a tone<br />
from a CW signal. I was already familiar<br />
with the 23 cm band since I had worked<br />
ATV and FM repeaters on that band. It helps<br />
with <strong>Doppler</strong> to use as high a frequency as<br />
possible, since the <strong>Doppler</strong> frequency shift<br />
is proportional to the operating frequency.<br />
So, is the 23 cm band high enough in frequency<br />
to make some measurements? We<br />
shall see.<br />
Theory<br />
The <strong>Doppler</strong> shifted frequency is given by<br />
this formula:<br />
f rec= f (1+v/c) [Eq 1]<br />
where:<br />
f is the transmitted frequency<br />
f rec is the frequency of the wave arriving at<br />
the receiver<br />
v is the velocity of the transmitter relative to<br />
the receiver in meters per second.<br />
(v is positive when the transmitter and<br />
receiver move towards one another and<br />
negative when they move away from each<br />
other)<br />
c is the speed of the wave (3×10 8 m/s for<br />
electromagnetic waves traveling in air or a<br />
vacuum)<br />
∆f is the <strong>Doppler</strong> frequency shift.<br />
This equation assumes that we are using<br />
radio frequencies that propagate at the speed<br />
of light, and that the relative velocities of the<br />
transmitter and receiver are a small percentage<br />
of the speed of light. These are good<br />
assumptions for the applications I had in<br />
mind.<br />
What kind of frequency shift can we<br />
expect for 23 cm signals? For a velocity v =<br />
25 m/s — which is about 56 mph — a frequency<br />
shift of 108 Hz should result. Is this<br />
enough shift? Do we need higher speeds?<br />
Do we need higher frequencies? Frequency<br />
stability ultimately determines the frequency<br />
resolution and thus velocity resolution of the<br />
measurement. It turns out 100 Hz is enough<br />
shift for short-term — 1 minute or less<br />
— measurements. At 1200 MHz, 100 Hz<br />
corresponds to a stability of 0.08 parts per<br />
million (ppm). Modern transceivers, particularly<br />
those designed for SSB and CW, have<br />
stability specifications of at least 3 ppm. For<br />
example, my older IC-1271 has a stability
of 3 ppm, and a newer transceiver like the<br />
IC-9500 has 0.05 ppm stability. I have found<br />
the short-term stability, particularly when<br />
the temperature is constant, is much better<br />
than the specified values. The specified values<br />
assume long-term measurements over a<br />
50°C temperature range.<br />
Hardware and Software<br />
Figure 1 shows a simple experiment. The<br />
transmitter and receiver are close enough so<br />
the receiver can hear the transmitter at the<br />
low desired power levels. The car can be<br />
driven away from the receiver for one test<br />
and toward the receiver for another test. We<br />
need a receiver with SSB capability because<br />
we are basically tracking the tone produced<br />
in the receiver as it hears the unmodulated<br />
carrier from the transmitter. This is the same<br />
tone you hear when you listen to someone<br />
tune their transmitter. The bandwidth of<br />
most SSB receivers can handle the expected<br />
velocities and corresponding <strong>Doppler</strong> frequency<br />
shifts. For example a 2.4 kHz bandwidth,<br />
typical for an SSB receiver, would<br />
allow velocities as great as 581 m/s at 23 cm.<br />
Incidentally, Mach 1 (the speed of sound)<br />
is 340 m/s at 15°C. I used the previously<br />
mentioned IC-1271 for the receiver, but any<br />
modern day 23 cm multimode receiver or<br />
transceiver would suffice.<br />
ƒ rec = ƒ (1-v/c)<br />
ƒ rec = ƒ (1+v/c)<br />
Mobile<br />
23 cm Transmitter<br />
Mobile<br />
23 cm Transmitter<br />
The transmitter was custom built, but only<br />
because I had some specialized requirements.<br />
The transmitter needs only to generate a CW<br />
carrier of reasonable spectral purity and low<br />
drift. This is fairly easy to accomplish with<br />
modern phase-locked-loop circuits and crystal<br />
oscillators. The transmitter consists of a<br />
crystal reference oscillator, a PLL chip with<br />
self contained EEPROM, and a power amplifier<br />
chip. Size (23 mm × 100 mm) and power<br />
supplied
Figure 2 — Part A shows the<br />
transmitter circuit board, and Part B is<br />
a schematic diagram of the transmitter.<br />
Part C shows a model rocket, with an<br />
expanded photo showing the location<br />
of the transmitter board<br />
32 QEX – March/April 2010<br />
(A)<br />
(B)<br />
(C)
23 cm Transmitter<br />
QX1003-McConaghy03<br />
23 cm Receiver Computer<br />
Figure 3 — This drawing shows a transmitter spinning on the end of a lasso.<br />
Figure 4 — This spectrogram shows the data for the example of Figure 3. You can measure the rotation period of 0.81 s over most of the<br />
waveform, with a peak to peak <strong>Doppler</strong> shift near 100 Hz. This corresponds to a velocity of 11 m/s.<br />
QEX – March/April 2010 33
4) Start the Spectrogram software and<br />
you will see it displaying a horizontal line at<br />
the frequency of the tuned tone. There may<br />
be some drift to this line if the transmitter is<br />
drifting.<br />
The analysis of the data requires establishing<br />
a reference line, that is, a frequency<br />
when the object being measured is standing<br />
still. This frequency is arbitrary and just<br />
needs to be in the audio pass-band of both<br />
the receiver as well as the computer sound<br />
card. What we are interested in is the frequency<br />
changes from this reference value.<br />
For example, the baseline value in Figure 7<br />
was 1382 Hz. Everything is referenced to<br />
this baseline value. The peak frequency is<br />
1703 Hz. The difference between peak and<br />
baseline is 321 Hz. The conversion to velocity<br />
is done using Equation 1, f rec = f (1+v/c),<br />
which can be simplified to<br />
v = c × ∆f / f [Eq 2]<br />
for small <strong>Doppler</strong> shifts in comparison to the<br />
radio frequency. For a 1260 MHz RF signal:<br />
v = ∆f × 0.238 m/s [Eq 3]<br />
Applications<br />
As previously mentioned, my original<br />
motivation came from tracking rockets<br />
but my first proof of principle experiment<br />
34 QEX – March/April 2010<br />
involved putting the transmitter at the end of<br />
a 5 foot long string and swinging the transmitter<br />
in a circular pattern above my head,<br />
much like a cowboy about to rope a steer. For<br />
this test, the receiver is located several feet<br />
outside and away from the circular trajectory<br />
of the transmitter. In fact, the receiver can<br />
be located as far away from the transmitter<br />
as signal levels will permit and the same<br />
spectrogram will result. Figure 3 shows this<br />
arrangement. Swinging the transmitter in a<br />
circle results in a <strong>Doppler</strong> frequency increase<br />
as the transmitter moves toward the receiver<br />
and then a <strong>Doppler</strong> frequency decrease as the<br />
transmitter moves away from the receiver.<br />
This produces a roughly sinusoidal pattern,<br />
which repeats for every circle the transmitter<br />
traces out. The faster you swing the transmitter,<br />
the greater the <strong>Doppler</strong> shift.<br />
The data I collected in this experiment is<br />
shown in Figure 4. It is possible to interpret<br />
the rotation period as 0.81 s, the frequency<br />
shift as 100 Hz, or about 50 Hz positive as<br />
the transmitter moves toward the receiver<br />
and 50 Hz negative as the transmitter moves<br />
away from the receiver. Finally, the velocity<br />
from the <strong>Doppler</strong> data is about 11 m/s. For a<br />
5 ft (1.5 m) rope and a 0.84 s period, we can<br />
verify by calculation that the frequency shift<br />
is ±50 Hz. The same effect could also be<br />
achieved with the transmitter at a fixed location<br />
and swinging the antenna. The antenna<br />
is located at the end of a coaxial cable tether.<br />
In fact, the latter is the basis of a popular<br />
direction finding (DF) antenna, but in the<br />
DF <strong>Doppler</strong> antenna, rotation is accomplished<br />
using electronic switching rather than<br />
mechanical motion as was done here. 5<br />
A second application I tried was to have<br />
the receiver and receive antenna at a fixed<br />
location on the side of a road and to mount<br />
the transmitter inside a vehicle as shown<br />
in Figure1. I then drove the vehicle, initially<br />
located several hundred feet from the<br />
receiver, at a constant velocity, say 60 mph,<br />
toward the receiver and continued on at this<br />
constant velocity several hundred feet down<br />
the road past the receiver. When the vehicle<br />
is at zero velocity there is no frequency shift.<br />
Upon accelerating to 60 mph, however,<br />
and then remaining at this velocity there<br />
is a positive frequency shift (from the zero<br />
velocity frequency). As the vehicle passes<br />
the receiver, the received signal makes an<br />
abrupt drop in frequency to a new frequency<br />
that is negative (below the zero velocity frequency)<br />
because now the vehicle has passed<br />
the receiver and is moving away from it.<br />
Figure 5 shows the spectrogram for this data.<br />
The velocity doesn’t have to be constant and<br />
Figure 5 — This spectrogram shows data for the moving car experiment. The transmitter is in car moving past the receiver at near constant<br />
velocity after an initial acceleration. The abrupt frequency change is 207 Hz. The velocity of the car is 24 m/s (55 mph). The frequency change<br />
is twice the <strong>Doppler</strong> shift, since it goes from positive to negative as the car passes the receiver. You can also see a region of deceleration as<br />
the car slows down after passing the receiver.
definitely is not during the acceleration and<br />
braking portions. The spectrogram provides<br />
a direct readout of the velocity profile. This<br />
might be useful for telling how long it takes<br />
to brake a vehicle as well as how fast a vehicle<br />
might go from 0 to 60 mph.<br />
The third application is model rocketry<br />
tracking, which most definitely uses a variable<br />
velocity profile. From this profile such<br />
things as fuel burnout time, peak velocity,<br />
altitude and time to the ejection charge can<br />
be directly observed. Since I began this work<br />
several years back and in the intervening<br />
years a number of manufacturers have come<br />
up with on-board data recorders that use<br />
MEMS sensors to measure both acceleration<br />
and atmospheric pressure to come up with<br />
these same parameters. Although these on<br />
board measurement units work fine, they are<br />
more complex than a simple transmitter, and<br />
also do not have real-time readout. Some of<br />
them do have additional telemetry transmitters.<br />
Again my goal was to keep the on-board<br />
electronics portion simple and inexpensive.<br />
In rocketry, the <strong>Doppler</strong> frequency shift is<br />
always downward upon liftoff. This of course<br />
assumes the rocket is moving away from the<br />
receiver as shown in Figure 6. If it isn’t, that<br />
is a completely different problem since I<br />
normally locate the receive antenna near the<br />
launch pad. If the ejection charge occurs at<br />
Rocketborne<br />
23 cm Transmitter<br />
Rocketborne<br />
23 cm Transmitter<br />
Stationary<br />
23 cm Receiver<br />
Figure 6 — Here is a drawing that shows the<br />
model rocketry application. QX1003-McConaghy06 The transmitter<br />
in the rocket is moving away from the<br />
receiver, which is on the ground.<br />
or before apogee, the frequency shift will be<br />
negative through the entire flight. In general<br />
there isn’t enough resolution to measure the<br />
positive velocity seen as the rocket slowly<br />
descends back under a parachute. Of course<br />
if the rocket comes in ballistic, that would<br />
easily be visible on the spectrogram.<br />
Some of the data I took showed a positive<br />
frequency shift upon launch but that was<br />
only from accidentally using the LSB (lower<br />
sideband) selection on the receiver rather<br />
than the USB (upper sideband) selection. The<br />
LSB selection causes a frequency inversion<br />
of the data.<br />
Figure 7 shows the spectrogram for a<br />
single stage rocket. The maximum frequency<br />
change is 321 Hz, which corresponds to the<br />
peak velocity of 76.4 m/s (171 mph). From<br />
the peak velocity, which occurs just as the<br />
engine burns out, there is a gradual decrease<br />
in velocity to a 74 Hz frequency change<br />
which corresponds to 17.6 m/s (39 mph). At<br />
this point an ejection charge goes off slowing<br />
the rocket to near zero frequency shift. The<br />
ejection occurred fairly close to apogee, as<br />
the rocket was approaching zero velocity.<br />
The spectrogram for a two stage rocket is<br />
shown in Figure 8. From this spectrogram,<br />
we can determine that the first stage burned<br />
for 1.5 s with a <strong>Doppler</strong> shift of 119 Hz, corresponding<br />
to a speed of 28.3 m/s (63.4 mph)<br />
Figure 7 — Here is a spectrogram showing the data a for single stage rocket. The transmitter is on a rocket. The maximum frequency change<br />
is 321 Hz and corresponds to a peak velocity of 76.4 m/s (171 mph), at which point the engine shuts down and the velocity slows down to<br />
17.6 m/s (39 mph) as indicated by only a 74 Hz <strong>Doppler</strong> shift. At 5.6 s after launch the ejection charge fires slowing the velocity back to the<br />
baseline. When the rocket is dropping safely under a parachute, there will be little <strong>Doppler</strong> shift.<br />
Stationary<br />
23 cm Receiver<br />
QX1003-McConaghy06<br />
QEX – March/April 2010 35
Figure 8 — This spectrogram shows the data for a two stage rocket. The transmitter is on a two stage rocket. The first stage burns for 1.5 s and<br />
at this point the <strong>Doppler</strong> shift is 119 Hz or 28.3 m/s ( 63.4 mph). The second stage burns for an additional 2.5 s, at which point the <strong>Doppler</strong> shift<br />
is 409 Hz or 97.3 m/s (218 mph) at this point all the fuel is burned and a slow down occurs for an additional 3.4 s, at which time the <strong>Doppler</strong><br />
shift is 160 Hz or 38 m/s (85.2 mph) . At this point the ejection charge fired but shook the battery connection disabling the RF transmitter<br />
at the end of first stage burnout. Further, the<br />
spectrogram shows the second stage burned<br />
for an additional 2.5 s with a <strong>Doppler</strong> shift<br />
of 409 Hz, which corresponds to a speed of<br />
97.3 m/s (218 mph) before the second stage<br />
fuel was fully burned. After that, a gradual<br />
decrease in speed is observed for an additional<br />
3.4 s, at which time the ejection charge<br />
fired but shook the battery connection, disabling<br />
the RF transmitter. Just prior to the<br />
ejection, the rocket was still traveling upward<br />
at a speed of 38 m/s (85.2 mph) as evidenced<br />
by the <strong>Doppler</strong> shift of 160 Hz.<br />
Further analysis of the velocity curves<br />
can produce altitude data, or more generally,<br />
distance data. This is accomplished by<br />
integrating the data shown in Figures 7 and<br />
8 with a simple Microsoft Excel spreadsheet.<br />
The altitude plots are shown in Figures 9<br />
and 10. A peak altitude of 250 m (820 ft) is<br />
achieved by the single stage flight and a peak<br />
altitude of 370 m (1213 ft) is achieved by the<br />
two stage flight.<br />
Summary<br />
The <strong>Doppler</strong> effect can be used by hams<br />
to make speed measurements of cars, swinging<br />
transmitters, rockets and other moving<br />
platforms. By separating the transmitter and<br />
receiver, using readily available computers<br />
and software, these measurements can be<br />
36 QEX – March/April 2010<br />
performed by hams with off-the-shelf radios<br />
and lower power levels. It is a lot less complex<br />
than you might normally expect for a<br />
“<strong>Doppler</strong> radar” system.<br />
Acknowledgements<br />
I would like to thank both Asher Blum<br />
and Rick Schnetz, WA6RAI, for taking time<br />
Distance (Meters)<br />
300<br />
250<br />
200<br />
150<br />
100<br />
50<br />
0<br />
to read this article and for making suggestions<br />
to clarify the content.<br />
Chuck McConaghy, WA6SYE, has been<br />
a ham since 1971, when he was originally<br />
licensed as WN9IBX. He currently holds an<br />
Advanced class license. Over the years, Chuck’s<br />
Amateur Radio activities have included UHF<br />
repeater construction, ATV, amateur satellites<br />
QX1003-McConaghy09<br />
4 5 6 7 8 9 10 11 12 13<br />
Time (Seconds)<br />
Figure 9 — This data is produced by integrating Figure 7. It shows that a peak altitude of just<br />
near 250 meters (820 ft) occurs at the 12 s point. (The launch began at the 6 s point)
and PSK31. He retired in 2007 after 35 years<br />
at Lawrence Livermore National Laboratory,<br />
where he worked on everything from high<br />
speed X-ray diagnostics, integrated optics,<br />
ASIC design and MEMS sensors. He holds a<br />
BSEE degree from Purdue University and an<br />
MSEE degree from Stanford University.<br />
Notes<br />
1 For more information about the <strong>Doppler</strong><br />
effect, see: //en.wikipedia.org/wiki/<br />
<strong>Doppler</strong>_effect.<br />
2 There is more information about the DARTS<br />
Distance (Meters)<br />
0<br />
50<br />
100<br />
150<br />
200<br />
250<br />
300<br />
350<br />
project at www.hamhud.net/darts.<br />
3 For information about the RockSim software<br />
and other model rocketry information and<br />
supplies, see: www.apogeerockets.com<br />
4 You can obtain more information and<br />
download a 10-day trial version of the<br />
Spectrogram software at the Visualizations<br />
Software Web site at: www.visualizationsoftware.com/gram.html<br />
(At press<br />
time this Web site was listed as “Under<br />
Construction.” You can also download an<br />
older version (5.17) of the Spectrogram software<br />
free at: www.dxzone.com/cgi-bin/dir/<br />
jump2.cgi?ID=2056.<br />
5 Terrence Rogers WA4BVY, “A DoppleScAnt,”<br />
QST, May 1978, pp 24-28.<br />
QX1003-McConaghy10<br />
400<br />
6 7 8 9 10 11 12 13 14 15<br />
Time (Seconds)<br />
Figure 10 — This data is produced by integrating Figure 8. It shows that a peak altitude of just<br />
near 370 meters (1200 ft) occurs at the 15 s point. (The launch began at the 8 s point)<br />
QEX – March/April 2010 37