Extreme Wave Effects on Deep Water TLPs : Lessons Learned from ...
Extreme Wave Effects on Deep Water TLPs : Lessons Learned from ...
Extreme Wave Effects on Deep Water TLPs : Lessons Learned from ...

You also want an ePaper? Increase the reach of your titles
YUMPU automatically turns print PDFs into web optimized ePapers that Google loves.
<str<strong>on</strong>g>Extreme</str<strong>on</strong>g> <str<strong>on</strong>g>Wave</str<strong>on</strong>g> <str<strong>on</strong>g>Effects</str<strong>on</strong>g> <strong>on</strong> <strong>Deep</strong> <strong>Water</strong> <strong>TLPs</strong><br />
Less<strong>on</strong>s <strong>Learned</strong> <strong>from</strong> the Snorre A Model Tests<br />
T.B.Johannessen (Aker Kværner Engineering & Technology) 1 , S.Haver (Statoil),<br />
T.Bunnik & B.Buchner (MARIN)<br />
Abstract<br />
In the last few years there has been an increasing focus within the shipping and offshore<br />
industry <strong>on</strong> extreme wave events and abnormal wave c<strong>on</strong>diti<strong>on</strong>s. Hurricanes Rita and Katrina<br />
last year c<strong>on</strong>firmed the importance of these extreme waves for all types of offshore structures.<br />
When they are not properly taken into account in the design, they can threaten the integrity<br />
and safety of a platform. Based <strong>on</strong> model tests and simulati<strong>on</strong>s <strong>on</strong> the Statoil operated Snorre<br />
A, the present paper discusses the following issues:<br />
• Why should we focus <strong>on</strong> accidental wave events?<br />
• How should we analyse them?<br />
• How do we carefully take into account the inherent randomness of extreme waves?<br />
• What are the available measures we can take in the design?<br />
• What are the less<strong>on</strong>s learned for deepwater <strong>TLPs</strong> in hurricane c<strong>on</strong>diti<strong>on</strong>s?<br />
The paper discusses these issues based <strong>on</strong> an extensive series of model tests with the Snorre<br />
A. The airgap, wave loads and platform resp<strong>on</strong>se were measured. The TLP was subjected to a<br />
range of wave height-wave period combinati<strong>on</strong>s and l<strong>on</strong>g time durati<strong>on</strong>s of storms were used<br />
to get sufficient insight in the statistics of the extremes.<br />
Further numerical simulati<strong>on</strong>s were carried out with a Volume of Fluid (VoF) method<br />
coupled to a time domain simulati<strong>on</strong> model. The VoF method computes the hydrodynamic<br />
loads, which are subsequently applied as external force in the moti<strong>on</strong> model. The numerical<br />
simulati<strong>on</strong>s give a lot of insight in the loading and resp<strong>on</strong>se process of <strong>TLPs</strong>.<br />
1 Corresp<strong>on</strong>ding Author: P.O.Box.222, 1326 Lysaker, Norway<br />
Email: thomas-b.johannessen@akerkvaerner.com
Introducti<strong>on</strong><br />
The Snorre A<br />
The Snorre A was installed in the Tampen area in the Northern North Sea in 1992. The Snorre<br />
A was the third tensi<strong>on</strong> leg platform (TLP) to be installed after the Hutt<strong>on</strong> TLP and the Jolliet<br />
TLP. The main particulars of the Snorre A are shown in Table 1 for a characteristic present<br />
loading c<strong>on</strong>diti<strong>on</strong> at the mean sea level (MSL).<br />
Displacement 108 491 Mt<br />
Mass 80 754 Mt<br />
Tether Tensi<strong>on</strong> 24340 Mt<br />
Riser Tensi<strong>on</strong> 3397 Mt<br />
Column c-c spacing 76 m<br />
Column Diameter 25 m<br />
P<strong>on</strong>to<strong>on</strong> Height x Width 11.5 m x 11.5 m<br />
P<strong>on</strong>to<strong>on</strong> Bilge Radius 2.0 m<br />
Underside of Double Bottom of Deck 64.5 m above keel<br />
<strong>Water</strong> Depth 308 m<br />
Draft 38.3 m<br />
Natural period in Surge & Sway 84 s<br />
Natural Period in Yaw 69 s<br />
Natural Period in Heave 2.3 s<br />
Natural Period in Roll & Pitch 2.4 s<br />
Table 1 Snorre A Main Particulars at MSL<br />
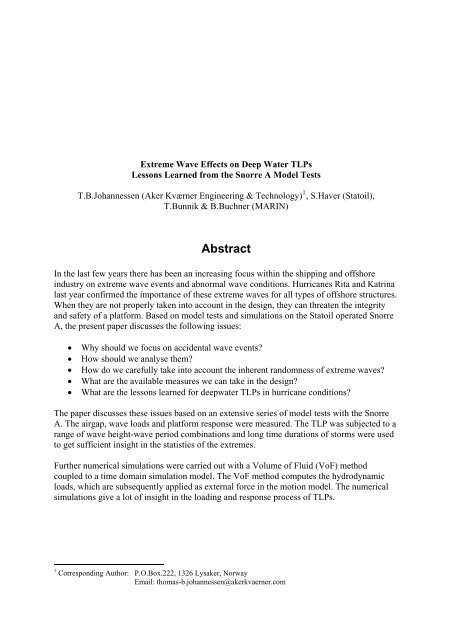
Figure 1 and Figure 2 show respectively an artist’s impressi<strong>on</strong> and an aerial photo of the<br />
Snorre A as it stands today. The hull is tethered to the seabed via 16 steel tethers. The tethers<br />
are lead <strong>from</strong> the c<strong>on</strong>crete foundati<strong>on</strong>s up through tether c<strong>on</strong>duits inside the columns and<br />
terminated at the mooring flats above the sea surface level.<br />
Figure 1 Artist’s impressi<strong>on</strong> of the Snorre A Figure 2 Recent aerial photo of the Snorre A
In 2003 the present operator, Statoil ASA, carried out a technical safety review for the Snorre<br />
A. Am<strong>on</strong>g other issues, tether integrity was identified as a subject that should be checked<br />
more thoroughly. There were a number of reas<strong>on</strong>s for this:<br />
• The design basis was changed in the mid-nineties. As will be discussed in a later<br />
secti<strong>on</strong>, tether slack was downgraded <strong>from</strong> a ULS limit to a practical limit similar to<br />
an SLS limit (ULS, ALS and SLS are explained later) in order to allow for an<br />
increased payload capacity. As a c<strong>on</strong>sequence, tethers will be more highly utilised in<br />
the governing tether slack scenario.<br />
• In the original design, the characteristic wave induced loads were estimated using the<br />
most probable maximum in the 100-year sea state as the 100-year resp<strong>on</strong>se. Since then<br />
it has been realised that this method will give a value lower than the 100 year target<br />
return period for the load effects. It is now comm<strong>on</strong> to use the 90% quantile in the<br />
governing seastate rather than the most probable maximum to obtain a more accurate<br />
estimate.<br />
• Finally, the latest predicti<strong>on</strong>s of the Northern North Sea wave c<strong>on</strong>diti<strong>on</strong>s<br />
corresp<strong>on</strong>ding to an annual exceedance probability of 10 -4 are somewhat more severe<br />
than what was originally adopted.<br />
In view of these subjects the c<strong>on</strong>cern was that there could be a larger probability of major<br />
wave-deck impacts than assumed in design. A major wave-deck impact will increase the<br />
tether loading c<strong>on</strong>siderably.<br />
In order to ensure that the Snorre A is safe with respect to extreme tether loading, Aker<br />
Kværner carried out a comprehensive tether integrity reanalysis study in 2003 and 2004. The<br />
study included a large model testing programme carried out at the facilities of MARIN in the<br />
Netherlands together with extensive analysis work, the establishment of an updated<br />
operati<strong>on</strong>al weight margin and the evaluati<strong>on</strong> of tether resp<strong>on</strong>se to slack events. A main<br />
object of the present paper is to present how the model test experiment was designed in order<br />
to cope with both an extremely complicated loading mechanism and the inherent<br />
simultaneous behaviour of the various dynamic comp<strong>on</strong>ent processes.<br />
Badly Behaved Problem Types<br />
In additi<strong>on</strong> to the presentati<strong>on</strong> of the Snorre A model testing activity, the purpose of the<br />
present paper is to put focus <strong>on</strong> a more general design challenge; what is referred to within the<br />
present paper as the ‘badly behaved problem type’. A badly behaved problem property may<br />
be realised for a large number of dynamic systems and is best explained at this stage with an<br />
example:<br />
C<strong>on</strong>sider a hypothetical and relatively slender TLP structure supporting a large and relatively<br />
impenetrable topside structure. It has been shown c<strong>on</strong>clusively that the 100 year wave crest<br />
has a small margin against impacting with the topside and is shown to give relatively low<br />
loads in the tethers and the TLP. The applicati<strong>on</strong> of the hundred year load with the<br />
appropriate safety factors poses no structural difficulties. The TLP structure will not sustain<br />
damage in the 100 year c<strong>on</strong>diti<strong>on</strong>.<br />
At a marginally larger return period, however, the wave crest will impact with the topside<br />
transferring loads to the structure which are very much larger than the 100 year load even<br />
including the safety factors in the 100 year load. In the worst scenario, the TLP may capsize<br />
either due to tether overloading or accidental tether disc<strong>on</strong>necti<strong>on</strong> due to excessive tether<br />
slack.
Whereas an annual probability of damage to the structure of 1/100 is usually acceptable, the<br />
annual probability of loss of the producti<strong>on</strong> unit, loss of life or major ec<strong>on</strong>omic or<br />
envir<strong>on</strong>mental impact should clearly be much lower than this (1/10000 in the Norwegian<br />
sector). For a relatively smooth load mechanism, the safety factors used <strong>on</strong> the 100 year loads<br />
will usually ensure that that there are sufficient margins against collapse of the unit. For badly<br />
behaved load mechanisms like in the example above, the design needs to be able to capture<br />
the very rare events which are governing by focusing also <strong>on</strong> significantly larger waves than<br />
the 100 year waves.<br />
In additi<strong>on</strong> to the probability of serious damage discussed above, the badly behaved load<br />
mechanism will be unstable with respect to the accuracy of the envir<strong>on</strong>mental and<br />
hydrodynamic modelling. If the envir<strong>on</strong>mental c<strong>on</strong>diti<strong>on</strong>s or the crest height associated with<br />
the 100 year load are marginally underestimated, the resulting 100 year tether loads will be<br />
very much larger than the calculated loads. The safety factors which are intended to capture<br />
these uncertainties will not be appropriate and a sec<strong>on</strong>d accidental design check at a lower<br />
probability level will again be necessary.<br />
Overview of the paper<br />
Whereas the comparis<strong>on</strong> between Snorre A model test and analysis results was the focus of a<br />
previous paper /5/, the focus of the present paper is the badly behaved problem type and <strong>on</strong><br />
how to ensure that such a property is captured by model tests. Although the badly behaved<br />
problem type is not a TLP specific problem, the focus here is <strong>on</strong> TLP tether loading. The<br />
recent Snorre A work is used to illustrate the ideas. Finally, some recent results using an<br />
improved Volume of Fluids (iVOF) solver are presented. Badly behaved problems are by<br />
nature extremely difficult to capture using traditi<strong>on</strong>al analysis methods and the VOF method<br />
may be <strong>on</strong>e way to capture these effects numerically.<br />
TLP Tether Loading Mechanism<br />
For a TLP, the single most critical structural comp<strong>on</strong>ent is the tether. Failure of the tether<br />
system may lead to loss of hydrostatic stability followed by a capsizing of the producti<strong>on</strong> unit.<br />
Tether loads must be kept within acceptable limits both with respect to maximum tether<br />
loading and associated overloading of the tethers, but also with respect to minimum tether<br />
loading since slack in tethers may be as critical as tether overloading.<br />
The total load level in the tethers is the sum of several comp<strong>on</strong>ents:<br />
1. Pretensi<strong>on</strong> at the mean sea level<br />
The principle of the TLP is that mass is significantly lower than the displacement<br />
yielding significant static loads in the anchor system. This pretensi<strong>on</strong> ensures that the<br />
moti<strong>on</strong> in the vertical directi<strong>on</strong>s is very small, limits the offset and setdown and<br />
ensures a positive tensi<strong>on</strong> in the tethers.<br />
2. Tide and weather dependent pseudo-static tether loads<br />
With varying tidal levels, current, waves and wind the tethers will experience a<br />
variati<strong>on</strong> in the pretensi<strong>on</strong> with time scales ranging <strong>from</strong> minutes to days. These<br />
tether loads include loads which affect all tethers equally and also overturning<br />
moment loads which yield different resp<strong>on</strong>se in the tethers: A positive tide increases<br />
the pretensi<strong>on</strong> in all tethers whereas wind <strong>from</strong> the NW yields increased pretensi<strong>on</strong> in<br />
the NW and reduced pretensi<strong>on</strong> in the SE.
3. Weather dependent dynamic tether loads.<br />
The largest part of the variable tether loading stems <strong>from</strong> dynamic tether loading due<br />
to weather with time scales ranging <strong>from</strong> a few sec<strong>on</strong>ds to a few minutes. The<br />
dynamic tether loading includes loads incurred due to the wave and wind induced<br />
slow moti<strong>on</strong> of the TLP in surge, sway and yaw (least important) via the (very<br />
important) direct resp<strong>on</strong>se to storm wave loading to the (relatively important) impulse<br />
or ringing (or springing) loading which yields rapid tether tensi<strong>on</strong> oscillati<strong>on</strong>s close to<br />
the natural period in heave, roll and pitch. The interdependency of these effects and<br />
their complex dependence <strong>on</strong> TLP- and weather- properties, make the accurate<br />
predicti<strong>on</strong> of these loads a formidable challenge.<br />
4. Loads due to the operati<strong>on</strong> of the producti<strong>on</strong> unit<br />
The tethers also resp<strong>on</strong>d to the day to day operati<strong>on</strong> of the TLP. As the total<br />
pretensi<strong>on</strong> is the difference between the displacement and the TLP mass, the<br />
pretensi<strong>on</strong> will reduce when mass is brought <strong>on</strong> board the TLP. But also the<br />
horiz<strong>on</strong>tal shift of masses (and thus a shift in the horiz<strong>on</strong>tal centre of gravity) <strong>on</strong> the<br />
producti<strong>on</strong> unit, will affect the tether pretensi<strong>on</strong>: moving the derrick towards the N,<br />
for example, will lead to a reducti<strong>on</strong> in tensi<strong>on</strong> in the N tethers and an equal increase<br />
in tether tensi<strong>on</strong> in the S tethers.<br />
In order to determine the updated operati<strong>on</strong>al margin of the platform (point 4 above) it is<br />
absolutely necessary to determine both the maximum and minimum permitted total load<br />
levels in the tethers and also the load levels which must be kept in reserve in the event of<br />
adverse weather. Here we will not c<strong>on</strong>sider the resulting operati<strong>on</strong>al margin - the focus in the<br />
following is <strong>on</strong> setting maximum and minimum load levels due to adverse weather (point 2<br />
and 3 above).<br />
Limit State C<strong>on</strong>trol and Badly Behaved Problems<br />
Limit State C<strong>on</strong>trol<br />
According to Norwegian Rules and Regulati<strong>on</strong>s see e.g. [1] and [2], an offshore structure is to<br />
be c<strong>on</strong>trolled against overload failures at two levels; Ultimate Limit State c<strong>on</strong>trol (ULS) and<br />
Accidental Limit State c<strong>on</strong>trol (ALS).<br />
In the ULS c<strong>on</strong>trol, it must be shown that the structure can sustain the 100 year load level<br />
without damage. In the c<strong>on</strong>text of TLP tethers, the ULS c<strong>on</strong>trol must be carried out for 100<br />
year excursi<strong>on</strong>s both above and below the tether pretensi<strong>on</strong> level. The ULS c<strong>on</strong>trol is<br />
assumed to be satisfied if the characteristic load multiplied by a load factor is smaller than the<br />
characteristic capacity divided by a material factor.<br />
According to [1] and [2], the ULS c<strong>on</strong>trol is to be checked for two formulati<strong>on</strong>s:<br />
i) ULS-a: Safety factors larger than 1 is used for the permanent and functi<strong>on</strong>al loads,<br />
while a load factor less than 1 is used for the characteristic envir<strong>on</strong>mental loads<br />
ii) ULS-b: Permanent and functi<strong>on</strong>al loads are now used with a safety factor equal to 1,<br />
while the characteristic envir<strong>on</strong>mental load is multiplied by a load factor larger than<br />
1.<br />
For the problem c<strong>on</strong>sidered in this paper, ULS-b will be governing and we will c<strong>on</strong>centrate<br />
<strong>on</strong> this ultimate limit state in the following.
The ALS c<strong>on</strong>trol is primarily introduced for accidental loads like ship collisi<strong>on</strong> and loads<br />
<strong>from</strong> fires and explosi<strong>on</strong>s. In these c<strong>on</strong>trols the loads should have an annual exceedance<br />
probability of 10 -4 . The material factor in the ALS c<strong>on</strong>trol is often set equal to 1.0, but the<br />
characteristic capacity can be taken as the capacity corresp<strong>on</strong>ding to structural failure such<br />
that system effects and n<strong>on</strong>-linear structural properties are utilized. This implies that local<br />
damage is permissible in c<strong>on</strong>necti<strong>on</strong> with the ALS c<strong>on</strong>trol, but that the overall integrity<br />
should not be put at risk.<br />
As the example in the introducti<strong>on</strong> has illustrated, excessive envir<strong>on</strong>mental loads could be just<br />
as dangerous as traditi<strong>on</strong>al accidental loads and the rules and regulati<strong>on</strong>s <strong>on</strong> the Norwegian<br />
sector therefore require that the ALS c<strong>on</strong>trol is to be enforced also for envir<strong>on</strong>mental loads. In<br />
this c<strong>on</strong>necti<strong>on</strong> the characteristic envir<strong>on</strong>mental load effect should corresp<strong>on</strong>d to an annual<br />
exceedance probability of 10 -4 , while the load factor is set to 1.0.<br />
In additi<strong>on</strong> to the limit states above, the Serviceability Limit State (SLS) c<strong>on</strong>diti<strong>on</strong> c<strong>on</strong>cerns<br />
the structure’s ability to be operated in a practical and efficient manner whereas the Fatigue<br />
Limit State (FLS) c<strong>on</strong>cerns the structure’s resistance to fatigue damage. In practical design<br />
work these will also have to be c<strong>on</strong>sidered, but the present focus is <strong>on</strong> the overload limit states<br />
ULS and ALS.<br />
Treatment of Badly Behaved Problems in Limit State C<strong>on</strong>trol<br />
For the ULS c<strong>on</strong>trol, the characteristic envir<strong>on</strong>mental load effect, xc, is defined as the load<br />
effect corresp<strong>on</strong>ding to an annual exceedance probability of 10 -2 . The characteristic capacity,<br />
yc, is taken as a lower percentile (often 5%) of the distributi<strong>on</strong> of the elastic comp<strong>on</strong>ent<br />
capacity. Uncertainties of various origins will be associated with both xc and yc and in order to<br />
ensure a sufficient margin against structural failure, partial safety factors, γf and γm, are<br />
introduced, i.e. the ULS c<strong>on</strong>trol reads (when neglecting permanent and functi<strong>on</strong>al loads for<br />
illustrati<strong>on</strong> purposes):<br />
y<br />
c γ f xc<br />
≤ (1)<br />
γ m<br />
For the ULS –b c<strong>on</strong>trol, γf = 1.3 and γm = 1.15 will in most cases have to be used. In the<br />
c<strong>on</strong>text of TLP tether analysis, the load factors are applied <strong>on</strong> the tether load since the<br />
complexity of tether resp<strong>on</strong>se offers no meaningful way to apply load factors directly <strong>on</strong> the<br />
envir<strong>on</strong>mental load.<br />
Provided gross errors are avoided by an adequate quality assurance procedure, the distributi<strong>on</strong><br />
functi<strong>on</strong> reflecting the uncertainties in the capacity is typically well behaved, i.e. yc/γm is<br />
expected to be a robust estimate of the design capacity. For offshore structures, the nature of<br />
the load side of the problem is very different. With a very low annual probability, the<br />
structure can face loads significantly larger than the characteristic load.<br />
The values given above for γf and γm are meant to account for the typical levels of variability<br />
associated with xc and yc. Provided that the distributi<strong>on</strong> of the annual largest load is well<br />
behaved in the upper tail, i.e. there is no dramatic shift in the shape of the distributi<strong>on</strong> tail for<br />
annual exceedance probabilities in the range 10 -2 – 10 -4 , the design will be governed by the<br />
ULS c<strong>on</strong>trol. This means that if the structure fulfils Eq.(1), the annual probability of structural<br />
failure is sufficiently small.
If, however, the underlying load mechanism worsens abruptly for an annual exceedance<br />
probability between 10 -2 and 10 -4 , fulfilling the ULS c<strong>on</strong>trol may not lead to a sufficiently low<br />
failure probability. Such an abrupt shift is illustrated in Figure 3. It is seen that for the well<br />
behaved system (subscript wbp), γ f xc<br />
will give a design load level corresp<strong>on</strong>ding to an<br />
annual exceedance probability typically lower than 10 -4 . For the badly behaved problem<br />
(subscript bbp), however, it is seen that that is far <strong>from</strong> the case. The product, γ f xc<br />
,<br />
corresp<strong>on</strong>ds to an annual exceedance probability significantly larger than the accidental level<br />
of 10 -4 .<br />
Load level<br />
x ALS-bbp<br />
1.3x c<br />
xALS-wbp xc 1 2 3 4 5<br />
- log (annual exceedance probability)<br />
Bad-behaving problem<br />
Well-behaving problem<br />
Figure 3 Illustrati<strong>on</strong> of the adequacy of the ULS-b c<strong>on</strong>trol for a well behaving and bad behaving load<br />
mechanism<br />
In order to ensure that such cases are not slipping through the design unnoticed, the ALS limit<br />
state should be applied to envir<strong>on</strong>mental loads. The limit state formulati<strong>on</strong> is given by Eq. (1),<br />
but usually γf and γm are both set equal to 1.0.<br />
A new structure should not be associated with such a badly behaving process for annual<br />
probability levels larger than 10 -4 . For old structures where the load pattern for some reas<strong>on</strong> is<br />
c<strong>on</strong>siderably changed (worsened wave c<strong>on</strong>diti<strong>on</strong>s, reservoir subsidence, etc), <strong>on</strong>e can very<br />
well foresee that a badly behaved property is realised.<br />
Tether Slack and the Snorre A<br />
The Snorre A was initially designed to avoid slack in the tethers in the ULS c<strong>on</strong>diti<strong>on</strong>. The<br />
governing ULS c<strong>on</strong>diti<strong>on</strong> requires that load factors should be applied to the dynamic tensi<strong>on</strong><br />
amplitudes in the tethers. A result of this design philosophy is that it is implicitly assumed<br />
that the tether system will be damaged if tether slack occurs.<br />
During the installati<strong>on</strong> of the Vigdis module in 1996 this philosophy was aband<strong>on</strong>ed and<br />
replaced with a practical requirement that the tethers should not be slack during the<br />
unfactored 100 year return event (referred to as an SLS c<strong>on</strong>diti<strong>on</strong>). The same SLS limit was<br />
adopted in c<strong>on</strong>necti<strong>on</strong> with the design of the Heidrun TLP which was installed at<br />
Haltenbanken in 1995.<br />
This SLS limit is not a formal requirement, but a practical limit adopted in order to increase<br />
the payload capacity. It is important to note that the factored ULS minimum tensi<strong>on</strong> is still a<br />
required design case, but now against a slack event and not the zero tensi<strong>on</strong> event. As result
of this, it is necessary to analyse tether resp<strong>on</strong>se below zero tensi<strong>on</strong> and show that the<br />
governing slack event does not damage the tether system or other comp<strong>on</strong>ents.<br />
During slack, the dynamics of the event is driven by the fact that at the time where the bottom<br />
tensi<strong>on</strong> is zero, the velocity of the lower part of the tether (and the anchor latch) is zero<br />
whereas the upper part of the tether (and the TLP) has a downwards moti<strong>on</strong>. If the bottom<br />
tether mass is small or the velocities are gentle, the anchor latch will move downwards,<br />
keeping the top tensi<strong>on</strong> equal to the submerged weight of the system. But if the anchor latch<br />
mass is large or the velocities are great, the force required to accelerate the lower part of the<br />
tether assembly downwards may be great enough to cause compressive forces to propagate up<br />
the tether which may yield lift in the top tie-off assembly if the tether body can sustain the<br />
compressi<strong>on</strong>.<br />
For the Snorre A tether system (Figure 4) it is necessary to be very careful when evaluating<br />
the tolerance to tether slack. The system was designed to be tensi<strong>on</strong>ed at all times so the<br />
possibility of slack has not been a c<strong>on</strong>siderati<strong>on</strong> in the original choice of comp<strong>on</strong>ents. To reevaluate<br />
an existing design for a fundamentally different functi<strong>on</strong>ality is always dangerous.<br />
During the present study, a very small slack (approximately 70 mm) has been introduced as<br />
the safe ULS and ALS limit since this is the slack level which may be shown to retain the<br />
basic properties of the system (the flex joints remain pretensi<strong>on</strong>ed, the anchor latch remain in<br />
c<strong>on</strong>tact with the supports et c.).<br />
Figure 4 Overview of Snorre A tether system: top c<strong>on</strong>necti<strong>on</strong> left and bottom c<strong>on</strong>necti<strong>on</strong> right (note that<br />
dimensi<strong>on</strong>s are preliminary)<br />
Increasing the allowable slack bey<strong>on</strong>d this very small level may be possible, but it will be<br />
significantly and progressively more difficult to show that a larger slack is safe and will not<br />
damage the tether system or threaten the TLP integrity. It is, however, important to stress that<br />
slack can occur and that the Snorre A as it stands today has ULS and ALS design checks<br />
where the minimum tether loads incur slack.
Estimati<strong>on</strong> of L<strong>on</strong>g Term Resp<strong>on</strong>se Extrema<br />
It is important to note that according to Norwegian Rules and Regulati<strong>on</strong>s, the target annual<br />
exceedance probability refer to the load effect and not the envir<strong>on</strong>mental c<strong>on</strong>diti<strong>on</strong>. This<br />
implies that in c<strong>on</strong>necti<strong>on</strong> with the ULS and ALS c<strong>on</strong>trol of the tethers, <strong>on</strong>e should obtain<br />
reliable estimates for the tether load corresp<strong>on</strong>ding to an annual exceedance probability of<br />
10 -2 and 10 -4 respectively.<br />
When predicting loads corresp<strong>on</strong>ding to a prescribed annual exceedance probability of q,<br />
some sort of a l<strong>on</strong>g term analysis is required. Denoting the slowly varying meteorological<br />
characteristics (e.g. mean wind speed, significant wave height, spectral peak period, weather<br />
directi<strong>on</strong> and water level) by P and the 3-hour extreme (maximum or minimum) tether load<br />
X3h, the l<strong>on</strong>g term distributi<strong>on</strong> reads:<br />
FX<br />
( x)<br />
= .. F<br />
3h ∫∫ ∫<br />
X<br />
3h<br />
| P<br />
( x|<br />
p)<br />
f<br />
P<br />
( p)<br />
d p<br />
Where f r ( p)<br />
is the l<strong>on</strong>g term joint distributi<strong>on</strong> of the involved metocean characteristics and<br />
P<br />
F<br />
X 3h<br />
| P<br />
( x | p)<br />
is the c<strong>on</strong>diti<strong>on</strong>al distributi<strong>on</strong> functi<strong>on</strong> of the 3-hour extreme value given the<br />
metocean characteristics. The most challenging part of Eq. (2) is the c<strong>on</strong>diti<strong>on</strong>al distributi<strong>on</strong><br />
of X3h which in principle needs to be known for a wide combinati<strong>on</strong> of the involved metocean<br />
and operati<strong>on</strong>al characteristics. For a problem like the tether extreme value problem, a large<br />
number of model tests will be required for a large number of combinati<strong>on</strong>s of the<br />
characteristics. This is not very attractive <strong>from</strong> a practical point of view and realistic<br />
simplificati<strong>on</strong>s are required.<br />
Since extreme c<strong>on</strong>diti<strong>on</strong>s are the present focus and the dynamic tether load due to wave<br />
excitati<strong>on</strong> is dominating, the significant wave height, Hs, and spectral peak period, Tp, are<br />
selected as the primary characteristics. For the other parameters, c<strong>on</strong>servative fixed values<br />
will be adopted. Table 2 shows the overload design cases with which the present paper is<br />
c<strong>on</strong>cerned together with the simplificati<strong>on</strong> of the envir<strong>on</strong>mental variables. Collinear waves,<br />
wind and current are tested in both head and quartering seas and the most <strong>on</strong>erous directi<strong>on</strong> is<br />
taken as governing. These simplificati<strong>on</strong>s which are comm<strong>on</strong>ly employed (see e.g. /1/), are<br />
believed to result in slightly c<strong>on</strong>servative extreme tether loads.<br />
Tether Load Case <str<strong>on</strong>g>Wave</str<strong>on</strong>g>s Wind Current Tide<br />
ULS Minimum 100 year Hs(Tp)<br />
C<strong>on</strong>tour<br />
ULS Maximum 100 year Hs(Tp)<br />
C<strong>on</strong>tour<br />
ALS Minimum 10 000 year Hs(Tp)<br />
C<strong>on</strong>tour<br />
ALS Maximum 10 000 year Hs(Tp)<br />
C<strong>on</strong>tour<br />
100 year With and Without<br />
10 year Current<br />
100 year With and Without<br />
10 year Current<br />
100 year With and Without<br />
10 year Current<br />
100 year With and Without<br />
10 year Current<br />
Table 2 Simplifying the L<strong>on</strong>g Term Distributi<strong>on</strong> of Envir<strong>on</strong>mental Loads<br />
(2)<br />
Lowest Astr<strong>on</strong>omical Tide<br />
(LAT)<br />
Highest Astr<strong>on</strong>omical Tide<br />
(HAT) + 100 year Storm Surge<br />
Mean Sea level<br />
Mean Sea level + 10 000 year<br />
Storm Surge
With these simplificati<strong>on</strong>s, Eq. (2) reduces to a double integral over Hs and Tp. As a<br />
c<strong>on</strong>sequence of this, the c<strong>on</strong>diti<strong>on</strong>al distributi<strong>on</strong> of X3h is needed merely for a number of<br />
combinati<strong>on</strong>s of Hs and Tp given fixed values for the remaining characteristics. However, for<br />
a complex problem like the tether extreme load problem, where additi<strong>on</strong>ally there is some<br />
c<strong>on</strong>cern that rare wave deck impacts may have to be accounted for, a further simplificati<strong>on</strong> is<br />
preferable: the envir<strong>on</strong>mental c<strong>on</strong>tour line approach.<br />
The envir<strong>on</strong>mental c<strong>on</strong>tour line approach aims at predicting reas<strong>on</strong>able estimates for l<strong>on</strong>g<br />
term extrema using short term analysis (it excludes the integrati<strong>on</strong> suggested by Eq. (2)). It<br />
furthermore suggests that a relatively modest number of short term sea states need to be<br />
included. More informati<strong>on</strong> <strong>on</strong> this approach is given in ref. [3] and [6]. At present we will<br />
merely summarize the basic steps of the method.<br />
Using the envir<strong>on</strong>mental c<strong>on</strong>tour line approach, a reas<strong>on</strong>able estimate for the n-year value<br />
(the value corresp<strong>on</strong>ding to an annual exceedance probability of 1/n) can be obtained by the<br />
following steps:<br />
1. Establish the n-year c<strong>on</strong>tour or surface for the involved metocean characteristics, e.g.<br />
significant wave height and spectral peak period.<br />
2. Identify the most unfavourable metocean c<strong>on</strong>diti<strong>on</strong> for the platform resp<strong>on</strong>se al<strong>on</strong>g the nyear<br />
c<strong>on</strong>tour/surface.<br />
3. Establish the distributi<strong>on</strong> functi<strong>on</strong> for the 3-hour extreme resp<strong>on</strong>se for the most<br />
unfavourable metocean c<strong>on</strong>diti<strong>on</strong> al<strong>on</strong>g the c<strong>on</strong>tour line. It is important to ensure that the<br />
behaviour in the tail of this distributi<strong>on</strong> is captured accurately.<br />
4. An estimate for the n-year resp<strong>on</strong>se value is now obtained by the α-quantile of this<br />
extreme value distributi<strong>on</strong>. If, say, two metocean characteristics are included, e.g.<br />
significant wave height and spectral peak period, an adequate value of α will typically be<br />
around 0.90 for the 100 year resp<strong>on</strong>se .<br />
It is to be stressed that this is an approximate method, a full l<strong>on</strong>g term analysis, Eq. (2), is<br />
required if the estimate is to be verified. Experience with the method seems to suggest that it<br />
is relatively robust for most structural problems and that the 90% fractile is reas<strong>on</strong>able both<br />
for 100 year and 10 000 year return periods (in principle the 10 00 year load should have a<br />
slightly larger fractile than the 100 year load).<br />
From Eq. (2) it is seen that two essentially different sources of inherent randomness is<br />
included in a full l<strong>on</strong>g term analysis:<br />
- The variability related to the envir<strong>on</strong>mental c<strong>on</strong>diti<strong>on</strong>s (l<strong>on</strong>g term variability)<br />
- The variability of the 3-hour extreme value of the platform resp<strong>on</strong>se given the<br />
envir<strong>on</strong>ment (short term variability)<br />
The basic idea by the envir<strong>on</strong>mental c<strong>on</strong>tour line approach is that the relative importance of<br />
the two sources is similar for most structural problems with the l<strong>on</strong>g term variability as the<br />
dominating source. Moderate changes in the relative importance can be compensated for by<br />
varying α (see step 4 above) around 0.90.<br />
Envir<strong>on</strong>mental c<strong>on</strong>tour lines for the Snorre field are shown in Figure 5. The seastates al<strong>on</strong>g<br />
the 100 year and 10 000 year c<strong>on</strong>tours which were selected for model testing at Marin, are<br />
also indicated.
10000-1<br />
100-1<br />
10000-2<br />
10000-3 10000-4<br />
100-2<br />
100-3<br />
100-4<br />
Figure 5 C<strong>on</strong>tours of Significant <str<strong>on</strong>g>Wave</str<strong>on</strong>g> Height and Spectral Peak Period for the Snorre Field (From<br />
Ref./4/)<br />
Other envir<strong>on</strong>mental c<strong>on</strong>diti<strong>on</strong>s for the Tampen area are provided in Ref./4/, A brief summary<br />
is included below:<br />
• The 100 year and 10 000 year sea state c<strong>on</strong>tours are shown in Figure 2. The selected<br />
seas are characterized by Torsethaugen wave spectra [7].<br />
• The 100 year reference wind is 40 ms -1 . The Frøya wind spectrum [1] is adopted.<br />
• 10 year surface current is steady at 1.2 ms -1<br />
• The highest and lowest astr<strong>on</strong>omical tide is ±1.0 m and the 100 year (ULS) and 10 000<br />
year (ALS) storm surge levels are, respectively, 0.9 m and 1.1 m.<br />
Hydrodynamic Model Testing<br />
Objective<br />
Due to the complexity of the envir<strong>on</strong>mental excitati<strong>on</strong> <strong>on</strong> the TLP and the resulting tether<br />
resp<strong>on</strong>se, the accurate evaluati<strong>on</strong> of tether loading in harsh envir<strong>on</strong>ments requires model<br />
testing. The main issues which the present model tests can help clarify are:<br />
1. Offset and slowly varying moti<strong>on</strong>s of the TLP in surge sway and yaw. Drift forces<br />
associated with steep waves, current and wind c<strong>on</strong>tribute to this effect and the<br />
resp<strong>on</strong>se of the TLP is affected by tether pretensi<strong>on</strong>, added mass and damping of the<br />
TLP, tethers and risers.<br />
The effect of offset and slowly varying moti<strong>on</strong>s is important for riser design. The<br />
effect <strong>on</strong> the tether tensi<strong>on</strong>, however, is slight and the present study has not focused <strong>on</strong><br />
these effects bey<strong>on</strong>d ensuring that they are relatively accurately modelled in the basin.<br />
This is important because the setdown associated with large offsets may yield indirect
tether loads since large setdown increases the probability of wave impact with the<br />
topside.<br />
2. The direct resp<strong>on</strong>se to waves (wave frequency loading) is important in the period<br />
range between approximately 5 s and 20 s and is resp<strong>on</strong>sible for the bulk of the<br />
loading <strong>on</strong> offshore structures. Structural loading <strong>on</strong> tethers and TLP, airgap and<br />
accelerati<strong>on</strong>s are all c<strong>on</strong>trolled by this resp<strong>on</strong>se type which also give the largest<br />
fatigue damage to all parts of the structure.<br />
Linear analysis models usually represent this load type relatively accurately but have<br />
clear limitati<strong>on</strong>s. In the c<strong>on</strong>text of tether loading, it is notoriously difficult to model<br />
the extreme maximum and minimum wave frequency tether loading accurately since<br />
the extreme positive and negative excursi<strong>on</strong> <strong>from</strong> the mean tensi<strong>on</strong> does not have the<br />
same magnitude. A basic feature of linear theory is that these excursi<strong>on</strong>s are equal<br />
since linear theory has zero skewness.<br />
3. The basic idea of a TLP structure is that the natural periods in heave, roll and pitch<br />
should be kept low enough to avoid direct excitati<strong>on</strong> by the waves, typically 2-3 s.<br />
With a very stiff degree of freedom with a low natural period and very small moti<strong>on</strong>,<br />
damping will also be low so that any excitati<strong>on</strong> may yield a large resp<strong>on</strong>se which<br />
decays slowly. In the c<strong>on</strong>text of extreme tether loading, excitati<strong>on</strong> of the stiff modes<br />
may be though of as impulse loading akin to the ringing of a bell and is associated<br />
either with steep waves interacting with the columns or with waves impacting <strong>on</strong> the<br />
topside 2 .<br />
The modelling of extreme resp<strong>on</strong>se near the natural periods in heave, roll and pitch is<br />
extremely difficult to model numerically since it is c<strong>on</strong>trolled by the shape and<br />
kinematics in the crest regi<strong>on</strong> of very large waves. Model tests are generally accepted<br />
to give a good account of these effects although it sets stringent requirements to the<br />
quality of the envir<strong>on</strong>mental, TLP and tether modelling.<br />
It is also important to be clear <strong>on</strong> the effects which the present model tests cannot help<br />
resolve:<br />
• Modificati<strong>on</strong>s to the topside are not model tested in the wave basin. The impact of<br />
variati<strong>on</strong>s in the mass distributi<strong>on</strong> is handled by static calculati<strong>on</strong>s and the wind<br />
modelling is too coarse to capture such effects. Only parts of the topside which are<br />
subjected to large direct wave loading could c<strong>on</strong>ceivably influence the tether load<br />
significantly by altering the high frequency TLP resp<strong>on</strong>se.<br />
• The present model test does not seek to measure green sea or spray loads <strong>on</strong> exposed<br />
equipment. This can be d<strong>on</strong>e with reas<strong>on</strong>able accuracy, but has not been carried out.<br />
• Risers are modelled in order to give a representati<strong>on</strong> of the effect of the risers <strong>on</strong> TLP<br />
moti<strong>on</strong>. The present model test cannot be employed to study accurately riser dynamics<br />
but is useful in giving the moti<strong>on</strong>s of the TLP as input to a numerical analysis of riser<br />
resp<strong>on</strong>se.<br />
2 In additi<strong>on</strong> to this ringing phenomen<strong>on</strong>, <strong>on</strong>e will also experience a sustained sec<strong>on</strong>d order resp<strong>on</strong>se in this<br />
period band which is comm<strong>on</strong>ly referred to as springing. This resp<strong>on</strong>se process is mainly of c<strong>on</strong>cern for fatigue,<br />
but occasi<strong>on</strong>ally it is difficult to separate between a ringing event and a str<strong>on</strong>g springing episode.
Model Test Philosophy<br />
As discussed above, the distributi<strong>on</strong> of tether loads which is a functi<strong>on</strong> of the l<strong>on</strong>g term<br />
distributi<strong>on</strong> of waves, wind, water level, current and the weigh distributi<strong>on</strong> of the TLP, has<br />
been simplified to the analysis of waves al<strong>on</strong>g the 100 year and 10 000 year c<strong>on</strong>tour curve<br />
(Figure 5) for two directi<strong>on</strong>s of envir<strong>on</strong>ment incidence. W indicates waves, wind and current<br />
propagating towards the living quarter (<strong>from</strong> the West) whereas NW indicates quartering seas<br />
incident <strong>from</strong> North West.<br />
The first step in the model testing programme is therefore to identify the governing seastate<br />
for each of the four resp<strong>on</strong>ses of interest (Table 2) by running typically four three hour<br />
realisati<strong>on</strong>s for each of the seastates and both directi<strong>on</strong>s. This activity indicated that seastate<br />
100-4 and 10000-4 <strong>from</strong> NW were governing for minimum tensi<strong>on</strong> (which give the<br />
possibility of tether slack) in the ULS and ALS c<strong>on</strong>diti<strong>on</strong>s respectively. The minimum tensi<strong>on</strong><br />
occurs in the downwave SE cluster of tethers. Seastate 100-2 and 10000-2 <strong>from</strong> NW give the<br />
governing maximum tensi<strong>on</strong> (which give the possibility of tether overload) in the NW cluster<br />
of tethers.<br />
Although the use of c<strong>on</strong>tour lines simplifies the analysis c<strong>on</strong>siderably, the requirement that<br />
the 90% fractile of the three hour extreme value distributi<strong>on</strong> must be used to estimate the 100<br />
year and 10000 year resp<strong>on</strong>ses implies that a significant number of realisati<strong>on</strong>s of the<br />
governing seastates need to be run. The 90% fractile implies that the design value has a10%<br />
chance of being exceeded in three hours such that the design value can be expected to be<br />
exceeded <strong>on</strong>ce every 10 three hour simulati<strong>on</strong>s. Particularly if the resp<strong>on</strong>se if of a badly<br />
behaving nature, it is clear that a large number of realisati<strong>on</strong>s of the governing seastate needs<br />
to be run in order to obtain a reliable estimate of the design value since the resp<strong>on</strong>se level at<br />
lower probabilities cannot be extrapolated to the design level.<br />
The sec<strong>on</strong>d step in the model testing programme is therefore to c<strong>on</strong>centrate <strong>on</strong> the governing<br />
seastates and run a sufficient number of realisati<strong>on</strong>s to estimate the design value. The number<br />
of realisati<strong>on</strong>s should be decided a priori based <strong>on</strong> the initial screening runs in order to avoid<br />
the bias in the distributi<strong>on</strong> which would be present if the testing was terminated <strong>on</strong> the basis<br />
of observati<strong>on</strong>s.<br />
Executi<strong>on</strong><br />
Model tests were carried out at a scale of 1:62.5 at the facilities of MARIN in Wageningen in<br />
The Netherlands. These facilities offer the opportunity to test accurately a wide variety of<br />
seastates, water depths and wind and current fields.<br />
The TLP hull was manufactured in PVC with stiffeners in the transiti<strong>on</strong> between the columns<br />
and p<strong>on</strong>to<strong>on</strong>s. Tether c<strong>on</strong>duits were modelled as closed vertical pipes underneath the centre of<br />
each column ensuring that the rotati<strong>on</strong> point of the tethers is correctly modelled.<br />
In order to obtain a very stiff hull structure, the top of the columns were c<strong>on</strong>nected using a<br />
steel frame arrangement. The topside was modelled in four separate quadrants supported by 6<br />
degrees of freedom force transducers mounted <strong>on</strong> top of each column. This arrangement<br />
offers the possibility of measuring forces <strong>on</strong> each of the topside quadrants.<br />
In order to capture the resp<strong>on</strong>se due to possible wave impact with deck events, the lower part<br />
of the deck was modelled accurately. A coarser representati<strong>on</strong> of the upper deck structure was<br />
included in order to include a reas<strong>on</strong>able representati<strong>on</strong> of the wind loading <strong>on</strong> the topside.<br />
The wind loading was provided by a bank of wind fans 5m upwave of the model which were<br />
calibrated to give the correct mean wind and gust spectrum.
Only <strong>on</strong>e tether was modelled underneath each column both in the model test and in the<br />
analysis model. Tether tensi<strong>on</strong> reported in the following is therefore the total tensi<strong>on</strong> in the<br />
lumped tethers underneath each corner. Tethers were modelled using steel piping yielding a<br />
rigid system with correct submerged weight and drag. The tethers were hinged at the seabed<br />
and short springs between the top of the tethers and the TLP provided the flexibility in the<br />
tethers. Rigid risers were lumped with ten model scale risers representing 46 full scale risers.<br />
Flexible risers <strong>on</strong> the east side of the TLP are ignored in the model test and in the analysis<br />
work.<br />
The present tether modelling approach should be used with cauti<strong>on</strong> in very deep water since<br />
the tether c<strong>on</strong>tributi<strong>on</strong> to inertia is neglected in the stiff degrees of freedom (heave, roll and<br />
pitch), an effect which may be shown to be insignificant in the present water depth. There is,<br />
however, a need to evaluate how the model test (hinged-rigid-linear spring) tether system<br />
behaves relative to the full scale (flexjoint-flexible-flexjoint) tether system, particularly when<br />
the tether is close to slack.<br />
Collinear waves, wind and current are run in two directi<strong>on</strong>s, incident <strong>from</strong> the W and <strong>from</strong> the<br />
NW. An overview of the number of three hour simulati<strong>on</strong>s run for each directi<strong>on</strong> and seastate<br />
is shown in Table 3. In additi<strong>on</strong> a number of seastates relevant for fatigue were run.<br />
Seastate Envir<strong>on</strong>ment <strong>from</strong> NW Envir<strong>on</strong>ment <strong>from</strong> W<br />
100-1 2 2<br />
100-2 32 10<br />
100-3 14 14<br />
100-4 65 8<br />
10000-1 4 2<br />
10000-2 14 4<br />
10000-3 8 10<br />
10000-4 27 16<br />
Table 3 Number of 3hr realizati<strong>on</strong>s in Model Test<br />
Three hour simulati<strong>on</strong>s of the seastates were run with and without wind and current. The bulk<br />
of the tests, and all results reported in the following, are run with wind but without current.<br />
Current was run merely to verify that the effect <strong>on</strong> tether tensi<strong>on</strong> amplitudes is small for the<br />
Snorre A with its relatively small water depth and current velocity.<br />
Tests were run with three different water levels (and thus pretensi<strong>on</strong> levels) as indicated in<br />
Table 2 since the draft has a significant effect <strong>on</strong> dynamic tether tensi<strong>on</strong> and <strong>on</strong> the<br />
probability of wave impact with the deck.<br />
The model was extensively instrumented during testing:<br />
• Tensi<strong>on</strong> at the top and bottom of the tethers and at the top of the risers<br />
• TLP moti<strong>on</strong> in 6 degrees of freedom<br />
• Topside accelerati<strong>on</strong>s<br />
• Global forces <strong>on</strong> the topside<br />
• Breaking wave induced forces <strong>on</strong> the columns<br />
• Relative surface elevati<strong>on</strong> (airgap) at 16 positi<strong>on</strong>s
• Absolute surface elevati<strong>on</strong> with and without the TLP present in the wave field<br />
In the following, all results <strong>from</strong> the model test are reported with full scale values.<br />
Figure 6 Hydrodynamic Model Figure 7 Hydrodynamic Model, NW Governing Seastate<br />
In order to verify the important properties of the model a number of qualificati<strong>on</strong> tests were<br />
carried out:<br />
• Swing tests in air in order to verify the radii of gyrati<strong>on</strong><br />
• Restoring tests in which the offset and set-down were measured as functi<strong>on</strong>s of the<br />
restoring force<br />
• Decay tests in all degrees of freedom<br />
• Simulati<strong>on</strong>s with static wind al<strong>on</strong>e, dynamic wind al<strong>on</strong>e and current al<strong>on</strong>e where<br />
relevant<br />
• Measurements of hull bending stiffness by measuring static tether resp<strong>on</strong>se to moving<br />
weights <strong>on</strong> the topside<br />
The c<strong>on</strong>clusi<strong>on</strong> <strong>from</strong> the qualificati<strong>on</strong> tests and subsequent comparis<strong>on</strong>s with analysis [5] is<br />
that the mechanical system is modelled accurately and that the discrepancies between the<br />
model test results and traditi<strong>on</strong>al analysis tools may be discussed in terms of the excitati<strong>on</strong> <strong>on</strong><br />
the system.<br />
Model Test Results<br />
The main c<strong>on</strong>clusi<strong>on</strong>s <strong>from</strong> the model test are as follows:<br />
• The governing case for tether slack is the 100 year SLS criteri<strong>on</strong>. This occurs in the<br />
SE tether with weather <strong>from</strong> the NW and the largest Hs 100 year seastate (100-4). This<br />
c<strong>on</strong>diti<strong>on</strong> is c<strong>on</strong>trolled by wave frequency effects, high frequency tether tensi<strong>on</strong> is not<br />
important.<br />
• The governing case for tether yield is the intact 100 year ULS-b maximum load case.<br />
This occurs in the NW tether with weather <strong>from</strong> the NW and a very steep 100 year<br />
seastate (100-2). For this c<strong>on</strong>diti<strong>on</strong>, the high frequency c<strong>on</strong>tributi<strong>on</strong> is important since<br />
it is correlated with the wave frequency c<strong>on</strong>tributi<strong>on</strong>.
• The elevati<strong>on</strong> of the deck <strong>on</strong> the Snorre A is sufficient to avoid large horiz<strong>on</strong>tal wave<br />
impact with the topside. It appears, however, that vertical wave impact with the<br />
topside and (more importantly) str<strong>on</strong>gly n<strong>on</strong>linear wave interacti<strong>on</strong> with the columns<br />
c<strong>on</strong>tribute to tether tensi<strong>on</strong> for the largest 10 000 year events. Nevertheless, the 10 000<br />
year seastates do not incur the governing tether loading.<br />
• The relatively low current velocities in the Tampen area are not important in the<br />
evaluati<strong>on</strong> of tether tensi<strong>on</strong>.<br />
C<strong>on</strong>sider a critical seastate where several three hour realisati<strong>on</strong>s have been run. From each of<br />
the three hour simulati<strong>on</strong>s, the most critical value (in this case the largest positive and<br />
negative excursi<strong>on</strong>s <strong>from</strong> the mean tether tensi<strong>on</strong>) may be extracted. The critical values <strong>from</strong><br />
each three hour simulati<strong>on</strong> are then ordered after severity and assigned a probability, F, of n<strong>on</strong><br />
exceedance. F=0.9 thus corresp<strong>on</strong>ds to a value which have 10 % probability of exceedence in<br />
three hours.<br />
If the measured value is plotted <strong>on</strong> the x-axis and –ln(-ln(F)) is plotted <strong>on</strong> the y-axis (a<br />
Gumbel plot), a curve may be drawn and a design value may be found. The target value F=0.9<br />
has the value –ln(-ln(0.9))=2.25 in a Gumbel plot. This approach is shown in Figure 8 and<br />
Figure 9 for the governing minimum and maximum tether forces. Both the 100 year and<br />
10 000 year seastates are shown.<br />
The Maximum Likelihood estimates of the Gumbel parameters are shown together with the<br />
experimental data. The Gumbel assumpti<strong>on</strong> can handle str<strong>on</strong>gly n<strong>on</strong>linear load mechanisms,<br />
but not a badly behaved load mechanism which features a disc<strong>on</strong>tinuity in the loading<br />
functi<strong>on</strong>.<br />
-ln(-ln(F))<br />
3.0<br />
2.5<br />
2.0<br />
1.5<br />
1.0<br />
0.5<br />
0.0<br />
-0.5<br />
40357<br />
41845<br />
-1.0<br />
30000 35000 40000 45000 50000 55000<br />
Resp<strong>on</strong>se Level [kN]<br />
51332<br />
ULS Base Case - Seastate 100-4<br />
ULS Increased VCG - Seastate 100-4<br />
ALS Base Case - Seastate 10000-4<br />
Maximum Likelihood<br />
Target<br />
Figure 8 Measured Minimum deviati<strong>on</strong>s <strong>from</strong> mean tensi<strong>on</strong> in SE corner with all weather form NW
-ln(-ln(F))<br />
3.0<br />
2.5<br />
2.0<br />
1.5<br />
1.0<br />
0.5<br />
0.0<br />
-0.5<br />
31773<br />
33386<br />
-1.0<br />
25000 30000 35000 40000 45000 50000<br />
Resp<strong>on</strong>se Level [kN]<br />
41237<br />
ULS Increased VCG - Seastate 100-2<br />
ULS Base Case - Seastate 100-2<br />
ALS Base Case - Seastate 10000-2<br />
Maximum Likelihood<br />
Target<br />
Figure 9 Measured Maximum deviati<strong>on</strong>s <strong>from</strong> mean tensi<strong>on</strong> in NW corner with all weather <strong>from</strong> NW<br />
It is seen both <strong>from</strong> the relative smoothness and <strong>from</strong> the gradient of the curves in Figure 8<br />
that the minimum tensi<strong>on</strong> amplitudes are well behaved. High frequency resp<strong>on</strong>se, although<br />
not small, does not c<strong>on</strong>tribute to the extreme events since it is not in phase with the governing<br />
wave frequency minimum tensi<strong>on</strong> (it sets in after the minimum tensi<strong>on</strong> occurs). For the<br />
largest 10 000 year events, however, there is a tendency for the high frequency loading to<br />
challenge the wave frequency minimum.<br />
The time series of the extreme negative 100 year and 10 000 year minimum tensi<strong>on</strong> events are<br />
shown in Figure 10 and illustrate this point. The 100 year event occurs together with a large<br />
wave trough in SE and the minimum tensi<strong>on</strong> is realised before the wave impacts with the<br />
columns and sets up significant high frequency resp<strong>on</strong>se. For the 10 000 year event, the same<br />
mechanism is evident, but the high frequency resp<strong>on</strong>se is large enough to yield the minimum<br />
tensi<strong>on</strong>. This may indicate that the larger scatter in Figure 8 which appears to be present for<br />
the largest 10 000 year measurements is not merely statistical variati<strong>on</strong>.<br />
The maximum tensi<strong>on</strong> amplitudes in Figure 9 are not as well behaved as the minimum tensi<strong>on</strong><br />
level. The gradient for the 10000 year curve differs significantly <strong>from</strong> the gradient of the 100<br />
year curve indicating a significantly more n<strong>on</strong>linear system. In additi<strong>on</strong>, the largest value<br />
measured is very large although it is difficult to c<strong>on</strong>clude that a badly behaved property is<br />
realised based <strong>on</strong> a single measurement.<br />
The time series of the largest 100 year and 10 000 year maximum tensi<strong>on</strong> events are shown in<br />
Figure 11. High frequency tether resp<strong>on</strong>se is an important c<strong>on</strong>tributi<strong>on</strong> to the total tensi<strong>on</strong><br />
level in both 100 year and 10 000 year seastates but since the high frequency resp<strong>on</strong>se is<br />
str<strong>on</strong>gly n<strong>on</strong>linear it becomes progressively more dominant at lower probability levels. The<br />
high frequency tether loading stems primarily <strong>from</strong> the interacti<strong>on</strong> of steep waves with the<br />
column (ringing) and to a lesser degree vertical wave impact with the deck in the area around<br />
the columns.
Tether Tensi<strong>on</strong> in SE (less mean) [kN]<br />
60000<br />
40000<br />
20000<br />
0<br />
-20000<br />
-40000<br />
-60000<br />
1100 1120 1140 1160 1180 1200<br />
Time [s]<br />
Tether Tensi<strong>on</strong> in SE (less mean) [kN]<br />
60000<br />
40000<br />
20000<br />
0<br />
-20000<br />
-40000<br />
-60000<br />
1080 1100 1120 1140 1160 1180<br />
Time [s]<br />
Figure 10 Governing 100 year (left) and 10 000 year (right) negative tensi<strong>on</strong> excursi<strong>on</strong>s in SE tether<br />
Tether Tensi<strong>on</strong> in NW (less mean) [kN]<br />
60000<br />
40000<br />
20000<br />
0<br />
-20000<br />
-40000<br />
-60000<br />
3820 3840 3860 3880 3900 3920<br />
Time [s]<br />
60000<br />
40000<br />
20000<br />
0<br />
-20000<br />
-40000<br />
-60000<br />
5680 5700 5720 5740 5760 5780<br />
Figure 11 Governing 100 year (left) and 10 000 year (right) positive tensi<strong>on</strong> excursi<strong>on</strong>s in NW tether<br />
Tether Tensi<strong>on</strong> in NW (less mean) [kN]<br />
Time [s]
Based <strong>on</strong> the initial screening measurements and measurements <strong>from</strong> the (not governing) W<br />
weather case it appears that a kink in the distributi<strong>on</strong> does indeed set inn for maximum tether<br />
amplitudes close to the 90% fractile in the 10000 year c<strong>on</strong>diti<strong>on</strong>, but that it sets in too late to<br />
be governing over the 100 year c<strong>on</strong>diti<strong>on</strong>.<br />
The extensive model testing programme has provided a data base of results with which to<br />
compare analysis models and study physical effects which is nearly inexhaustible. One<br />
example is shown in Figure 12 c<strong>on</strong>cerning a quick investigati<strong>on</strong> of an extreme 10 000 year<br />
tensi<strong>on</strong> event with weather <strong>from</strong> the W, carried out during model testing due to a c<strong>on</strong>cern that<br />
a horiz<strong>on</strong>tal deck impact event had occurred. The time series plots included are the tether<br />
tensi<strong>on</strong> in the upwave and downwave tethers, the relative wave elevati<strong>on</strong>, the TLP pitch<br />
moti<strong>on</strong> and the output <strong>from</strong> the vertical deck loading force transducer in the NW quadrant of<br />
the topside.<br />
• There appears to be a very large impact or ringing event which gives very large<br />
tensi<strong>on</strong> in the W tethers at 12025 s followed by a very small tensi<strong>on</strong> level in the E<br />
tether at 12027 s. A significant and slowly decaying high frequency resp<strong>on</strong>se is set up<br />
as a result of this.<br />
• There is a large pitch event which is initiated at 12024 s towards negative pitch<br />
(nodding towards the E). This is c<strong>on</strong>sistent with a horiz<strong>on</strong>tal deck impact event.<br />
• There were no significant horiz<strong>on</strong>tal topside loads recorded. At 12025 s, however,<br />
there is a vertical impact recorded underneath the NW topside (note that inertia is not<br />
filtered out of the force transducer signal) indicating a vertical deck impact <strong>from</strong><br />
underneath the deck. The magnitude of this loading is small, however, and not<br />
sufficient to set up the global tether resp<strong>on</strong>se.<br />
• Airgap probe 16, 15 and 5 are respectively 50 m W of the W p<strong>on</strong>to<strong>on</strong> centre, 3 m W<br />
of the NW column and centrally above the W p<strong>on</strong>to<strong>on</strong>. A horiz<strong>on</strong>tal impact event<br />
would occur when the extreme crest was between probe 16 and probe 15 at<br />
approximately 12022 s which is earlier that the observed impact event. With a still<br />
water airgap of 24.4 m, it appears <strong>from</strong> the probe 5 time trace that the available airgap<br />
is exceeded such that there is indeed a vertical deck loading.<br />
For this case, it is c<strong>on</strong>cluded that a marginal exceedence of airgap occurs underneath the deck<br />
but that this does not set up the very large high frequency resp<strong>on</strong>se. The high frequency<br />
resp<strong>on</strong>se in the example in Figure 12 appears rather to be set up by the wave impact with the<br />
E columns as a ringing event.
Figure 12 Measurements of <str<strong>on</strong>g>Extreme</str<strong>on</strong>g> Event (Seastate 10 000-4 <strong>from</strong> W)
Applicati<strong>on</strong> of CFD to the Analysis of Badly Behaved<br />
Problems<br />
Introducti<strong>on</strong><br />
For linear or weakly n<strong>on</strong>linear problems, 3D linear diffracti<strong>on</strong> theory (including sec<strong>on</strong>d order<br />
effects) provides valuable insight into the behaviour of floating offshore structures. This was<br />
even the case for the high waves in which the Snorre As was tested, as was shown in [5].<br />
However, this type of method cannot be expected to capture the badly behaving problem type<br />
discussed previously which features a disc<strong>on</strong>tinuity in the loading functi<strong>on</strong>. An example of<br />
such a problem is the situati<strong>on</strong> where the deck of a TLP is str<strong>on</strong>gly hit by a wave crest.<br />
Although the Snorre A is found to be well balanced with respect to ULS and ALS load types,<br />
it is important to develop simulati<strong>on</strong> methods that are able to capture the badly behaved<br />
problem type. As part of the development of such a method, the behaviour of the Snorre A<br />
was simulated using the improved Volume Of Fluid (iVOF) method.<br />
Methodology<br />
The improved Volume Of Fluid (iVOF) method is developed in co-operati<strong>on</strong> between the<br />
University of Gr<strong>on</strong>ingen (RuG) and MARIN. It enables the computati<strong>on</strong> of the complex, n<strong>on</strong>linear<br />
free surface flow around arbitrary geometries. The fluid domain is subdivided into<br />
rectangular grid-cells which are labelled as fluid cells (open to flow) or empty cells (closed to<br />
flow) due to the presence of a solid. By means of c<strong>on</strong>servati<strong>on</strong> of impulse, c<strong>on</strong>servati<strong>on</strong> of<br />
mass and the free-surface boundary c<strong>on</strong>diti<strong>on</strong>s, the flux through the cell boundaries and the<br />
pressure in the cell centres are computed. Recently, the method has been further extended to<br />
enable the computati<strong>on</strong> of floater moti<strong>on</strong> resp<strong>on</strong>se, including the full n<strong>on</strong>-linear interacti<strong>on</strong><br />
with the surrounding flow. Arbitrary external forces can be added to the equati<strong>on</strong> of moti<strong>on</strong>,<br />
enabling the modelling of the tether forces. More details <strong>on</strong> the iVOF method and some recent<br />
applicati<strong>on</strong>s can be found in for example [8] and [9].<br />
At present, it is not possible to do l<strong>on</strong>g simulati<strong>on</strong>s of irregular waves due to the large<br />
computati<strong>on</strong>al times. The simulati<strong>on</strong>s have therefore been carried out in regular waves in<br />
order to investigate at least qualitatively the effect of wave impact with the topside. In order<br />
to show the principle of the badly behaved load mechanism, simulati<strong>on</strong>s were carried out with<br />
2 different wave heights:<br />
1. <str<strong>on</strong>g>Wave</str<strong>on</strong>g> height of 29.7 m, wave period 13.0 sec<strong>on</strong>ds (Ak approx. 0.35).<br />
2. <str<strong>on</strong>g>Wave</str<strong>on</strong>g> height of 36.4 m, wave period 13.0 sec<strong>on</strong>ds.(Ak approx. 0.43)<br />
The tethers have been modelled as mass-less stiff axial springs. This assumpti<strong>on</strong> is made<br />
because the tether mass is small compared to the TLP mass (about 5.5 percent). Like in the<br />
model tests, the 4 tethers at 1 column have been lumped into 1 single tether. The analysis has<br />
been run with waves incident <strong>from</strong> the west (directly <strong>on</strong> the living quarter).<br />
The modelled geometry of the Snorre A is shown in Figure 13. The cell size near the TLP is<br />
2x2x2 m:
Figure 13 Snorre A Model<br />
The simulati<strong>on</strong>s are initiated with the water at rest. The first wave period is used to start-up<br />
the wave orbital velocities at the inflow boundary upstream of the TLP. Stokes 5 th order wave<br />
theory is used. At the downstream side of the TLP the domain is extended for about 1500<br />
meters to avoid wave reflecti<strong>on</strong>s <strong>from</strong> that directi<strong>on</strong> to occur within the simulated period,<br />
using so-called stretched cells which exp<strong>on</strong>entially expand in size in downstream directi<strong>on</strong>. A<br />
3D view of the domain is shown in Figure 14.<br />
Figure 14 Double Computati<strong>on</strong>al Domain<br />
In the simulati<strong>on</strong>s, a symmetry c<strong>on</strong>diti<strong>on</strong> was used and the computati<strong>on</strong> thus included <strong>on</strong>ly<br />
half the domain indicated. A total of 718,160 grid cells were used in the simulati<strong>on</strong>s.<br />
Results<br />
A total of almost 3 wave periods was simulated (36 sec<strong>on</strong>ds). The computati<strong>on</strong>al time <strong>on</strong> a<br />
modern PC was about 1 week. Prior to the 3D simulati<strong>on</strong>, a 2D simulati<strong>on</strong> without the TLP<br />
was carried out to check the quality of the computed undisturbed wave (similar to what is
d<strong>on</strong>e in the model basin). The wave elevati<strong>on</strong> at the centre of the TLP (H=29.7 m left, H=36.4<br />
m right) is shown below. The n<strong>on</strong>-linearity in the waves (steep crest, flattened through) can<br />
clearly be observed.<br />
wave elevati<strong>on</strong> [m]<br />
25<br />
20<br />
15<br />
10<br />
5<br />
0<br />
-5<br />
-10<br />
-15<br />
0 10 20 30<br />
time [s]<br />
40 50<br />
Figure 15 Incident Regular <str<strong>on</strong>g>Wave</str<strong>on</strong>g>s<br />
The following signals are output <strong>from</strong> the simulati<strong>on</strong>:<br />
- TLP moti<strong>on</strong>s in 6 degrees of freedom<br />
- Tether forces<br />
- Hydrodynamic forces <strong>on</strong> the TLP<br />
wave elevati<strong>on</strong> [m]<br />
25<br />
20<br />
15<br />
10<br />
5<br />
0<br />
-5<br />
-10<br />
-15<br />
0 10 20 30<br />
time [s]<br />
40 50<br />
Several snapshots <strong>from</strong> the simulati<strong>on</strong>s <strong>from</strong> T=25 s through T=31 s (smallest wave height is<br />
shown <strong>on</strong> the left and the highest wave height <strong>on</strong> the right) are shown in Figure 16:
Figure 16 Snapshots during iVOF Simulati<strong>on</strong> (largest wave right)<br />
It can be seen that in the case of the lowest wave, the wave crest just misses the deck. The<br />
higher wave however causes significant vertical deck impacts. This is illustrated below where<br />
the following signals are shown:<br />
- The top tensi<strong>on</strong> in the forward tethers<br />
- The top tensi<strong>on</strong> in the aft tethers<br />
top tensi<strong>on</strong> forward tether [kN]<br />
x 104<br />
14<br />
12<br />
10<br />
8<br />
6<br />
4<br />
2<br />
H=29.7 m<br />
H=36.4 m<br />
0<br />
0 10 20<br />
time [s]<br />
30<br />
Figure 17 Tether Tensi<strong>on</strong> Timeseries<br />
top tensi<strong>on</strong> aft tether [kN]<br />
x 104<br />
14<br />
12<br />
10<br />
8<br />
6<br />
4<br />
2<br />
0<br />
0 10 20<br />
time [s]<br />
30<br />
H=29.7 m<br />
H=36.4 m<br />
The tether loads clearly show the familiar, combined res<strong>on</strong>ant and wave frequency resp<strong>on</strong>se.<br />
The high-frequency, res<strong>on</strong>ant variati<strong>on</strong>s in the tether loads are significantly larger in case of<br />
the highest wave. Furthermore, the maximum tether load is highest <strong>on</strong> the forward tether, but<br />
the aft tether becomes slack after the wave crest has passed the aft columns (T=30 s). This<br />
clearly shows the ‘badly behaved load mechanism’: A wave just missing the deck induces<br />
relatively moderate dynamic tether forces whereas a slightly higher wave that hits the deck<br />
can cause slack tethers and subsequent serious damage to the platform. Traditi<strong>on</strong>al methods<br />
(linear or sec<strong>on</strong>d order diffracti<strong>on</strong> theory) are not capable of predicting such effects.
Finally, the surge, heave and pitch moti<strong>on</strong> of the TLP are shown in Figure 18:<br />
surge moti<strong>on</strong> TLP [m]<br />
15<br />
10<br />
5<br />
0<br />
H=29.7 m<br />
H=36.4 m<br />
-5<br />
0 10 20<br />
time [s]<br />
30<br />
Figure 18 TLP Moti<strong>on</strong> Timeseries<br />
These show that:<br />
heave moti<strong>on</strong> TLP [m]<br />
0.1<br />
0<br />
-0.1<br />
-0.2<br />
-0.3<br />
-0.4<br />
H=29.7 m<br />
H=36.4 m<br />
-0.5<br />
0 10 20<br />
time [s]<br />
30<br />
pitch TLP [deg]<br />
0.3<br />
0.25<br />
0.2<br />
0.15<br />
0.1<br />
0.05<br />
0<br />
-0.05<br />
-0.1<br />
H=29.7 m<br />
H=36.4 m<br />
0 10 20<br />
time [s]<br />
30<br />
1. Due to the mean wave drift force, the TLP is pushed backwards also causing a mean,<br />
n<strong>on</strong>-zero setdown.<br />
2. Heave and pitch moti<strong>on</strong>s are small and follow the tether tensi<strong>on</strong> behaviour with the<br />
typical combined wave-frequency and res<strong>on</strong>ant TLP resp<strong>on</strong>se.<br />
Due to the fact that the TLP has not reached its mean, wave drift force induced surge offset<br />
(and setdown) yet, it is most likely that subsequent wave crests lead to higher tether loads due<br />
to a further reduced airgap. However, this appears to be an effect which is particular for<br />
regular waves since extreme waves in nature will occur as single events which are very much<br />
larger than waves in the vicinity and this effect was not investigated further.<br />
Discussi<strong>on</strong><br />
Resp<strong>on</strong>se Return Periods and Badly Behaved Problems<br />
It has been the aim of the present paper to illustrate that the badly behaved problem type is a<br />
real issue which should be accounted for in design. It has further been the aim to illustrate the<br />
inadequacy of basing the design <strong>on</strong> <strong>on</strong>e or a small number of three hour realisati<strong>on</strong>s of the<br />
governing seastate.<br />
The expected maximum or minimum value obtained <strong>from</strong> a single three hour simulati<strong>on</strong> is<br />
significantly lower than the required design value which may yield return periods of the<br />
design value of 10 years or less. If the resp<strong>on</strong>se is well behaved, an extrapolati<strong>on</strong> of the<br />
maxima observed to a lower probability level and the use of load factors may still ensure a<br />
relatively robust design.<br />
But if the resp<strong>on</strong>se is of the badly behaved type, due to wave impact with the topside or other<br />
str<strong>on</strong>gly n<strong>on</strong>linear effects, the design load cannot be extrapolated <strong>from</strong> a small number of<br />
simulati<strong>on</strong>s since the loading functi<strong>on</strong> is disc<strong>on</strong>tinuous. It is therefore necessary both to run a<br />
sufficient number of realisati<strong>on</strong>s such that the likelihood of observing the design value is<br />
acceptable, and also to run a sec<strong>on</strong>d ALS check <strong>on</strong> the envir<strong>on</strong>mental c<strong>on</strong>diti<strong>on</strong>s to<br />
investigate the behaviour at a very low probability level.<br />
The Snorre A<br />
Based <strong>on</strong> a c<strong>on</strong>cern about the integrity of the Snorre A tethers and the possibility of a badly<br />
behaved resp<strong>on</strong>se process, a large model testing programme was set up in order to investigate<br />
this. It is c<strong>on</strong>cluded that there may indeed be a disc<strong>on</strong>tinuity or a str<strong>on</strong>gly n<strong>on</strong>linear
comp<strong>on</strong>ent in the loading functi<strong>on</strong> of the tethers but that this sets in at sufficiently low<br />
probabilities such that it is not governing for the tether integrity.<br />
The Snorre A tethers are in fact well balanced with respect to the ULS and ALS loading as is<br />
illustrated in Figure 19. Figure 19 shows the utilisati<strong>on</strong> of the tethers above (yield) and below<br />
(slack) the pretensi<strong>on</strong> level for the different design cases. A utilisati<strong>on</strong> of 1.0 corresp<strong>on</strong>ds to a<br />
c<strong>on</strong>servative maximum tether tensi<strong>on</strong> level for the ULS and ALS cases (they differ by a factor<br />
of 1.15), zero bottom tensi<strong>on</strong> for the SLS c<strong>on</strong>diti<strong>on</strong> and the tensi<strong>on</strong> corresp<strong>on</strong>ding to the small<br />
allowable slack level discussed previously for the minimum ULS and ALS cases. It is seen<br />
that the ULS and SLS cases are governing for maximum and minimum tensi<strong>on</strong> respectively.<br />
The difference between these governing cases and unity is the margin which may be used for<br />
the operati<strong>on</strong> of the platform.<br />
Fracti<strong>on</strong> of Allowable Utilisati<strong>on</strong> above or below<br />
Pretensi<strong>on</strong> Level<br />
1.0<br />
0.9<br />
0.8<br />
0.7<br />
0.6<br />
0.5<br />
0.4<br />
0.3<br />
0.2<br />
0.1<br />
0.0<br />
Intact Maximum<br />
ULS C<strong>on</strong>diti<strong>on</strong><br />
Intact Maximum<br />
ALS C<strong>on</strong>diti<strong>on</strong><br />
Comp. Flooded<br />
Maximum ALS<br />
C<strong>on</strong>diti<strong>on</strong><br />
Intact Minimum<br />
ULS C<strong>on</strong>diti<strong>on</strong><br />
Design Case<br />
Figure 19 Tether Utilisati<strong>on</strong> for the Different Design Cases<br />
Intact Minimum<br />
ALS C<strong>on</strong>diti<strong>on</strong><br />
Comp. Flooded<br />
Minimum ALS<br />
C<strong>on</strong>diti<strong>on</strong><br />
Misc. Loads Static Envir<strong>on</strong>mental Load Dynamic Envir<strong>on</strong>mental Load<br />
Intact SLS<br />
C<strong>on</strong>diti<strong>on</strong> (no<br />
slack)<br />
A remaining c<strong>on</strong>cern with the Snorre A tether integrity is the possibility that the method of<br />
modelling the tethers in the model test is not representative of the full scale system close to<br />
slack. Hinging the tethers about the seabed and representing the tether stiffness by a spring<br />
between the top of the rigid tethers and the TLP hull may have unintended effects for very<br />
low tensi<strong>on</strong> levels. This effect is currently being investigated.<br />
Computati<strong>on</strong>al Fluid Dynamics<br />
Stable and accurate numerical simulati<strong>on</strong>s of complex fluid moti<strong>on</strong> problems using the iVOF<br />
solver remain a significant challenge (Ref. [8] & [9]). Nevertheless, as has been shown above,<br />
the accurate analysis of str<strong>on</strong>gly n<strong>on</strong>linear wave interacti<strong>on</strong> with structures is becoming a<br />
reality for short, well defined incident wave trains.<br />
In the present paper, however, it has been stressed that very l<strong>on</strong>g simulati<strong>on</strong>s of representative<br />
seastates are necessary in order to identify the design load level. The load level needs to be<br />
associated with a probability of occurrence in order to be meaningful in a design c<strong>on</strong>text. The
simulati<strong>on</strong> of irregular seastates over several hours using iVOF or alternative CFD methods is<br />
still below the horiz<strong>on</strong>.<br />
The main challenge before these methods may be used to determine or verify the design load<br />
and resp<strong>on</strong>se levels is therefore to develop methods which identify short and well defined<br />
wave trains which may be used as design waves and tie the resulting resp<strong>on</strong>se to the overall<br />
probability level. This is a formidable challenge:<br />
• Regular waves may be used which are representative of the irregular governing<br />
waves. It is very difficult to verify that a regular wave is representative of an<br />
irregular wave and to c<strong>on</strong>struct a probability distributi<strong>on</strong> based <strong>on</strong> representative<br />
regular waves.<br />
• Short wave packets which c<strong>on</strong>tain the wave groups which are assumed to be<br />
governing may be extracted <strong>from</strong> model tests or separate numerical simulati<strong>on</strong>s and<br />
run through the iVOF solver. This may be a promising method coupled with a peak<br />
over threshold statistical approach.<br />
• Transient wave groups (see e.g. /10/) which are representative of extreme waves in a<br />
seastate may be run through the iVOF solver. For a complex resp<strong>on</strong>se system, the<br />
rec<strong>on</strong>structi<strong>on</strong> of the statistics of the resp<strong>on</strong>se may be difficult.<br />
Acknowledgements<br />
The authors are grateful to Statoil ASA <strong>on</strong> behalf of the Snorre A partners for allowing the<br />
publicati<strong>on</strong> of the Snorre A data.<br />
References<br />
1. NORSOK Standard N-003, ‘Acti<strong>on</strong> and Acti<strong>on</strong> <str<strong>on</strong>g>Effects</str<strong>on</strong>g>’, Rev.1, February1999<br />
2. Petroleum Safety Authority Norway: “Regulati<strong>on</strong>s relating to design and outfitting of<br />
facilities etc in the petroleum activities (The Facilities regulati<strong>on</strong>s), Oslo/Stavanger,<br />
September 2001.<br />
3. Haver, S.: “Applicati<strong>on</strong> of envir<strong>on</strong>mental c<strong>on</strong>tour lines for estimating l<strong>on</strong>g term<br />
resp<strong>on</strong>se extremes”, Internati<strong>on</strong>al C<strong>on</strong>ference <strong>on</strong> Computati<strong>on</strong>al Methods in Marine<br />
Engineering MARINE 2005, Eds. Bergan, P., Garcia, J, Onate, E. and Kvamsdal, T,<br />
Oslo, June 2005.<br />
4. Eik, K.J. and Nygaard, E.: “Snorre Metocean Design Basis”, Statoil report, PTT-<br />
NKG-RA 64-3, Stavanger, 08.03.2005.<br />
5. Johannessen, T.B. & Sandvik, A.K.,(2005),’Analysis of extreme TLP tether tensi<strong>on</strong><br />
amplitudes with comparis<strong>on</strong> to model tests’, Proc. OMAE 2005, Halkidiki, Greece.<br />
6. Winterstein,S.R., Ude, T.C., Cornell, C.A., Bjerager, P. and Haver, S.: "Envir<strong>on</strong>mental<br />
Parameters for <str<strong>on</strong>g>Extreme</str<strong>on</strong>g> Resp<strong>on</strong>se: Inverse FORM with Omissi<strong>on</strong> Factors", ICOSSAR-<br />
93, Innsbruck, August 1993.<br />
7. Torsethaugen, K., 1996: “Model for a Doubly-peaked Spectrum”, SINTEF,<br />
STF22A96204, SINTEF, Tr<strong>on</strong>dheim<br />
8. Kleefsman, T., Loots, E., Veldman, A., Buchner, B., Bunnik, T. and Falkenberg, E.;<br />
“The Numerical Simulati<strong>on</strong> of Green <strong>Water</strong> Loading Including the Vessel Moti<strong>on</strong>s<br />
and the Incoming <str<strong>on</strong>g>Wave</str<strong>on</strong>g> Field”, OMAE C<strong>on</strong>ference, Halkidiki, 2005.<br />
9. Bunnik, T., Buchner, B., Veldman, A.; “The Use of a Volume of Fluid (VoF) Method<br />
Coupled to a Time Domain Moti<strong>on</strong> Simulati<strong>on</strong> to Calculate the Moti<strong>on</strong>s of a Subsea<br />
Structure Lifted Through the Splash Z<strong>on</strong>e”, OMAE C<strong>on</strong>ference, Hamburg, 2006.
10. Taylor, P. H., J<strong>on</strong>athan, P. & Harland, L. A., (1995), ‘Time domain simulati<strong>on</strong> of jack-up<br />
dynamics with the extremes of a Gaussian process’, Proc. 14th OMAE C<strong>on</strong>ference,<br />
Copenhagen, June 1995