MSDaPl - Molecular & Cellular Proteomics
MSDaPl - Molecular & Cellular Proteomics
MSDaPl - Molecular & Cellular Proteomics

Create successful ePaper yourself
Turn your PDF publications into a flip-book with our unique Google optimized e-Paper software.
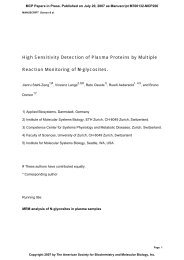
Figure 4: Screenshots from the <strong>MSDaPl</strong> web application interface. (a) A view of the experiment<br />
comparison interface where three experiments are being compared. Each experiment is assigned<br />
a color, which is used consistently throughout the page. The top table and Venn diagram indicate<br />
the degree of overlap between the three experiments. The bottom table shows the results for a<br />
single protein with the optional view of the peptides used to identify the protein and their<br />
presence (including abundance) or absence in each of the experiments. (b) A view of the quality<br />
control interface in <strong>MSDaPl</strong>. The top graph indicates the total number of PSMs and the<br />
proportion of quality PSMs to total PSMs found as a function of retention time, and the bottom<br />
graph indicates the total number of scans and the proportion of scans with quality matches to<br />
total scans as a function of retention time.<br />
22