G Aerial dispersal and drying of Peronospora tabacina conidia in ...
G Aerial dispersal and drying of Peronospora tabacina conidia in ...
G Aerial dispersal and drying of Peronospora tabacina conidia in ...
You also want an ePaper? Increase the reach of your titles
YUMPU automatically turns print PDFs into web optimized ePapers that Google loves.
700 Applied Physical Sciences: Aylor <strong>and</strong> Taylor<br />
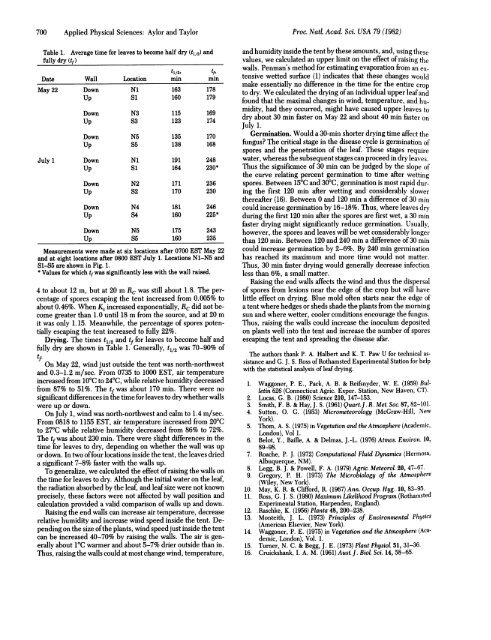
Table 1. Average time for leaves to become half dry (t12) <strong>and</strong><br />
fully dry (tf)<br />
Date Wall Location<br />
t1/2P<br />
m<strong>in</strong><br />
tf,<br />
m<strong>in</strong><br />
May 22 Down<br />
Up<br />
N1<br />
Si<br />
163<br />
160<br />
178<br />
179<br />
Down N3 115 169<br />
Up S3 123 174<br />
Down N5 135 170<br />
Up S5 138 168<br />
July 1 Down N1 191 248<br />
Up Si 164 230*<br />
Down N2 171 236<br />
Up S2 170 230<br />
Down N4 181 246<br />
Up S4 160 225*<br />
Down N5 175 243<br />
Up S5 160 235<br />
Measurements were made at six locations after 0700 EST May 22<br />
<strong>and</strong> at eight locations after 0800 EST July 1. Locations N1-N5 <strong>and</strong><br />
S1-S5 are shown <strong>in</strong> Fig. 1.<br />
* Values for which tf was significantly less with the wall raised.<br />
4 to about 12 m, but at 20 m Rc was still about 1.8. The percentage<br />
<strong>of</strong> spores escap<strong>in</strong>g the tent <strong>in</strong>creased from 0.005% to<br />
about 0.46%. When Kz <strong>in</strong>creased exponentially, RC did not become<br />
greater than 1.0 until 18 m from the source, <strong>and</strong> at 20 m<br />
it was only 1.15. Meanwhile, the percentage <strong>of</strong> spores potentially<br />
escap<strong>in</strong>g the tent <strong>in</strong>creased to fully 22%.<br />
Dry<strong>in</strong>g. The times t1/2 <strong>and</strong> tf for leaves to become half <strong>and</strong><br />
fully dry are shown <strong>in</strong> Table 1. Generally, t1/2 was 70-90% <strong>of</strong><br />
On May 22, w<strong>in</strong>d just outside the tent was north-northwest<br />
<strong>and</strong> 0.3-1.2 m/sec. From 0735 to 1000 EST, air temperature<br />
<strong>in</strong>creased from 10'C to 24TC, while relative humidity decreased<br />
from 87% to 51%. The tf was about 170 m<strong>in</strong>. There were no<br />
significant differences <strong>in</strong> the time for leaves to dry whether walls<br />
were up or down.<br />
On July 1, w<strong>in</strong>d was north-northwest <strong>and</strong> calm to 1.4 m/sec.<br />
From 0818 to 1155 EST, air temperature <strong>in</strong>creased from 20TC<br />
to 270C while relative humidity decreased from 86% to 72%.<br />
The tf was about 230 m<strong>in</strong>. There were slight differences <strong>in</strong> the<br />
time for leaves to dry, depend<strong>in</strong>g on whether the wall was up<br />
or down. In two <strong>of</strong>four locations <strong>in</strong>side the tent, the leaves dried<br />
a significant 7-8% faster with the walls up.<br />
To generalize, we calculated the effect <strong>of</strong> rais<strong>in</strong>g the walls on<br />
the time for leaves to dry. Although the <strong>in</strong>itial water on the leaf,<br />
the radiation absorbed by the leaf, <strong>and</strong> leaf size were not known<br />
precisely, these factors were not affected by wall position <strong>and</strong><br />
calculation provided a valid comparison <strong>of</strong> walls up <strong>and</strong> down.<br />
Rais<strong>in</strong>g the end walls can <strong>in</strong>crease air temperature, decrease<br />
relative humidity <strong>and</strong> <strong>in</strong>crease w<strong>in</strong>d speed <strong>in</strong>side the tent. Depend<strong>in</strong>g<br />
on the size <strong>of</strong> the plants, w<strong>in</strong>d speed just <strong>in</strong>side the tent<br />
can be <strong>in</strong>creased 40-70% by rais<strong>in</strong>g the walls. The air is generally<br />
about 1C warmer <strong>and</strong> about 5-7% drier outside than <strong>in</strong>.<br />
Thus, rais<strong>in</strong>g the walls could at most change w<strong>in</strong>d, temperature,<br />
Proc. Nad Acad. Sci. USA 79 (1982)<br />
<strong>and</strong> humidity <strong>in</strong>side the tent by these amounts, <strong>and</strong>, us<strong>in</strong>g these<br />
values, we calculated an upper limit on the effect <strong>of</strong> rais<strong>in</strong>g the<br />
walls. Penman's method for estimat<strong>in</strong>g evaporation from an extensive<br />
wetted surface (1) <strong>in</strong>dicates that these changes would<br />
make essentially no difference <strong>in</strong> the time for the entire crop<br />
to dry. We calculated the <strong>dry<strong>in</strong>g</strong> <strong>of</strong> an <strong>in</strong>dividual upper leaf <strong>and</strong><br />
found that the maximal changes <strong>in</strong> w<strong>in</strong>d, temperature, <strong>and</strong> humidity,<br />
had they occurred, might have caused upper leaves to<br />
dry about 30 m<strong>in</strong> faster on May 22 <strong>and</strong> about 40 m<strong>in</strong> faster on<br />
July 1.<br />
Germ<strong>in</strong>ation. Would a 30-m<strong>in</strong> shorter <strong>dry<strong>in</strong>g</strong> time affect the<br />
fungus? The critical stage <strong>in</strong> the disease cycle is germ<strong>in</strong>ation <strong>of</strong><br />
spores <strong>and</strong> the penetration <strong>of</strong> the leaf. These stages require<br />
water, whereas the subsequent stages can proceed <strong>in</strong> dry leaves.<br />
Thus the significance <strong>of</strong> 30 m<strong>in</strong> can be judged by the slope <strong>of</strong><br />
the curve relat<strong>in</strong>g percent germ<strong>in</strong>ation to time after wett<strong>in</strong>g<br />
spores. Between 150C <strong>and</strong> 30TC, germ<strong>in</strong>ation is most rapid dur<strong>in</strong>g<br />
the first 120 m<strong>in</strong> after wett<strong>in</strong>g <strong>and</strong> considerably slower<br />
thereafter (16). Between 0 <strong>and</strong> 120 m<strong>in</strong> a difference <strong>of</strong> 30 m<strong>in</strong><br />
could <strong>in</strong>crease germ<strong>in</strong>ation by 16-18%. Thus, where leaves dry<br />
dur<strong>in</strong>g the first 120 m<strong>in</strong> after the spores are first wet, a 30 m<strong>in</strong><br />
faster <strong>dry<strong>in</strong>g</strong> might significantly reduce germ<strong>in</strong>ation. Usually,<br />
however, the spores <strong>and</strong> leaves will be wet considerably longer<br />
than 120 m<strong>in</strong>. Between 120 <strong>and</strong> 240 m<strong>in</strong> a difference <strong>of</strong> 30 m<strong>in</strong><br />
could <strong>in</strong>crease germ<strong>in</strong>ation by 2-6%. By 240 m<strong>in</strong> germ<strong>in</strong>ation<br />
has reached its maximum <strong>and</strong> more time would not matter.<br />
Thus, 30 m<strong>in</strong> faster <strong>dry<strong>in</strong>g</strong> would generally decrease <strong>in</strong>fection<br />
less than 6%, a small matter.<br />
Rais<strong>in</strong>g the end walls affects the w<strong>in</strong>d <strong>and</strong> thus the <strong>dispersal</strong><br />
<strong>of</strong> spores from lesions near the edge <strong>of</strong> the crop but will have<br />
little effect on <strong>dry<strong>in</strong>g</strong>. Blue mold <strong>of</strong>ten starts near the edge <strong>of</strong><br />
a tent where hedges or sheds shade the plants from the morn<strong>in</strong>g<br />
sun <strong>and</strong> where wetter, cooler conditions encourage the fungus.<br />
Thus, rais<strong>in</strong>g the walls could <strong>in</strong>crease the <strong>in</strong>oculum deposited<br />
on plants well <strong>in</strong>to the tent <strong>and</strong> <strong>in</strong>crease the number <strong>of</strong> spores<br />
escap<strong>in</strong>g the tent <strong>and</strong> spread<strong>in</strong>g the disease afar.<br />
The authors thank P. A. Halbert <strong>and</strong> K. T. Paw U for technical assistance<br />
<strong>and</strong> G. J. S. Ross <strong>of</strong> Rothamsted Experimental Station for help<br />
with the statistical analysis <strong>of</strong> leaf <strong>dry<strong>in</strong>g</strong>.<br />
1. Waggoner, P. E., Pack, A. B. & Reifsnyder, W. E. (1959) Bullet<strong>in</strong><br />
626 (Connecticut Agric. Exper. Station, New Haven, CT).<br />
2. Lucas, G. B. (1980) Science 210, 147-153.<br />
3. Smith, F. B. & Hay, J. S. (1961) Quart.J. R. Met. Soc. 87, 82-101.<br />
4. Sutton, 0. G. (1953) Micrometeorology (McGraw-Hill, New<br />
York).<br />
5. Thom, A. S. (1975) <strong>in</strong> Vegetation <strong>and</strong> the Atmosphere (Academic,<br />
London), Vol 1.<br />
6. Belot, Y., Baille, A. & Delmas, J.-L. (1976) Atmos. Environ. 10,<br />
89-98.<br />
7. Roache, P. J. (1972) Computational Fluid Dynamics (Hermosa,<br />
Albuquerque, NM).<br />
8. Legg, B. J. & Powell, F. A. (1979) Agric. Meteorol. 20, 47-67.<br />
9. Gregory, P. H. (1973) The Microbiology <strong>of</strong> the Atmosphere<br />
(Wiley, New York).<br />
10. May, K. R. & Clifford, R. (1967) Ann. Occup. Hyg. 10, 83-95.<br />
11. Ross, G. J. S. (1980) Maximum Likelihood Program (Rothamsted<br />
Experimental Station, Harpenden, Engl<strong>and</strong>).<br />
12. Raschke, K. (1956) Planta 48, 200-238.<br />
13. Monteith, J. L. (1973) Pr<strong>in</strong>ciples <strong>of</strong> Environmental Physics<br />
(American Elsevier, New York).<br />
14. Waggoner, P. E. (1975) <strong>in</strong> Vegetation <strong>and</strong> the Atmosphere (Academic,<br />
London), Vol. 1.<br />
15. Turner, N. C. & Begg, J. E. (1973) Plant Physiol. 51, 31-36.<br />
16. Cruickshank, I. A. M. (1961) Aust. J. Biol. Sci. 14, 58-65.


