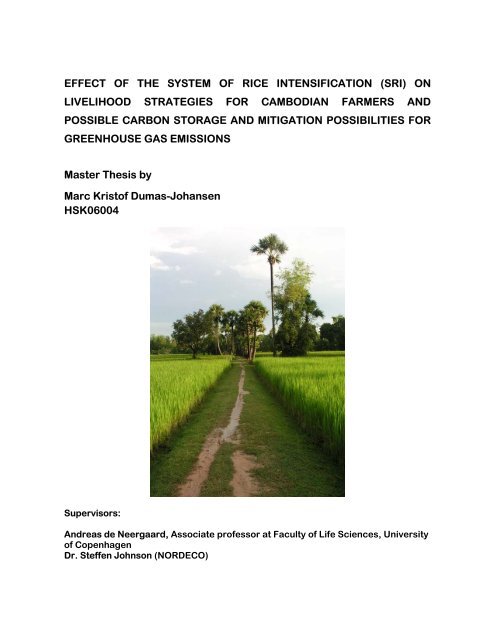
EFFECT OF THE SYSTEM OF RICE INTENSIFICATION (SRI) ON ...
EFFECT OF THE SYSTEM OF RICE INTENSIFICATION (SRI) ON ...
EFFECT OF THE SYSTEM OF RICE INTENSIFICATION (SRI) ON ...

Create successful ePaper yourself
Turn your PDF publications into a flip-book with our unique Google optimized e-Paper software.
<strong>EFFECT</strong> <strong>OF</strong> <strong>THE</strong> <strong>SYSTEM</strong> <strong>OF</strong> <strong>RICE</strong> <strong>INTENSIFICATI<strong>ON</strong></strong> (<strong>SRI</strong>) <strong>ON</strong><br />
LIVELIHOOD STRATEGIES FOR CAMBODIAN FARMERS AND<br />
POSSIBLE CARB<strong>ON</strong> STORAGE AND MITIGATI<strong>ON</strong> POSSIBILITIES FOR<br />
GREENHOUSE GAS EMISSI<strong>ON</strong>S<br />
Master Thesis by<br />
Marc Kristof Dumas-Johansen<br />
HSK06004<br />
Supervisors:<br />
Andreas de Neergaard, Associate professor at Faculty of Life Sciences, University<br />
of Copenhagen<br />
Dr. Steffen Johnson (NORDECO)
Frontpage picture: Rice fields in Prey Veng. All pictures taken by Marc Kristof Dumas-<br />
Johansen.<br />
2
Abstract<br />
The System of Rice Intensification (<strong>SRI</strong>) has been adopted by many resource poor farmers<br />
throughout the world. In Cambodia approximately 80.000 farmers practice some sort of <strong>SRI</strong> and<br />
farmers are able to increase their rice yields with lower input costs. <strong>SRI</strong> is based on transplanting<br />
one seedling per hill as opposed to several for traditional rice and managing a drying and flooding<br />
regime of the soil leading to alternately anaerobic and aerobic conditions.<br />
This study targeted farmers in the ILFARM project (Improved Livelihood of Small Farmers)<br />
initiated by the Cambodian NGO CEDAC (Centre d’Étude et de Développement Agricole<br />
Cambodgien) and the Danish organization NORDECO (Nordic Agency for Development and<br />
Ecology) in Cambodia’s Prey Veng province. The objectives were to evaluate the effect of <strong>SRI</strong> on<br />
the farmers’ livelihood situation, potentials of increasing the soil Carbon pool and mitigation of<br />
greenhouse gases (CH4, N2O and CO2). The applied methods were interviewing households in the<br />
target group and soil sampling in the <strong>SRI</strong> fields for total Carbon and Nitrogen respectively.<br />
The target farmers were able to increase their rice yields significantly using <strong>SRI</strong> as compared to<br />
their traditional rice fields. Traditional rice fields yielded 2.19 t ha -1 and <strong>SRI</strong> fields yielded<br />
3.53 t ha -1 respectively. The main reason seems to be the use of only one seedling per hill thus<br />
reducing the competition for nutrients. The use of water management was not practiced due to no or<br />
little irrigation facilities. Main constraints for further development of <strong>SRI</strong> would be the lack of high<br />
amounts of biomass. In order to cope with this, the ILFARM project will however supply the<br />
farmers with 500.000 trees in order to increase the amount of available on site biomass. It was<br />
estimated that such measures could increase the soil C pool with roughly 116 kg C ha -1 year -1 . The<br />
<strong>SRI</strong> conducted by the target farmers did not have large influences on mitigation as farmers were not<br />
able to manage a fluctuating water table due to no irrigation facilities. However if all concepts of<br />
<strong>SRI</strong> is followed this could decrease emissions of especially CH4.<br />
<strong>SRI</strong> appears to be a suitable and sustainable way of growing rice for resource poor farmers and in<br />
addition it carries the potentials of being able to increase soil fertility through an increased C pool<br />
and mitigation possibilities of greenhouse gases.<br />
3
Resumé<br />
Systemet for Ris Intensivering (<strong>SRI</strong>) er blevet anvendt af mange landmænd overalt i verden. I<br />
Cambodia dyrker cirka 80.000 landmænd en eller anden form for <strong>SRI</strong>, og de er i stand til at forhøje<br />
deres risudbytte med lavere udgifter. <strong>SRI</strong> går ud på at udplante en enkel udplantningsplante pr.<br />
”hill”(”udplantningshøj”) frem for adskillige, som ved traditionelle ris systemer, samt at styre en<br />
vandingsmodel med overrisling og tørlægning af jord, hvilket resulterer i skiftevis anaerobiske og<br />
aerobiske tilstande for jorden.<br />
Dette studie omhandler landmænd fra ILFARM projektet (Improved Livelihood of Small Farmers)<br />
igangsat af den Cambodianske NGO CEDAC (Centre d’Étude et de Développement Agricole<br />
Cambodgien) og den danske organisation NORDECO (Nordic Agency for Development and<br />
Ecology) i Prey Veng provins, Cambodia. Formålet har været at evaluere effekterne af <strong>SRI</strong> på<br />
landmændenes livsvilkår, potentialet for at forhøje kulstof mængden i jorden og reducere<br />
udledningen af drivhusgasser (CH4, N2O and CO2). De anvendte metoder indebar interviews med<br />
hushold inden for målgruppen og jordprøver fra <strong>SRI</strong> marker for henholdsvis total kulstof og<br />
kvælstof.<br />
Målgruppen har været i stand til at forhøje deres risudbytte markant, når de anvendte <strong>SRI</strong><br />
sammenlignet med deres traditionelle marker. Traditionelle rismarker gav 2.19 t ha -1 og <strong>SRI</strong><br />
markerne 3.53 t ha -1 .<br />
Hovedgrunden til dette synes at være, at landmændene kun anvendte én udplantningsplante per<br />
”høj”, og derved har kunnet reducere konkurrencen om næringsstofferne. Brug af overrisling og<br />
tørlægning af jord har ikke været taget i brug af landmændene pga. ingen eller få<br />
vandingsfaciliteter. Den største udfordring for at udbrede <strong>SRI</strong> synes at være mangel på store<br />
mængder organisk materiale. For at løse dette vil ILFARM projektet donere 500.000 træer til<br />
landmændene for at forhøje tilgangen til biomasse på stedet. Der antages, at med sådanne inputs<br />
ville landmændene kunne forhøje kulstofpuljen med 116 kg C ha -1 år -1 . <strong>SRI</strong> praktiseret af<br />
landmændene i målgruppen har ikke vist nogen større effekt på reduktion af udledningen af<br />
drivhusgasser, eftersom landmændene ikke var i stand til at hæve og sænke vandstanden pga. ingen<br />
adgang til vandingsfaciliteter. Men hvis alle <strong>SRI</strong> koncepter bliver fulgt, vil dette kunne have stor<br />
indflydelse på reduktion af specielt CH4.<br />
<strong>SRI</strong> synes at være en egnet og bæredygtig måde at dyrke ris på for ressourcefattige landmænd, og<br />
desuden har metoden potentialer for at kunne højne jordens næringsværdi igennem en forøgelse af<br />
kulstofpuljen og reduktion af drivhusgasser.<br />
4
Preface<br />
This report is part of my MS.c degree in Horticultural Sciences at the Faculty of Life Sciences,<br />
University of Copenhagen, Denmark. The idea of working with rice in Cambodia came to me early<br />
2008 when I did an internship with the Danish NGO (Non Governmental Organization) ADDA<br />
(Agricultural Development Denmark Asia) in Siem Reap and Banteay Mean Chey Province -<br />
northwest Cambodia. I became very fascinated with Cambodian culture and rice production has<br />
always been near to my heart. I therefore decided to combine Cambodia and rice systems.<br />
Working with this report (data collection, field work, data analysis and writing) took place from the<br />
1 st of July 2008 till the 14 th of July 2009. The first months were spent on studying and reviewing the<br />
literature for existing data and information on my topic. I spent two months in Cambodia from the<br />
15 th of September 2008 till the 15 th of November 2008 collecting data. In Cambodia I was assisted<br />
and guided by CEDAC (Centre d’Étude et de Développement Agricole Cambodgien) a Cambodian<br />
NGO collaborating with NORDECO (Nordic Agency for Development and Ecology) on <strong>SRI</strong><br />
farming in Prey Veng province. All data for my interviews and soil samples were collected in Prey<br />
Veng. Throughout my time in Cambodia I was assisted and facilitated by RUPP (Royal University<br />
of Phnom Penn) and CEDAC in data collecting and forming the project. I also spent time with the<br />
ENLAB (Environmental Analysis Laboratory) of PNSA (Preak Leap National School of<br />
Agriculture) who analyzed my soil analysis. I finalized all data analysis and writings at the Plant<br />
and Soil section, Department of Agriculture and Ecology at the Faculty of Life Sciences, University<br />
of Copenhagen.<br />
Acknowledgements<br />
I would like to express my gratitude to my two supervisors Associate professor Andreas de<br />
Neergaard (Faculty of Life Sciences) and Dr. Steffen Johnson (NORDECO) for guiding, assisting<br />
and encouraging me throughout the process. I would also like to thank my first supervisor (who left<br />
his position at Faculty of Life Sciences for a new job in late 2008) Associate professor Henning<br />
Høgh Jensen (National Environmental Research Institute, Aarhus University) for inspiring me to<br />
work with this project and starting up the whole process.<br />
Furthermore I would like to pay my gratitude to:<br />
Mr. San Vibol (RUPP) for his invaluable help throughout my stay in Cambodia.<br />
5
Mr. Ma Veasna (CEDAC) for his help and guidance in collecting my data in Prey Veng province<br />
and for helping me throughout the period with valuable information on the ILFARM project and<br />
CEDAC.<br />
Ms. Leakana (RUPP) for her excellent translation and help as my field assistant in Prey Veng<br />
during the data collection.<br />
Local CEDAC staff at the Prey Veng head office for their assistance, driving, field work, kindness<br />
and enthusiasm.<br />
Ms. Men Sokuntheary (ENLAB, PNSA) for her help and assistance for my soil data analysis.<br />
To Eva-Maria Didden, Alonzo Alfaro and Bhim Bahadur Ghaley for our constructive and<br />
interesting discussion on statistics and rice production respectively.<br />
Lastly but not least I would like to thank my family and friends, for their moral support, comments<br />
and encouragements.<br />
Copenhagen the 14 th of July 2009 Marc Kristof Dumas-Johansen<br />
6
Table of contents<br />
Preface..................................................................................................................................................5<br />
Acknowledgements..............................................................................................................................5<br />
1. Introduction......................................................................................................................................9<br />
1.1 Research objectives and hypotheses ........................................................................................11<br />
1.2 Delimitations............................................................................................................................12<br />
1.3 Structure of the report ..............................................................................................................12<br />
2. The role of Soil Organic Matter (SOM) in flooded rice soils........................................................13<br />
2.1 Definition of SOM ...............................................................................................................13<br />
2.2 Decomposition and effects of OM in flooded soils .............................................................14<br />
2.3 Storing of C in soils .............................................................................................................15<br />
3. Greenhouse gas emissions and possible ways of mitigation .........................................................17<br />
3.1 GHG emissions through time...............................................................................................17<br />
3.2 The effect of organic amendments and chemical fertilizers on GHG emissions.................19<br />
3.3 Management practices and their effect on GHG emissions.................................................20<br />
3.4 Drainage periods and GHG emissions.................................................................................21<br />
4. The System of Rice Intensification (<strong>SRI</strong>)..................................................................................22<br />
4.1. The history of <strong>SRI</strong>...............................................................................................................22<br />
4.2 The concepts of <strong>SRI</strong>.............................................................................................................22<br />
4.3 The differences between <strong>SRI</strong> and a traditional/conventional rice system ...........................24<br />
4.4 Difficulties associated with <strong>SRI</strong>...........................................................................................26<br />
5. Rice in Cambodia.......................................................................................................................26<br />
5.1 The history of rice in Cambodia ..........................................................................................26<br />
5.2 Rice cropping systems .........................................................................................................27<br />
5.3 <strong>SRI</strong> in Cambodia..................................................................................................................29<br />
6. Development Paradigms ............................................................................................................30<br />
6.1 Development strategies........................................................................................................30<br />
6.3 Sustainability in rural livelihood strategies..........................................................................31<br />
7. Study and experimental implementation site.............................................................................33<br />
7.1 Prey Veng province..............................................................................................................33<br />
7.2 Climatic conditions ..............................................................................................................34<br />
8. Materials and methods ...................................................................................................................35<br />
8.1 Soil sampling............................................................................................................................36<br />
8.2 Interviews.................................................................................................................................38<br />
8.3 Statistical analyses ...................................................................................................................39<br />
9. Results and discussion ...................................................................................................................39<br />
9.1 Soil pH, Carbon and Nitrogen – the biophysical environment................................................39<br />
9.2. Identified Livelihood strategies ..............................................................................................44<br />
9.3. Household assets.....................................................................................................................47<br />
9.4. Compost production................................................................................................................48<br />
9.5. Application of amendments ....................................................................................................49<br />
9.5. <strong>SRI</strong> ..........................................................................................................................................51<br />
9.6. Can <strong>SRI</strong> mitigate GHGs and at the same time increase soil quality through C sequestration?<br />
........................................................................................................................................................65<br />
10. Conclusion ...................................................................................................................................71<br />
11. References....................................................................................................................................73<br />
7
APPENDICES ...................................................................................................................................78<br />
APPENDIX A. Name, village and sex of interviewed farmers.....................................................78<br />
APPENDIX B. Soil sampling methodology.................................................................................79<br />
APPENDIX C. <strong>SRI</strong> farmer questionnaire......................................................................................80<br />
APPENDIX D. Soil analysis results. .............................................................................................82<br />
APPENDIX E. LIVELIHOOD ASSESTS. ...................................................................................83<br />
APPENDIX F. Interview with Ma Veasna project coordinator of the ILFARM project. .............87<br />
8
1. Introduction<br />
Rice (Oryza sativa L.) is the basic diet of approximately 40% of the world’s human population<br />
(Kundu & Ladha, 1999) but with a still increasing population the need for more rice is alarming<br />
(Surridge, 2004). Facing this threat already some decades ago, the “Green Revolution” was initiated<br />
in order to intensify rice production through Higher Yielding Varieties (HYV), chemical fertilizers<br />
and pesticides (Greenland, 1997). As a result the world’s production of rice doubled in the periods<br />
of the 1960’s to the 1980’s (Tsujimoto et al., 2009). However the rice yields in irrigated rice areas<br />
in Asia have stopped increasing during the last decade and with a still increasing human population<br />
the need for a continuous increase is highly necessary (Tsujimoto et al., 2009). The Green<br />
Revolution focussed mainly on irrigated areas (Dobermann & White, 1999). However, in order to<br />
reach sustainable levels of rice production, the rainfed lowland areas must be developed as they<br />
possess the potentials of increasing future rice production (Dobermann & White, 1999). It is<br />
expected that in order to feed a growing human population, yield increases of up to 70% are<br />
required from both irrigated and rainfed lowland areas (Dobermann & White, 1999). Most of the<br />
rainfed lowland areas are dominated by small scale farmers conducting various types of rice<br />
farming but all depending on rainfall and natural flooding (Stoop et al., 2002).<br />
The System of Rice Intensification (<strong>SRI</strong>) is one of them. It was developed during the early 1980’s<br />
in Madagascar as a low input system for resource poor farmers (Stoop et al., 2002). It differs from<br />
rainfed traditional/conventional rice systems in several ways. The two main differences are i)<br />
transplanting only one younger seedling per hill and ii) a proper water management lowering and<br />
increasing the water table in a specific pattern (Laulanie, 1993). This water management involves a<br />
moist soil during the vegetative stage, flooded during the panicle stage and some two weeks before<br />
harvest total drainage of the field (Sheehy et al., 2004). It is believed that <strong>SRI</strong> systems can increase<br />
rice yields remarkably (Uphoff, 1999; Stoop et al., 2002; Kabir, 2006) through fewer inputs and<br />
improve soil quality over time (Satyanarayana et al., 2007) from amendments of organic materials.<br />
<strong>SRI</strong> is based on different management techniques but also relies heavily on farmers’ skills and<br />
investments of labour (Uphoff, 1999). Many critical voices though claim that the <strong>SRI</strong> is a labour<br />
intensive system (Moser & Barrett, 2003) and requires irrigation facilities in order to work properly<br />
(Sinha & Talati 2007). The access and availability of organic materials may also pose problems<br />
(Dobermann, 2004) for full scale adoption by small scale farmers.<br />
9
The majority of Cambodia’s 1.8 million farmers (Koma, 2007) grow their rice under rainfed<br />
lowland conditions (Tong et al., 2007) with a national rice yield of 2.49 t ha -1 (IRRI, 2006). The<br />
yields for resource poor farmers (RPF) located in areas with poor soils are though often much<br />
lower. The Prateah Lang soil group is Cambodia’s largest rice growing soil group (28%) which is<br />
low in nutrients and Carbon and where yields often range from 800 to 1400 kg ha -1 (White et al.,<br />
1997a). Pheav et al. (2005) refer to the Soil Survey Staff (1994) who characterizes the Preateah<br />
Lang soil group as a Plinthustalf. The soil type is a sandy loam. Prey Veng province is one of many<br />
areas in Cambodia containing this soil group where farmers are short of resources with little access<br />
to chemical fertilizers and rice yields stay low.<br />
<strong>SRI</strong> was introduced to Cambodia in 2000 through various NGO projects (Anthofer, 2004) and it is<br />
now practiced by approximately 80.000 farmers out of Cambodia’s total 1.8 million farmers (Koma,<br />
2007). Farmers do however practice it in many different ways with modified structures thus making<br />
it slightly different from the concepts developed by Laulanie (1993). Household income and access<br />
to labour input and biomass will have a large influence on the type of <strong>SRI</strong> practiced by the farmers.<br />
The local Cambodian NGO CEDAC has implemented a new <strong>SRI</strong> project in Prey Veng province in<br />
cooperation with the Danish organization NORDECO and the organic Danish dairy Oellingegaard.<br />
Together they investigate the possibilities of storing C in the soils and reducing emissions of<br />
greenhouse gases (GHGs) through the <strong>SRI</strong> concept (NORDECO, 2008). CEDAC has a lot of<br />
experience with <strong>SRI</strong> and are considered as one of the pioneers in introducing <strong>SRI</strong> in Cambodia.<br />
Flooded rice fields are in focus because they are major contributors to emissions of GHGs. It<br />
Flooded rice production, animal production (ruminants), animal production waste and burning of<br />
biomass account for app. 33% of the world’s total methane emissions (Mosier et al., 1998).<br />
Methane is produced from decomposition of organic matter during anaerobically conditions<br />
(Wassmann et al., 2000) and is a GHG as it traps 23 (Yue et al., 2005) to 30 times more heat than<br />
CO2 (Neue, 1993). Many studies on GHG emissions from flooded rice fields conclude that several<br />
drainage periods during the rice crop cycle will lower the total emission of methane from a flooded<br />
rice field (e.g. Wassmann et al., 2000; Yue et al., 2005) which however might increase other GHGs<br />
such as nitrous oxide (Zou et al., 2005; Li et al., 2009) hence result in a trade-off situation. The use<br />
of different organic inputs might as well influence the emission rates. Compost applied to flooded<br />
10
fields will normally result in lower emissions of methane than applications of green manure and rice<br />
straw (Yagi & Minami, 1990; Neue, 1993) which are all typical farming inputs in resource poor<br />
areas.<br />
Carbon (C) storing in soils is as well in focus because it is one of many indicators of soil quality –<br />
as it is a large component of organic matter (OM) (Brady & Weil, 1999a) which when decomposing<br />
mineralizes nutrients and thereby increase soil fertility (Larson & Clapp, 1984).<br />
This report takes part in the project initiated by CEDAC and NORDECO in Prey Veng province<br />
assessing the impact of <strong>SRI</strong> on the livelihoods of RPF.<br />
1.1 Research objectives and hypotheses<br />
• <strong>SRI</strong> fields will result in higher yields than traditionally grown rice fields.<br />
• Farmers with higher incomes will potentially be the most suitable to adapt the new <strong>SRI</strong><br />
techniques. This will result in a higher soil quality (assessed by soil Carbon and Nitrogen<br />
content) and <strong>SRI</strong> rice yields as compared to farmers with lower incomes.<br />
• Can <strong>SRI</strong> be regarded as part of a sustainable livelihood strategy/farming system and at the<br />
same time environmentally sustainable? i.e. is <strong>SRI</strong> able to mitigate GHG emissions (CH4,<br />
N2O, CO2) and increase soil quality in terms of C storage?<br />
o The <strong>SRI</strong> practiced by the target farmers and the “true” theoretical concepts of <strong>SRI</strong><br />
are compared with regards to efficiency and sustainability.<br />
• The success of <strong>SRI</strong> will very much depend on the way it is introduced to farmers and the<br />
organization(s) behind. Can <strong>SRI</strong> survive in a farming community without a strong<br />
organization to monitor, inspire and involve farmers?<br />
11
1.2 Delimitations<br />
<strong>SRI</strong><br />
The implementation and sustainability of <strong>SRI</strong> is tested and evaluated. The target farmers’<br />
perception of <strong>SRI</strong> is compared with the theoretically described <strong>SRI</strong> concepts. The farmers’ <strong>SRI</strong><br />
perception is documented from the field data from Cambodia and compared with the theoretical<br />
writings of <strong>SRI</strong> as no such fields were present in the area. <strong>SRI</strong> in Cambodia is often found in areas<br />
where rainfed lowland rice is grown. Other rice cropping systems will not be dealt with in details.<br />
Soil quality<br />
This report is measuring the soil quality based on the total soil C content and to a minor extent soil<br />
N. An estimated nutrient budget is evaluated on the basis of literature findings as a total soil<br />
analysis was too expensive to include in this report. Soil pH is measured and evaluated but is not<br />
included in any further discussion and but included in order to key and identify the soil type and<br />
general characteristics. The fertility value of the compost/biomass production in the project was<br />
evaluated theoretically as compost analysis was too expensive to include in this report. The main<br />
idea is to evaluate the effects of <strong>SRI</strong> on the livelihood strategies and include its effects on the soil<br />
parameters C and N and other macro and micronutrients are therefore not dealt with in details.<br />
GHG emissions<br />
The emissions of CO2, N2O and CH4 are discussed but most focus will be put on methane as it is the<br />
most dominant gas emitted from flooded rice fields. The general causes why these three GHGs are<br />
produced will be introduced, but the focus lies on the potential of <strong>SRI</strong> to mitigate CO2, N2O and<br />
CH4. Other GHGs are not included. The effect of <strong>SRI</strong> on the mitigation rates was evaluated<br />
theoretically. GHGs emission data was too expensive to address and no materials to assess such<br />
rates are available in Cambodia.<br />
1.3 Structure of the report<br />
For a better understanding on the potential effects of <strong>SRI</strong> on the soil C level and GHG emissions,<br />
chapter 2 introduces general characteristics of flooded rice soils and the effects of organic material<br />
applications. Chapter 3 discusses the emissions of CO2, N2O and CH4 from flooded rice fields and<br />
evaluates mitigation effects from applying <strong>SRI</strong> alike water management and application of organic<br />
12
materials. These two chapters lead to chapter 4, 5 and 6 introducing <strong>SRI</strong>, Cambodian rice culture<br />
and development strategies in developing countries respectively. Chapter 7 and 8 introduce the<br />
target area in Cambodia and materials and methods applied in the field and laboratory for data<br />
collection respectively. Results are discussed and evaluated in chapter 9 and finally general<br />
conclusions are drawn in chapter 10.<br />
2. The role of Soil Organic Matter (SOM) in flooded rice soils<br />
2.1 Definition of SOM<br />
SOM can be defined as the sum of all organic matter (OM) in a soil, resulting from undecayed OM<br />
from plant tissues, soil microorganisms and animals, grasses, weeds, leaves and roots (Borggaard &<br />
Elberling, (2003). These different soil ingredients are part of different pools all responsible for the<br />
definition of SOM. The most important pools are i) the litter pool comprising e.g. crop residues, ii)<br />
light fraction - with root residues and iii) microbial biomass – the degradation of plant material<br />
(Stevenson & Cole, 1999). As all OM contains large percentages of C (Brady & Weil, 1999a) and<br />
in average SOM contains 58% C (Borggaard & Elberling, 2003). Roughly speaking can C in soils<br />
divided between two pools: Soil Organic Carbon (SOC) and Soil Inorganic Carbon (SIC) (Lal,<br />
2002). The SOC pool is composed of two very different fractions. The inert pool which does not<br />
comprise mineralization and is determined by climate, soil type and landscape position (Lal, 2006).<br />
The other pool is the labile pool which relies on management practices (Lal, 2006). The SOC pool<br />
comprising the labile factors can be influenced by management and there are direct effects on soil<br />
quality and the SOC content is linked to the labile pool (Lal, 2006). The labile pool is also<br />
interesting to focus on as it is near to the soil surface and possible GHG emissions will emit from<br />
this pool (Schlesinger & Andrews, 2000) and it has faster turnover rates of OM than the inert pool<br />
(Mandal et al., 2008). Mineralization is taking place in this pool and thereby the key to increase<br />
productivity is through SOC. This report measured the percentage of OM in the soils of Prey Veng,<br />
Cambodia. The terms, SOM, SOC, OM and C will all be used throughout this report to express the<br />
soil quality.<br />
13
2.2 Decomposition and effects of OM in flooded soils<br />
As flooded rice soils provide anaerobic conditions for the soil environment, the decomposition<br />
reactions are very different than under aerobic soil conditions. Decomposition rate is very slow<br />
under anaerobic conditions resulting in a larger build up of OM under flooded conditions as<br />
compared to non flooded fields (Mitsuchi, 1974; Greenland, 1997; Brady & Weil, 1999a), and thus<br />
both already existing and added OM will be decomposed with a slower rate (Mitsuchi, 1974).<br />
Anaerobic conditions will lead to several changes in the soil. Some important ones are a lowered<br />
redox potential and a change in the population of microorganism (Watanabe, 1984).<br />
The decomposition of OM depends on several factors such as the quality of the applied material, the<br />
general soil texture, the climate and soil disturbances (Morari et al., 2006). C:N ratio of the applied<br />
organic compounds is as well very important as it indicates how fast a given material is decaying<br />
(Brady & Weil, 1999a). The lower the C:N ratio of an organic input the faster the decay.<br />
When a soil is submerged the soil Oxygen is depleted and pore spaces are filled with water leaving<br />
only a few cm of soil near the surface and below the plough layer with Oxygen (De Datta, 1987).<br />
This layer is typical less than 10 cm in depth and is oxidized due to the floodwater above which is<br />
oxygenated and then oxygen is diffused to this thin soil layer (Dobermann & Fairhurst, 2000).<br />
Under this oxidized layer is the reduced bulk soil (Dobermann & Fairhurst, 2000) which is<br />
depending on the redox potential. The redox potential is seriously affected under submerged<br />
conditions and most substances found in the soil are reducing agents as compared to aerated soils<br />
where substances are oxidizing agents (Brady & Weil, 1999a). General advantages are increased<br />
supplies of Nitrogen, Phosphorus, Potassium, Iron, Manganese, Molybdenum and Silicon (De<br />
Datta, 1987). General disadvantages are losses of N from denitrification, decreased availability of<br />
Sulfur, Copper and Zinc and increased production of toxic compounds damaging plants.<br />
Greenland (1997) states that due to the reduction in submerged soils some elements like Iron and<br />
Manganese might reach very high and toxic levels – and plants might be damaged from such high<br />
concentrations.<br />
SOM can increase soil quality in terms of possessing high percentages of C and nutrients,<br />
increasing good soil structure, enhancing Cation Exchange Capacity (CEC), pH buffering and<br />
aggregate stability (Borggaard & Elberling, 2003). Aggregate stability is though destroyed through<br />
14
the process of puddling – which is also the purpose (Greenland, 1997). Puddling is a process,<br />
initiated before transplanting/seeding rice, where fields are flooded and then harrowed or ploughed<br />
resulting in a decrease of the aggregate stability due to both a wetting and mechanical intervention<br />
of the aggregates (De Datta & Hundal, 1984). Puddling is used in order to prevent loss of water<br />
from e.g. percolation on especially alluvial and mountain soils, to level the fields and make it easier<br />
to transplant rice seedlings (Greenland, 1997).<br />
When OM is decomposed nutrients are mineralized and thereby increasing soil fertility (Larson &<br />
Clapp, 1984). But in submerged conditions decomposition is very slow and mineralization is<br />
therefore slowed down as well and nutrient availability might therefore be decreased. The most<br />
important effect of adding composts to rice fields is to increase available N and to balance the<br />
immobilization and mineralization of N found in the soil (Kumazama, 1984).<br />
Nutrients will though not be available to plants before a decomposition of the OM sets in and the<br />
OM is mineralized and releases inorganic nutrient ions in available forms to plants (Brady & Weil,<br />
1999a). Fresh OM inputs should be avoided such as fresh rice straw as larger amounts applied to<br />
fields will result in N-immobilization and a high reduction of the soil and should like all other fresh<br />
OM be composted in order to reach a higher level of efficiency (Inoko, 1984). If large amounts of<br />
fresh OM inputs are applied , it is possible that the soil will be further reduced and produce GHGs<br />
(Greenland, 1997). These risks will be introduced in chapter 3. Submerged soils normally<br />
mineralize higher amounts of N as less is immobilized compared to aerobic soils even if<br />
decomposition of OM is slower (De Datta, 1987).<br />
2.3 Storing of C in soils<br />
The content of SOM depends on the equilibrium between losses of C and gains of C from mainly<br />
respiration, erosion, removal of plant residues, plant growth in situ and applications of organic<br />
inputs respectively (Brady & Weil, 1999a). The key issue is to apply enough inputs of high quality<br />
materials in order to maintain the C content at equilibrium or slowly increase its content.<br />
2.4.1 Ways of increasing C in soils through management<br />
Many studies have identified possible management methods which can alter the C content in a soil<br />
hence affecting the OM content. However, most studies relate to aerobic field conditions.<br />
15
Lal (2006) estimates that by using the Recommended Management Practices (RMPs) it is possible<br />
to increase the SOC content of the soil and then directly increasing the yield 15-25 kg ha -1 year -1 if<br />
the RMPs will enhance the SOC pool with at least 0.5 Mg C ha -1 year -1 .<br />
RMPs are a set of tools which will apply to all kinds of plant production sectors and are as<br />
described and discussed by Follett (2001) including various concepts such as conservation tillage,<br />
crop residue management, fallow management etc. Some of the concepts might not be possible to<br />
perform when growing flooded rice though or they will not be as effective as under aerobic<br />
conditions.<br />
Jarecki & Lal (2003) evaluated the potentials for SOC sequestration for rice and concluded that 401<br />
kg C ha -1 can be stored annually with an average rice yield of 3.96 t ha -1 and a C input in terms of<br />
crop residues of 2.67 t ha -1 year -1 . Mandal et al. (2008) investigated the role of time and fertilizer<br />
application and their role on the SOC content from a long term study involving 36 cropping seasons<br />
of double rice cropping in India. They concluded that applying NPK fertilizers and NPK + compost<br />
increased the total C content in the soil with 33.5% and 54.9% compared to the control of 28.5 Mg<br />
C ha -1 (Mandal et al., 2008).<br />
Green manures are often an important part of rice cropping systems as e.g. legumes and<br />
bushes/trees (Greenland, 1997). Ramesh & Chandrasekaran (2004) investigated the role of the<br />
green manure (GM) crop Sesbania rostrata Berm in a double rice cropping system per year and<br />
concluded that the trials with GM resulted in the highest SOC contents of 10.63% increase<br />
compared to the control for a period of two years 1 .<br />
Other management ways adding C to the soil is by conservation tillage (Lal, 2007) or zero/no<br />
tillage. Reduced tillage was initiated in the 1950ies with the use of pesticides such as dalapon (2,2dichloropropionic<br />
acid) and later paraquat and glyphosate were used to destroy soil surface cover<br />
(De Datta, 1987). Under especially tropical conditions where heavy rainfalls can destroy soil<br />
structure and lead to erosion and little or no disturbance of soil can be a method to cope with such<br />
problems (De Datta, 1987). The benefits of zero tillage or conservation tillage are amongst others:<br />
saving of water with up to 20-30% of what the rice crop needs (De Datta, 1987) and a reduction in<br />
loss of SOC and plant nutrients (Jarecki & Lal, 2003) respectively.<br />
1 The GM Sesbania rostrata Berm was sown a rate of 50kg of seed ha —1 (Ramesh & Chandrasekaran, 2004).<br />
16
Crop residues<br />
The use of rice straw rice is a free source of nutrients for farmers (Olk et al., 2000) although it is<br />
low in nutrients. In resource poor areas rice straw is though often removed from the fields in order<br />
to use as e.g. animal fodder (Dobermann & Witt, 2000) even though rice straw contains high<br />
amounts of lignins and silicas making it difficult for animals to digest (Greenland, 1997).<br />
If straw is present, the time of incorporation and the incorporation depth are very important factors<br />
in order to gain the full potential from the straw (Dobermann & Witt, 2000). Rice stubble and roots<br />
will as well have some importance supplying organic materials to the soil.<br />
3. Greenhouse gas emissions and possible ways of mitigation<br />
Applying plant residues in several forms will not only benefit soils but also influence the possible<br />
dangers of GHG emissions. In especially the tropics, farming and global warming might go hand in<br />
hand concerning rice production as there is a potential future threat of contributing to global<br />
warming.<br />
3.1 GHG emissions through time<br />
Since the beginning of the industrialization and till present (1998) Land Use Changes (LUC) and<br />
fossil fuel burning + cement production have caused emissions of 136 + (-) 55 Gt 2 C and 270 + (-)<br />
30 Gt C in form of carbon dioxide respectively (IPCC, 2000). LUC through the 1980ies and<br />
1990ies caused emissions of approximately 1.7 +(-) 0.8 Gt C and 1.6 + (-) 0.8 respectively (IPCC,<br />
2000). Agriculture is one of the main contributors to LUC. Agricultural related activities account<br />
for approximately 33% of the world’s total methane emissions comprising: animal production<br />
(ruminants), waste from animal production, burning of biomass and flooded rice production (Mosier<br />
et al., 1998). According to Lal (2002) the outlets of carbon (C) from LUC, agricultural activities<br />
and deforestation were higher than outlets from fossil fuel combustion until the 1970’s. Since 1750<br />
the amount of atmospheric CO2 has increased with 31% due to burning of fossil fuels LUC (Lal,<br />
2004). Global emissions of CO2 from LUC + cultivation and fossil fuel burning amount to app. 136<br />
and 270 Pg respectively (Lal, 2004). Agriculture (through human related activities) is presently<br />
2 1GT = 1Pg = 10 12 kg.<br />
17
esponsible for 50% of the world’s total emissions of CH4, 25% of CO2 and 70% of N2O<br />
respectively (Hutchinson et al., 2007).<br />
LUC in Cambodia has during the last decades resulted in a decrease of forest areas of 2.5 million ha<br />
in the period from 1973 to 1997 (Sasaki, 2006). As a result of these actions it is estimated that an<br />
annual C emission from Cambodian soils due to LUC and logging was app. 13.7 Tg C in the period<br />
1993-2003, (Sasaki, 2006) which is probably much higher now as logging and LUC are to be found<br />
everywhere in Cambodia.<br />
Irrigated rice fields emit CO2 and CH4 (Kimura et al., 2004) and especially CH4 emissions from<br />
irrigated rice fields are very significant (Neue, 1993). Vergé et al. (2007) estimate that the<br />
emissions of methane from rice paddies in Asia in 1990 and 2000 were 705 Tg CO2 equivalent and<br />
732 Tg CO2 equivalent respectively compared to global emissions of 845 and 898 Tg CO2<br />
equivalent for the same period respectively. Neue (1997) evaluates that the annually seasonal<br />
emission rates of methane for Asian irrigated rice paddies is 312 kg m -2 . Kimura et al., (2004)<br />
estimate that the average CO2 and CH4 production from Japanese and Thai rice fields are; Japan:<br />
1.4-1.5 t C ha -1 and 37-38 t C ha -1 Thailand; 1.8-2.1 t C ha -1 and 52-66 t ha -1 respectively. Figure 1<br />
illustrates global annual methane emissions from rice fields. Asia and especially South East Asia is<br />
a main contributor to methane emissions compared to the other rice growing areas.<br />
Figure 1. Global annual CH4 emissions from the rice growing areas of the world. Yan et al. (2009).<br />
18
The degree of GHGs emissions will to a large extend depend on what type of rice cropping systems<br />
is used. Irrigated/continuously flooded systems will pose the largest risks. Flooded rice fields with<br />
anaerobic conditions will produce methane from decomposition of organic matter anaerobically<br />
(Wassmann et al., 2000) and emit CH4 through rice plants (roots and stems) as either diffusion or<br />
ebullition (Neue, 1993). Methane is found in smaller amounts in the atmosphere than CO2 but one<br />
molecule of methane will trap as much heat as 30 molecules of CO2 (Neue, 1993), although Yue et<br />
al. (2005) state that the Global Warming Potential (GWP 3 ) of CH4 is 23.<br />
Nitrous oxide (N2O) is emitted when N is added to agricultural soils, in forms of e.g. fertilizers,<br />
through volatilization of e.g. NH3, leaching, run-off and redeposition (Zou et al., 2009) and though<br />
it is found in smaller concentrations than CO2 in the atmosphere the GWP of N2O is 296 times those<br />
of CO2 (Li et al., 2009). N2O in soils is derived from production of nitrification and denitrification<br />
processes (Zou et al., 2005) and is favored by aerobic conditions. CO2 derived from soil is produced<br />
from respiration from microbes, roots and from bulk soil respectively (Xu et al., 2008).<br />
3.2 The effect of organic amendments and chemical fertilizers on GHG<br />
emissions<br />
Organic amendments or chemical fertilizers will pose various and different affects on GHGs<br />
emissions from soils. Lou et al., (2007) conducted studies on CO2 and N2O emissions from irrigated<br />
rice fields and concluded that when rice straw was applied and incorporated in the soils the<br />
emissions of CO2 and N2O were much higher than fields where straw had been removed and only<br />
rice roots were left. This is because straw contains more cellulose than roots and roots contain more<br />
lignin than straw and will therefore decompose slower than straw (Lou et al., 2007). Irrigated rice<br />
soils amended with rice straw emit more than twice as much CH4 compared to soils amended with<br />
mineral fertilizers (Yagi & Minami, 1990) and soils without any amendments (Watanabe et al.,<br />
2005). However disposal of rice straw long time before a rice crop is initiated will decrease<br />
methane emissions (Yan et al., 2009). Yan et al. (2009) estimated that if all single and double<br />
cropping rice growing areas would apply their straw off the season, methane emissions could be<br />
decreased with 4.1 Tg a - 1 per year. Yan et al. (2009) develop a theoretical map of south East Asia<br />
(figure 2) illustrating potential mitigation possibilities (drainage and application of straw off the<br />
growing season) and their effects per year on the emission of methane.<br />
3 GWP is a set of tools comparing a given GHG and how much heat it will capture compared to CO2 (Li et al., 2009)<br />
19
Figure 2. Effects of applying rice straw outside the season and draining continuous flooded rice fields.<br />
Units are in emissions of kg CH4 km -2 a -1 year -1 .Yan et al. (2009).<br />
Yagi & Minami (1990) also studied effects of soil types on methane emissions and concluded that<br />
soils with high OM content have a higher influence on CH4 than soils with low OM content. Thus<br />
emitting more methane than soils low in OM is most likely due to a lower anaerobic decomposition.<br />
Resource poor farmers (RPF) who cannot afford to invest in mineral fertilizers rely on natural<br />
amendments such as compost and green manure. The most sustainable amendments would seem to<br />
be composts as compost only slightly increase methane emissions compared to green manure and<br />
rice straw (Neue, 1993; Yagi & Minami, 1990). Compost combined with mineral fertilizers<br />
decreased CH4 emissions from rice fields in India twice as much as mineral fertilizers alone (Nayak<br />
et al., 2007) indicating that possible combinations of these two amendments would be ideal.<br />
3.3 Management practices and their effect on GHG emissions<br />
Management practices such as puddling will have some effect on GHG emissions. Harada et al.,<br />
(2007) studied the effect of no puddling in irrigated rice farming and found that the emissions of<br />
CH4 was 43% lower than in conventional puddling practices in Japan. CO2 emissions from no<br />
puddled fields were 1740 kg CO2 ha -1 lower than in puddled fields (Harada et al., 2007). It is<br />
though questionable if RPF conduct puddling. De Datta (1987) states that large quantities of water<br />
20
are required (app. 150-200 mm) and farmers producing lowland rainfed rice are forced to wait app.<br />
one to three months before there is enough water to puddle.<br />
3.4 Drainage periods and GHG emissions<br />
The effects of a changing water level in a rice field leading to anaerobic and aerobic conditions will<br />
influence GHGs emissions and especially methane emissions. Wassmann et al., (2000) conducted<br />
studies on CH4 emissions from five locations in Asia and discovered that soils amended with<br />
organic manure had higher emissions of GHGs compared to soils fertilized with mineral fertilizers.<br />
Intermittent flooding and mid season drainage resulted in lower emissions than with conditions of<br />
continuous flooding (Wassmann et al., 2000). Emission rates ranged from less than 100 kg CH4<br />
ha -1 to more than 400 kg CH4 ha -1 for intermittent irrigation and continuous flooding respectively<br />
(Wassmann et al., 2000). Emissions were different within the different periods of the rice crop with<br />
highest emissions during the reproductive stage and the highest temperatures (Wassmann et al.,<br />
2000) which is also true for the other GHGs.<br />
Drainage periods will lower CH4 but will however affect the emission rates of N2O. Yue et al.<br />
(2005) compared continuous flooding with intermittent flooding and their role on CH4 and N2O<br />
emissions in Southern China and found that intermittent flooding showed a 17% lower GWP<br />
compared to continuous flooding while there was no significant differences between yields.<br />
Methane emissions decreased but N2O increased with intermittent flooding but the trade-off was the<br />
most optimum as compared to continuous flooding (Yue et al., 2005). Zou et al. (2005) found that<br />
in Chinese rice fields with continuous flooding N2O emission rates was 0.03 mg m -2 d -1 as<br />
compared to rice cropping with a mid season drainage of 14.1 mg m -2 d -1 . Both treatments received<br />
2.25 t ha -1 of wheat straw. Mid season drainage periods are often used in China and Japan but not to<br />
a large extent in warmer rice growing climates (Greenland, 1997). The effect of drainage in the<br />
Cambodian climate, which is very different from the Chinese and Japanese climatic situation, might<br />
result in different emission rates due to temperature and a faster decomposition of OM.<br />
Water management involving mitigation interests or because of water shortages will have large<br />
influences on emission rates of CH4, N2O and CO2 with many trade-offs involved (Frolking et al.,<br />
2004). A farming system trying to involve mitigation of all three GHGs and involve and deal with<br />
the trade-offs would be an optimal one. But which system can cope with such challenges and still<br />
sustain the farmer and his family?<br />
21
4. The System of Rice Intensification (<strong>SRI</strong>)<br />
RPF might identify an optional and possible ideal rice based farming system within the newly<br />
developed concept; System of Rice Intensification (<strong>SRI</strong>) which is ground to heavy discussion<br />
throughout the world due to its opposing views on rice farming.<br />
4.1. The history of <strong>SRI</strong><br />
<strong>SRI</strong> was developed by a French Jesuit priest, Father Henri de Laulanie, in Madagascar in 1983, who<br />
during a persistent drought noticed a good growth of the rice plants (Stoop et al., 2002). De<br />
Launanie continued with the idea, and developed a farming system with few external inputs to<br />
benefit poor farmers and at the same time an environmentally friendly system (Satyanarayana et al.,<br />
2007). Laulanie formed the NGO, Association Tefy Saina (ATS), to supervise and support <strong>SRI</strong> in<br />
Madagascar and from country to country (Moser & Barrett, 2003).<br />
<strong>SRI</strong> seems to be a very potential method and as described by Mcdonald et al. (2006): “<strong>SRI</strong> satisfies<br />
the often conflicting objectives of agricultural development: tremendous grain yields with few<br />
external inputs”. The introduction of the green revolution led to modern technologies which<br />
required too high input costs for some RPF to cope with (Sinha & Talati, 2007) and here <strong>SRI</strong> might<br />
represent an alternative low input cost method accessible for poor farmers.<br />
Cultivating plants often follow the equation G x E (Genotype x Environment) i.e. plants are results<br />
of the genotype and the environment they are grown in (Satyanarayana et al., 2007) and highly<br />
influenced by the management practices as well. <strong>SRI</strong> focuses more or less on changing the<br />
environment such as soil, water and nutrient management for any given genotype (Satyanarayana et<br />
al., 2007).<br />
4.2 The concepts of <strong>SRI</strong><br />
Laulanie (1993) developed the <strong>SRI</strong> concepts during the 1980’s and concentrated on two major<br />
issues:<br />
• As little irrigation as possible and non flooded fields to obtain a higher air flow to the soil<br />
and roots.<br />
22
• The use of young seedlings transplanted one by one with wider spacing than normally<br />
(25cm x 25cm minimum).<br />
Laulanie (1993) further states that these two concepts define <strong>SRI</strong> but other techniques have been<br />
and are used by <strong>SRI</strong> practising farmers to ensure and increase the potential benefits of <strong>SRI</strong>. More<br />
concepts and techniques have through the years been identified and correlated with <strong>SRI</strong>. According<br />
to Sheehy et al. (2004) a new and modernised <strong>SRI</strong> technology could be characterized as:<br />
1. Use of young seedlings being app. 8-12 days old per hill with a minimum distance of 25 cm<br />
x 25 cm.<br />
2. Regular hand weeding.<br />
3. Irrigation is managed on a daily basis in order to maintain a wet but not flooded soil in the<br />
vegetative stage. During the panicle stage the fields are flooded with 1-2 cm of water and<br />
10-15 days before harvest time the fields are drained.<br />
4. Application of compost or organic residues in big quantities. If this is not possible or non<br />
present then no application should be chosen or an application of mineral fertilizers.<br />
Figure 3 illustrates how a <strong>SRI</strong> field could look like.<br />
Figure 3. Newly transplanted <strong>SRI</strong> fields.<br />
The use of composts is not due to organic concepts. <strong>SRI</strong> uses composts and natural fertilizers<br />
produced locally because chemical fertilizers would be too costly for RPFs (Stoop et al., 2002).<br />
Initially the first steps of <strong>SRI</strong> in Madagascar were based on chemical fertilizer applications, but then<br />
23
the Madagascan government stopped the subsidies for chemical fertilizers and farmers had to seek<br />
new alternatives and the use of compost hence became more important (Satyanarayana et al., 2007).<br />
It should be notified that <strong>SRI</strong> should not be regarded as a fixed system, but one that will differ<br />
between countries and regions because it depends on the agro-ecological characteristics in a given<br />
area (Stoop & Kassam, 2005).<br />
The reason why less water is stressed to be so important is due to several reasons. Normally rice is<br />
categorised as being an aquatic plant due to its formation of aerenchyma cells in the roots under<br />
flooded conditions – but is not necessarily because rice will grow better under such conditions<br />
(Kabir, 2006) as there is no evidence that flooded conditions will result in better plant growth<br />
(Stoop et al., 2002). Dobermann (2004) however states that the reason why the rice plant developed<br />
the aerenchyma cells is due to its evolution from being native to wetlands because conditions were<br />
more favourable there with more nutrients and less competition. Continuous flooding is though<br />
believed to decrease root growth due to lack of oxygen (Satyanarayana et al., 2007). The idea of<br />
keeping soils just moist and not flooded will enhance a larger root growth making the rice plants<br />
more adapted to situations with water stress (Kabit & Uphoff, 2007) which are typical for rainfed<br />
lowland systems (Greenland, 1997; Javier, 1997) creating shortage of water for the plants (Seng et<br />
al., 1999). Lowland rainfed systems are discussed more in section 5.2 and 7.1. The use of younger<br />
seedlings is believed to result in an improved and larger root growth (Satyanarayana, 2004) which<br />
will take up more nutrients (Kabir, 2006) and hence improve growth and yield potential of the rice<br />
plant.<br />
4.3 The differences between <strong>SRI</strong> and a traditional/conventional rice system<br />
There are large differences between <strong>SRI</strong> and traditional/conventional rice production methods.<br />
Table 1 below illustrates these variations where especially the amount of seeds needed per ha and<br />
age of seedlings are some of the major differences.<br />
24
Table 1. The major differences between <strong>SRI</strong> and conventional rice production methods. Taken from Stoop et al.<br />
(2002).<br />
There are however large disputes concerning <strong>SRI</strong> and its successes with farmers as there are many<br />
pros and cons. Supporters claim that <strong>SRI</strong> often yield the double of conventional rice farming, but<br />
opponents state that there is no scientific evidence for such potentials (Surridge, 2004). There are<br />
however many experiments which illustrate the benefits of <strong>SRI</strong> and those that illustrates that there is<br />
no difference between <strong>SRI</strong> and conventional rice growing. Very high yields have been reported<br />
with <strong>SRI</strong> as compared to traditional farming or farmers practice. Table 2 below illustrates some of<br />
the reported high yielding situations from rice growing countries.<br />
Table 2. <strong>SRI</strong> vs. farmer practice yields.<br />
<strong>SRI</strong> (t/ha) Conventional - Farmer Practice (t/ha) Specifications Country Reference<br />
7,4 2,5 N = 10 Gambia Caesay (2002)<br />
5,3 2,5<br />
N = 8 groups of 20<br />
farmers.<br />
Sierre Leone Yamah (2002)<br />
7-15 Madagascar Stoop et al., (2002)<br />
6,5 2,08 Myanmar Kabir & Uphoff (2007)<br />
2.3 1,6 N = 500 Cambodia Anthofer (2004)<br />
Such yields as described above are though according Dobermann (2004) not scientifically reliable<br />
and non comparable to conventional rice growing. Dobermann (2004) further states that in many<br />
experiments where <strong>SRI</strong> is compared to conventional farming a scientific methodology has not been<br />
followed and it is therefore very difficult to compare the two systems. McDonald et al., (2006)<br />
compared and compiled data from yields between <strong>SRI</strong> and conventional rice growing in China,<br />
Laos, Nepal, Thailand, India, Sri Lanka, Indonesia, Bangladesh, and the Philippines and found that<br />
in a majority of these countries <strong>SRI</strong> provided lower yields than conventional growing. Sheehy et al.<br />
(2004) compared <strong>SRI</strong> with conventional grown rice at three sites in China regarding grain yield,<br />
number of panicles, spikelets per panicle, grain filling and grain weight and found no difference<br />
between the two methods. Sheehy et al. (2004) further states that the very high reported yields from<br />
Madagascar are not possible and are due to measurement errors.<br />
25
4.4 Difficulties associated with <strong>SRI</strong><br />
Farmers often only follow a few of the steps of the <strong>SRI</strong> concepts and leave out the other concepts<br />
which make <strong>SRI</strong> difficult to compare within a given area to another area (Sinha & Talati, 2007).<br />
Moser & Barrett (2003) reports that the very high yields observed around the world are due to<br />
farmers managing all the concepts of <strong>SRI</strong> and using them together. But <strong>SRI</strong> is not always easy for<br />
farmers to adopt which as stated by Sinha & Talati (2007) could be prescribed three main factors:<br />
1. “Lack of irrigation facilities” (Sinha & Talati, 2007)<br />
2. “Absence of sound on-farm water management due to poor infrastructure and technology” (Sinha<br />
& Talati, 2007)<br />
3. “Lack of expertise and risk-taking ability among farmers. In rainfed areas it is difficult to adopt<br />
<strong>SRI</strong> if there is no facility available for protective irrigation, in the event of monsoon failure. On<br />
the contrary, too much rain also makes it difficult to drain the fields“. (Sinha & Talati, 2007)<br />
Management and minimization of water are often the most difficult steps for farmers to reach and<br />
understand (Moser & Barrett, 2003). Furthermore the success of <strong>SRI</strong> depends on land levelling<br />
which can be costly and applying <strong>SRI</strong> on large fields seems therefore more ideal than on small<br />
fields (Moser & Barrett, 2003) which then might leave out small scale farmers.<br />
<strong>SRI</strong> can be characterised as a LEISA (Low External Input Sustainable Agriculture) system where<br />
high labour inputs are often necessary (Moser & Barrett, 2003) which is one of the many<br />
weaknesses appointed by many authors (e.g. Moser & Barrett, 2003; Dobermann, 2004). Other<br />
identified constraints are the access and availability of organic materials and the labour involved in<br />
transporting and applying it (Dobermann, 2004).<br />
Koma (2007) though reports that it is not all <strong>SRI</strong> farmers in Cambodia who manage all the steps of<br />
the <strong>SRI</strong> concepts but even when only managing some of the factors involved in <strong>SRI</strong> they are still<br />
able to increase their yield per hectare and a reduction in the amount of seeds used.<br />
5. Rice in Cambodia<br />
5.1 The history of rice in Cambodia<br />
Rice is grown throughout the world in various ways depending on climate and soil and is the major<br />
food source for millions of people. In Cambodia rice has been cultivated since before the 8 th century<br />
(Mak, 2001) and is still a very important crop in Cambodia. Table 3 summarizes the fate of rice in<br />
26
Cambodia during modern times. In 1940 Cambodia was the third largest exporting country of rice<br />
in the world (Tong et al., 2007) and still during the 1960ies Cambodia was a leading partner in rice<br />
production in the world and continued to be so for many years (Koma, 2008) but civil wars later<br />
blocked any further development (Tong et al., 2007).<br />
Table 3. Average rice production, harvested area and<br />
rice yield in Cambodia from 1961 to 2006. Derived from IRRI (2006).<br />
Year Area (ha) Production (t) Yield (t/ha)<br />
1963 2.182.000 2.383.000 1.09<br />
2006 2.516.000 1 6.264.000 2.49<br />
1 According to Koma (2008) the total grown area in Cambodia with rice is app. 3.1 million ha with a<br />
potential of total agricultural production of app. 6.7 million ha.<br />
5.2 Rice cropping systems<br />
In Cambodia rice based farming systems often include lowland rice, dry season rice and early wet<br />
season rice (Mak, 2001), depending on location and access to water. The main rice cropping<br />
systems vary a lot especially regarding the water table. Figure 4 highlights the difference in water<br />
depth. The different rice cropping systems can be characterized as the following:<br />
• Upland rice or dryland rice: grown without water, normally related to areas with shifting<br />
cultivation (Greenland, 1997). Upland rice can often be intercropped with e.g. cassava, but<br />
often severe weed problems occur (De Datta, 1987).<br />
• Irrigated rice: The water table in the field can be controlled through the use of river/stream<br />
water and several rice crops are possible per year although sometimes drought is existing<br />
(Greenland, 1997).<br />
• Rainfed lowland rice: Dikes are build to catch both flood or rain water and the rice is often<br />
transplanted to the fields although also direct seeding sometimes dry or wet is existing (De<br />
Datta, 1987). Periods with drought can exist (Greenland, 1997).<br />
• Deepwater rice: 51 -100 cm water table normally grown in e.g. swampy areas in deltas (De<br />
Datta, 1987). Water regimes cannot be controlled and there are large risks of either drought<br />
damage or sudden flooding as seeds are sown on dry soil (De Datta, 1987).<br />
27
• Floating rice: 1-6 m of water, modern rice varieties are not well adapted, seeds are sown<br />
before flooding (De Datta, 1987). The problems are similar to those found in deepwater rice.<br />
The yields are very different and according to Greenland (1997) a rough estimate of the rice yields<br />
from the different rice systems is in the following order:<br />
irrigated > flood/deepwater > rainfed > upland. This is though very variable depending on soil,<br />
climate and management.<br />
Figure 4. The different rice cropping system as a function of water depths and the importance (%) in the world’s<br />
total production of rice. De Datta (1987).<br />
These rice based farming systems in Cambodia often include various other supporting factors such<br />
as livestock raising, aquaculture, vegetable and fruit production (Mak, 2001). Most households in<br />
Cambodia possess around two to five ha of land and the majority of the total grown rice area in<br />
Cambodia is lowland rainfed rice (Tong et al., 2007). Most of this rice is managed with manually<br />
labour and it takes in average 60-70 people per ha to transplant rice seedlings (Tong et al., 2007).<br />
The majority of the rice in Cambodia (85%) is produced during the wet season with rainfed rice<br />
being the main cropping system and the remaining 15% is produced during the dry season under<br />
irrigated conditions (Koma, 2008). Wet season is the period between May and November (Javier,<br />
1997).<br />
28
Rainfed rice in Cambodia is often grown with water levels ranging from 0 to 25 cm and in some<br />
situations after e.g. floods even more (Javier, 1997). During some periods of the cropping season<br />
for rainfed rice the soil might not be covered with water and aerobic conditions will be present due<br />
to little or no rainfall (Javier, 1997).<br />
Characteristic for rainfed lowland rice systems is typically that the possibility of drainage is often<br />
non-existing or only present to a small extent (Greenland, 1997) and the dependence on<br />
precipitation is enormous (Wade et al., 1999). Some of the main problems concerning rice yields<br />
from lowland rainfed rice systems are the time of rainfall, the amount of rainwater and low soil<br />
fertility (Pheav et al., 2005). As a consequence of the dependence on rainfall, water shortage is<br />
common (Seng et al., 1999). If the rainfall during the growing season is less than needed, this can<br />
lead to poor growth even if a given area receives enough precipitation throughout the year (Tsubo et<br />
al., 2007). As it is impossible to control the water level in the field for lowland rainfed rice<br />
systems, the rice crop will experience periods with total flooding and anaerobic conditions and<br />
other periods with drought which will have major influences on the availability of nutrients (Wade<br />
et al., 1998). Rice plants grown in this rice system are often tall (as submergence comes and goes<br />
very unpredictable) and have limited root growth and might not be able to take up enough water<br />
during drought periods (Wade et al., 1999). Due to the very changing water table weeds, insects<br />
and diseases are as well a major problem (Wade et al., 1999).<br />
5.3 <strong>SRI</strong> in Cambodia<br />
<strong>SRI</strong> was introduced to Cambodia in 2000 through various NGO based projects (Anthofer, 2004)<br />
and by 2003 approximately 10.000 farmers practised <strong>SRI</strong> and in 2004 50.000 farmers practised <strong>SRI</strong><br />
(Surridge, 2004). This number increased to 60.000 farmers in 2006 and in 2007 the number was<br />
approximately 80.000 farmers out of approximately 1.8 million rice farmers in Cambodia (Koma,<br />
2007). As a result of this development the Cambodian government has now adopted the <strong>SRI</strong><br />
methodology in their National Development Plan for 2006 to 2010 (Koma, 2007). CEDAC has<br />
been one of the leading agencies spreading and providing extension for <strong>SRI</strong> throughout Cambodia.<br />
29
6. Development Paradigms 4<br />
What is the most sustainable way of implementing a development project? And in what ways<br />
should the extension services of a given project be operated in order to secure long term<br />
sustainability of a given implementation strategy? This chapter evaluates some brief history on<br />
development strategies and focuses on the use of local knowledge and resources in order to<br />
implement a project. This chapter is intended in order to assess how <strong>SRI</strong> is introduced to farmers<br />
and if it is sustainable in the long run.<br />
6.1 Development strategies<br />
When “developing” or influencing a target area there will always exist local knowledge which can<br />
be included in a project on various levels. Local knowledge representing farmers (Blaikie et al.<br />
1997) or also defined as Rural Peoples Knowledge (RPK) have often been denied and not involved<br />
in any decision making in development designs (Scoones & Thompson, 1994). The concept of<br />
Transfer of Technology (TOT) has often been used in the past as a way of combining scientific<br />
research with extension to end up with farmers (Röling, 1994). Technology has been passed on to<br />
farmers who have not been involved throughout the process (Röling, 1994) thus making TOT a very<br />
top-down system. Often involving a large hierarchy and the extension system of Training and Visit<br />
(T&V). One reaction to TOT has been to introduce Farmer Field Schools (FFS). FFS concentrates<br />
on improving social learning though small group units and experimentation and does not rely so<br />
much on top-down extension support (Tripp et al., 2005). The FFS concept was introduced after<br />
the initiation of the Green Revolution and a heavy use of insecticides in paddy rice production in<br />
Asia as a more environmental friendly farming system (Tripp et al., 2005) and was first used in<br />
Indonesia in 1989 trying to introduce Integrated Pest Management (IPM) for rice production which<br />
would make farmers use less insecticides (Berg & Jiggins, 2007) as a corporation between the Food<br />
and Agriculture Organisation (FAO) within United Nations and the Indonesian Government (Röling<br />
& van de Fliert, 1994). The general idea behind the principles of FFS is that a small group of<br />
farmers will manage a field throughout a crop cycle (Tripp et al., 2005) and then learn from<br />
participatory learning and discovery. FFS concentrates on improving social learning though small<br />
group units and experimentation and does not rely so much on top-down extension support (Tripp et<br />
al., 2005).<br />
4 A paradigm is a set of thoughts and tools relating to decision-making in a development process in order to reach some<br />
given development assumptions and goals (Blaikie et al., 1997).<br />
30
In general there are three types of development strategies, the so called paradigms, which involve or<br />
do not involve RPK (Scoones & Thompson, 1994). Three paradigms used in the recent history of<br />
agricultural development can be identified according to Blaikie et al. (1997) as:<br />
• Classic paradigm – A top-down system where TOT is based on state research institutions<br />
and technological solutions related to development issues and passed to local populations<br />
through a long line of extension workers and researchers and does not involve local<br />
knowledge at any level in the procedure.<br />
• Neo-liberal paradigm – The tools for development already exist in the target area, and are<br />
based on local market forces. Local knowledge is accepted but is not involve to any large<br />
extent.<br />
• Neo-populist paradigm – Based on participatory learning and empowerment reached<br />
through mainly Farmer Participatory Research (FPR). This paradigm involves locals in<br />
decision making and problem solving. It is the opposite of the classic paradigm as it is based<br />
on a bottom-up structure and the farmer-first concepts where farmers are involved in the<br />
entire development process (Scoones & Thompson, 1994).<br />
Pretty et al (2003) identifies three ways of conducting agricultural development through increasing<br />
one of the following situations: 1) total agricultural area in a country, 2) yield per hectare<br />
(industrializing) and 3) total farm productivity. <strong>SRI</strong> seems to belong to the Neo-Populist paradigm<br />
which fits very well with Pretty et al. (2003) scenario 3 focusing on using the local resources to<br />
increase productivity.<br />
6.3 Sustainability in rural livelihood strategies<br />
When introducing a method into a given community it will affect the livelihoods of the involved<br />
persons in many different ways and it can influence the already existing sustainability. This section<br />
briefly introduces livelihood strategies often used by RPF.<br />
Sustainability can be defined in multiple ways depending on location, participants, conditions and<br />
many other factors. Regarding sustainable agricultural systems Pretty (2000) defines it as being<br />
31
systems who “..tend to have a positive effect on natural, social and human capital whilst also<br />
producing food, fibre, oil etc.” Relating to subsistence farming Greenland (1997) comes up with a<br />
more broad definition of a farming system’s sustainability as one being able to sustain the involved<br />
people and produce enough food and if a given farming system cannot sustain the involved people<br />
they will shift to another “more” sustainable one.<br />
Farming practices are one way of distinguishing different farming systems and comparing them and<br />
their sustainability. Pretty (2000) states that a farming system which “..sequesters carbon in soils<br />
through organic matter accumulation both contributes to the global good by mediating climate<br />
change and the private good by enhancing soil health” could be termed sustainable.<br />
Such sustainability for a given livelihood can however be difficult to measure and assess.<br />
Livelihood resources can in general be split into four categories named capitals which all connect to<br />
the sustainability of a system according to Scoones (1998):<br />
• Natural: natural resources such as e.g. soil, water and environment.<br />
• Economic: e.g. amount of financial means, infrastructure and production technologies<br />
• Human: e.g. knowledge and skills<br />
• Social: e.g. social networks, groups and relations amongst people<br />
These different components of the four capitals are often combined into three different livelihood<br />
strategies which can be defined as (Scoones, 1998):<br />
• Agricultural intensification/extension – based on capital resources, labour intensification,<br />
initiatives and as well initiation by policy makers<br />
• Livelihood diversification – adapting other livelihood strategies and increasing the sources<br />
of income<br />
• Migration – voluntary/involuntary migration in order to cope with a given situation<br />
These different strategies are often combined in different ways for rural people and are termed<br />
Livelihood Portfolio which can either be very focussed on few activities or a broader range which<br />
often have evolved over some time as a response to various choices made over time (also termed<br />
livelihood pathways) (Scoones, 1998).<br />
32
7. Study and experimental implementation site<br />
This study is targeting RFP in Cambodia’s south eastern province, Prey Veng bordering Vietnam to<br />
the north and south, Svay Rieng province to the east and Kandal province to the west with special<br />
focus on Kanhchriech district in the north eastern part of Prey Veng province. See figure 5 below<br />
for more details.<br />
The present study is part of a larger project by the Danish organisation NORDECO, the Danish<br />
organic dairy Oellingegaard and the local Cambodian NGO CEDAC who together are<br />
implementing the ILFARM project (Improved Livelihood of Small Farmers) in three communes in<br />
Kanhchriech district in Prey Veng province.<br />
The focus is on improving livelihoods through sustainable agriculture with special attention to rice<br />
cropping systems and changing agricultural techniques to <strong>SRI</strong> based systems with low dependency<br />
to CO2 input criteria and possibilities of storing C in the soils and reducing GHGs through the <strong>SRI</strong><br />
concept (NORDECO, 2008). The ILFARM project involves 800 agricultural occupying households<br />
in the three communes in Kanhchriech district, for agricultural activities for three years. 500.000<br />
trees are planted on homestead lands and near rice fields in order to increase the production of green<br />
manure (CEDAC, 2008c).<br />
7.1 Prey Veng province<br />
The rice farming system in Prey Veng can be described as shallow water wet season rice (SCW,<br />
2006) or it can also be termed a more general term, rainfed lowland rice (Nesbitt & Phaloeun,<br />
1997).<br />
33
Figure 5. Map of South East Asia and Cambodia with the red arrow directing to Prey Veng province. Derived<br />
form: http://upload.wikimedia.org/wikipedia/commons/7/70/Cambodian-provinces-bgn.png<br />
The target area of the present study in Prey Veng is located on old alluvial – colluvial plains which<br />
mostly are flooded by rainwater in the growing season (White & Öberthür, 1997). There are only in<br />
very few occasions second rice crops during the dry season in Prey Veng. The level of water<br />
management is rather low as irrigation and channels are almost not present. Farmers are able to<br />
lower the water table but not to increase it. 50-75 % of the population in the target area in<br />
Kanhchriech district are considered poor (SCW, 2006) and depend on agriculture as their main<br />
source of income.<br />
7.2 Climatic conditions<br />
The main rice growing areas in Cambodia are located in the regions with rainfall ranging from 1250<br />
mm to 1750 mm which are mainly found in the south and south eastern parts of Cambodia (Nesbitt<br />
& Phaloeun, 1997). Such precipitation patterns would normally provide a successful system for<br />
34
growing rice but the Cambodian rains are unpredictable and do not follow any regular pattern, and<br />
may be very delayed causing drought in the middle of the wet season and sometimes flooding<br />
(Nesbitt & Phaloeun, 1997).<br />
The Cambodian climate stretches over two seasons, a wet and a dry season with the wet season<br />
running from May till November and the dry season from mid November till the end of Aprilbeginning<br />
of May (Nesbitt, 1997). The dry season often stretches for less than four months in Prey<br />
Veng province (SCW, 2006). Table 4 illustrates the climate in Phnom Penn which is somewhat very<br />
similar to the climate in Prey Veng.<br />
Prey Veng province has an annual average temperature of 27.23 o C and annual average<br />
precipitation of 1599 mm (SCW, 2006). As a result Prey Veng is one of the driest and warmest<br />
provinces of Cambodia with a growth potential being characterized as a medium concerning rice<br />
production (SCW, 2006).<br />
Table 4. Climatic data from 1995, Phnom Penn. Modified after Nesbitt (1997).<br />
8. Materials and methods<br />
Climate factors 1995 data, Phnom Penn<br />
Relative humidity % 60 – 80<br />
Temperature ( 0 C ) 22 – 40<br />
Day length (hours) 11.5 – 13.2<br />
Evaporation (mm) 120 – 260<br />
30 farmers conducting <strong>SRI</strong> within the ILFARM project in two communes Chorng Om Pil and<br />
Kdeuon Reay Kanhchriech district, Prey Veng province were identified by computing a stratified<br />
random sampling. The project villages located closets to Prey Veng city (where the ILFARM<br />
project is managed from) were chosen and in total were 8 villages chosen. See figure 6 for location<br />
of the eight villages. The number of farmers involved within the project was different from village<br />
to village hence it was not possible to identify the same number in each village. The farmers were<br />
chosen randomly from a list comprising all farmers in the project available at the local CEDAC<br />
office. 30 farmers were chosen due to limitations of funding and time. 30 farmers do as well<br />
represent a fair sample of the total involved number of farmers in the project.<br />
35
15 farmers were chosen randomly from four villages in Chorng Om Pil commune and likewise 15<br />
farmers from four villages in Kdeuon Reay commune. Most farmers had one field where they<br />
conducted <strong>SRI</strong> but a few ones possessed several <strong>SRI</strong> fields. The smallest <strong>SRI</strong> field was always<br />
chosen in case of farmers having more than one field. If farmers were absent or non available in<br />
some way the farmer conducting <strong>SRI</strong> nearest to them in the village was chosen. See Appendix A for<br />
details on participating farmers.<br />
8.1 Soil sampling<br />
The farmers grow very different areas of <strong>SRI</strong> and their fields have very different shapes from one<br />
another and are very heterogeneous. The field sizes ranged from 10 m 2 to 2000 m 2 amongst the 30<br />
farmers. Often the water level is changing from spot to spot in the field and the growth of the rice<br />
plants is very different within a single field. The soil samples were all collected in the period 12 th to<br />
17 th of October 2008.<br />
19 subsamples forming a star shaped pattern were systematically identified for every field, see<br />
Appendix B for full description of the procedure. The 19 subsamples were mixed into one<br />
composite sample for every field. The top 20 cm of soil was collected with a stainless steel auger<br />
tube with each subsample consisting of 240 cm 3 soil incl. present stones and plant residues. As the<br />
fields were very heterogeneous the 19 star systems covered all areas of the field. It would also have<br />
been accessible to sample less than 19 subsamples for each field however the level of accuracy is<br />
increased with more subsamples.<br />
The collected soil samples were analyzed at the Environmental Analysis Laboratory (ENLAB) at<br />
the Preak Leap National School of Agriculture (PNSA) in Phnom Penn, Cambodia and at the<br />
department of Agriculture and Ecology, Faculty of Life Sciences, University of Copenhagen,<br />
Denmark with three parameters being determined: pH, C and N content.<br />
36
Figure 6. Map of the two target communes Choung Om Pil and Kdoun Reay with the four target villages in each circled with red. Grey stippled lines are<br />
commune borders. Modified from SCW (2005).<br />
37
8.1.2 pH<br />
pH was measured with an electrode pH meter (multi-meter) in a KCL solution with a 1:2:5 ratio.<br />
Measurements were made by the ENLAB, Cambodia.<br />
8.1.3 C and N<br />
Total C and N were first measured in Cambodia at the ENLAB by the following methods.<br />
C<br />
OM contents were identified with the Walkley-Black method comprising:<br />
- Reduction of potassium dichromate (K2Cr2O7) by organic carbon compounds<br />
- Determination of the reduced dichromate by oxidation-reduction titrates with ferrous<br />
ammonium sulphate. OM was converted to C% by multiplying with 58%.<br />
N<br />
Total Nitrogen was determined by the use of the Kjeldahl method comprising;<br />
- Digestion in concentrated H2SO4<br />
- Conversion from organic – N to NH4-N by steam distillation<br />
- Distillation was collected with boric acid<br />
- Titrated with H2SO4<br />
Soil samples were also brought to Denmark and were analysed at the Faculty of Life Sciences,<br />
University of Copenhagen in order to verify the results from Cambodia. C and N content was<br />
analyzed with Automated Nitrogen Carbon Analysis for Gas Solids and Liquids (ANCA-SL/GSL)<br />
which uses the theory of Dumas involving a stable isotope spectrometer. For further details please<br />
refer to SerCon Ltd (2001). The results from the analysis made in Denmark were used due to higher<br />
validity.<br />
8.2 Interviews<br />
30 farmers were questioned regarding their livelihood and agricultural practices. Please refer to<br />
ANNEX C for the questionnaire. The interviews were performed in Khmer by two field staff<br />
connected to the ILFARM project and then translated into English.<br />
38
The following main topics were examined within each household: household size, income sources,<br />
use of organic amendments, compost production, agricultural practices (traditional vs. <strong>SRI</strong>). This<br />
was done in order to identify their livelihood strategies.<br />
8.3 Statistical analyses<br />
All data analyses were carried out in Excel 2002 and in the statistical package “R” 2.8.1. Significant<br />
differences and correlations were tested between soil, household and rice yield data.<br />
9. Results and discussion<br />
9.1 Soil pH, Carbon and Nitrogen – the biophysical environment<br />
9.1.2 pH<br />
The average pH value for the soil was 4.53 and no significant difference was found from farmer to<br />
farmer or village to village. Such a low pH really illustrates how acidic the soils are of the target<br />
area and the surrounding area of Prey Veng. See appendix D for details on pH for every farmer.<br />
Normally the soil type of Prey Veng has a higher pH according to the CASC (Cambodian<br />
Agronomic Soil Classification System 5 ) of pH 5.4 (White et al., 2000). The given soil type in the<br />
target area and one of Cambodia’s most important rice soils is termed the Prateah Lang group<br />
(White et al., 1997) a Plinthustalf (Pheav et al., 2005) sandy loam. This low pH value indicates that<br />
the availability of nutrients and microbial activity are rather limited compared to an optimum pH of<br />
5.5-7.0 (Brady & Weil, 1999b). With a low pH there can be risks of Aluminium toxicity (Brady &<br />
Weil, 1999b) but this scope has not been a part of this project and has therefore not been examined.<br />
The potential of liming the acid soils with e.g. calcite (CaCO3) to increase pH (Brady & Weil,<br />
1999b) does not seem to be an option for the target farmers and farmers in general in Cambodia as<br />
such an investment would most likely be too expensive for them.<br />
In general though as the flooding of rice field takes place the pH will turn towards neutrality and<br />
can change the pH of the soil with 0.5 to 2 pH units all depending on the acidity prior to flooding<br />
5 CASC was developed by CIAP (Cambodia-IRRI-Australia-Project) in the 1990ies within a very large agricultural<br />
project for several years by Cambodian and international experts in order to develop an easy to use and applicable<br />
system to use for farmers and technicians in order to key soils and set up management methods (White et al., 2000).<br />
instead of an older but more complex system developed by Crocker in the early sixties (Oberthür et al., 2000).<br />
39
(Street & Bollich, 2003). De Datta (1987) mentions that this is due to the change of ”..ferric to<br />
ferrous iron, accumulation of ammonium, change of sulfate to sulphide, and change of carbon<br />
dioxide to methane under reducing conditions” De Datta (1987). When an acid soil is submerged,<br />
the changes of pH will depend on temperature and soil properties such as e.g. OM content and iron<br />
concentration (De Datta, 1987). The problem is that soils with low OM content will not reach pH 6<br />
even after several months of flooding (De Datta, 1987). Brady & Weil (1999b) though states that<br />
organic amendments such as farm manures and especially poultry manure and leaf residues can<br />
increase pH values. However in order to really have an increase, large amounts are probably<br />
needed which RPF will not have access to. As discussed later do most farmers have chickens on<br />
their homestead land from which they will use the chicken manures they can gather for composting<br />
– but the possible amounts are limited. Oberthür et al. (1997) state however that the pH for the<br />
given soil type in Prey Veng province is not problematic as flooding will increases the pH value.<br />
All soil samples were taken during the wet season, hence the fields were flooded (except a few<br />
spots in a few fields where there was no water as the fields were very uneven) and pH should then<br />
have been higher.<br />
9.1.3 C and N<br />
The total average % C and % N was 0.33% C + (-) 0.09 and 0.04 % N + (-) 0.008 respectively. No<br />
significant difference was found for C and N from village to village or from farmer to farmer. See<br />
Appendix D for detailed information for every involved farmer. The average C:N ratio is 7.1 + (-)<br />
0.72 with no significant difference between villages or farmers. White et al., (1997a) report that the<br />
Prateah Lang soil group has an average C:N ratio of 9,7. The difference of two units might be<br />
because the measured sampled size only consisted of 30 farmers and the C:N reported by White et<br />
al. (1997) covers a large area of 28% of Cambodia’s rice land. However both values are quite low.<br />
Assuming the plough layer is 15 cm deep and the bulk density is 1.0 g cm -3 (estimates are derived<br />
from Kundu & Ladha, 1999) a rough assumption of C and N content per ha is: 49,5t C ha -1 and 600<br />
kg N ha -1 respectively. It is very likely that the Soil C content of the given soil in Cambodia has<br />
been rather constant over the years. Assuming that the soils in the target area, like in most areas of<br />
Cambodia, have been cultivated for centuries and rice has been grown once a year the soil C has<br />
reached some sort of steady state. The inputs match the outputs thus creating a balance. In order to<br />
change this large amounts of organic materials are needed. These issues will be discussed later<br />
under section 9.5.<br />
40
White & Seng (1997) state that not only the Prateah Lang soil but also most other rice soils in<br />
Cambodia have a low CEC and organic C content hence making it difficult to preserve supplies of<br />
N, K and water in the soil.<br />
For RPF growing rice on the given sandy loam Prateah Lang Soil groups or similar lowland rainfed<br />
soils, applications of OM could change the C:N ratio. For instance will amendments with OM with<br />
C:N ratios of 25:1 or higher decrease the soil N content as micro organisms cannot locate enough N<br />
in the soil and they therefore will be forced to take up all the available N in the soil solution (Brady<br />
& Weil, 1999a). As the N content is so low in the Prateah Lang soil - the decomposition of OM<br />
might be slowed down as micro organisms cannot find enough quantities of N (Brady & Weil,<br />
1999a).<br />
It is well recognized that applications of organic inputs to lowland rice soils such as rice straw,<br />
animal manures, rice stubble and green manure can increase N content in soils (Kundu & Ladha,<br />
1999). It is estimated that 1t of dried rice grains will provide app. 1.5 t of rice straw which contains<br />
9 kg N and thereby a free nutrient source (Kundu & Ladha, 1999). Straw is however often removed<br />
in resource poor areas to use for animal fodder or burned in situ (Dobermann & Witt, 2000) which<br />
is also the case for the target farmers in this study. The stubble and the roots will however still be<br />
present in situ and is hence another source of N and other nutrients. Only few farmers use chemical<br />
fertilizers. Most of the chemical fertilizers used in Cambodia are used in irrigated rice systems<br />
(Nesbitt & Phaloeun, 1997).<br />
The rainfed lowland rice which is the most common rice cropping system in Cambodia - and in<br />
many other south Eastern Asian countries (Wade et al., 1999). The shift between anaerobic and<br />
aerobic conditions due to a fluctuating water table will lead to oxidation and reduction of the soil<br />
which can result in losses of gaseous N, other nutrients are immobilized and changes in pH (Wade<br />
et al., 1999). The very changing water table may give rise to losses of N – as drying of flooded rice<br />
fields result in large losses of N through nitrification and denitrification (Seng et al., 1999). The<br />
RPF not only in this study but in Cambodia and many other locations are kept in a difficult situation<br />
with the low soil fertility and few means of changing this.<br />
41
9.1.4 Soil description<br />
The Prateah Lang soil group found in the target area in Prey Veng and other places in Cambodia has<br />
a very limited O and A epipedon and most of the plough layer is composed of the E horizon and<br />
some 15 cm down there is a very hard structure like a hard pan making it very difficult to penetrate.<br />
According to a soil key developed by the CIAP project the soils of identified in Prey Veng is a<br />
Prateah Lang soil group (White et al.1997b) as mentioned earlier. The soil factors identified such as<br />
pH, C and N contents fits very well as well with the description of the Prateah Lang soil (White et<br />
al., 1997a; White et al., 2000). SCW (2006) mentions the soils of Prey Veng are cultural<br />
hydromorphics. Oberthür et al. (1997) mentions that by using the keys to soil taxonomy by Soil<br />
Survey Staff from 1994, that the Prateah Lang soil group could be translated into belonging to the<br />
Alfisol soil order. Pheav et al. (2005) report that by using the soil Survey Staff (1994) the soil<br />
belongs to the soil subgroup Plinthustalf. Given the percentages of clay, silt and sand respectively<br />
the soil can by using the Soil Survey Staff’s (2006) soil key be characterized as a sandy loam.<br />
The texture as described in the table 5 is also in accordance with the CASC classification through<br />
personal observations in the target area.<br />
Table 5. The characteristics of the Prateah Lang soil type as described and developed by CASC.<br />
After Oberthür et al., (2000).<br />
CASC soil definition Clay % Silt % Sand % pH Organic C<br />
Prateah Lang 13,2 37 49,8 5,4 0,4<br />
The topsoil in the target area has a light texture with a little structure and low water holding<br />
capacity followed by more heavy subsoil according to White et al., (1997a). Hence drought is often<br />
a problem as mentioned before. When ploughing and harrowing it is necessary to transplant very<br />
short time after the procedure as soil particles will settle very fast (White et al., 1997a) thus making<br />
it difficult to transplant. Gravel is also common to find, CEC is very low, low OM content is found<br />
and rice yields are very low, ranging in average from 800 kg to 1400 kg per ha (White et al.,<br />
1997a). Figure 7 pictures the typical soil texture.<br />
Dobermann and White (1999) participated in the CIAP project and developed materials and<br />
strategies for nutrient management in rainfed and irrigated rice cropping systems. Modern varieties<br />
grown on Prateah Lang soils should receive NPK in the following rates 60:29:30 or 42:23:0 if the<br />
farmers do not apply any K (Dobermann & White, 1999). These values are for favourable<br />
42
conditions signifying little or no water shortage during the cropping season (Dobermann & White,<br />
1999).<br />
For unfavourable conditions implying water shortage for longer periods the recommended doses of<br />
NPK are 40:23:20 and 30:15:0 if farmers do not apply any K (Dobermann & White, 1999). The<br />
latter condition is probably the most common for the target area as droughts are quite common and<br />
water management is limited as irrigation systems are limited. RPF do however often not have the<br />
means to apply chemical fertilizers and the recommended rates would then have to be applied<br />
through organic inputs, which would require very large amounts. The means of applying organic<br />
amendments will be discussed in chapter 9.5 and 9.5<br />
Figure 7. Typical soil texture in the target area.<br />
43
9.2. Identified Livelihood strategies<br />
The identified livelihood strategies of the study could be classified as agricultural intensification<br />
and livelihood diversification as described by Scoones (1998). Their differences and importance is<br />
discussed within this chapter and the rest of the discussion.<br />
The interviewed farmers consisted of 50% males and 50% females with an average age of 42 years<br />
and with 4 household members in average. These findings correspond well with CEDAC’s results<br />
from their baseline study 6 in the summer of 2008 (CEDAC, 2008a). See Appendix E for further<br />
details. The total income is very different from household to household ranging from 98$ to 2927$<br />
per year.<br />
The income is what is left to sell after a household has consumed rice and agricultural products. The<br />
households with higher income mostly have several members working outside the farm selling<br />
labour or working as community/village chiefs. One farmer and his family makes 98$ per year<br />
which is the lowest amongst the 30 interviewed farmers and even compared to a national scale but<br />
the income comprise all the goods and farm products sold after what has been consumed at farm<br />
level. The variation is large as illustrated in figure 8 below. Raising cattle/pigs results in the highest<br />
income followed by working outside the farm and then selling rice. It is however only 57% of the<br />
interviewed farmers who have cattle and 37 % who have pigs. Animals can be regarded as a wealth<br />
indicator as they provide security in times of hardship and they provide manure. Nesbitt & Phaloeun<br />
(1997) mention that most of the farming households in Cambodia mostly have a few domestic<br />
animals. Chickens and ducks (eggs and meat) are used for self consumption and pigs and cattle as<br />
an important cash income possibility (Nesbitt & Phaloeun, 1997).<br />
6 CEDAC conducted a baseline survey in the summer of 2008 in the three target communes of the ILFARM project and<br />
interviewed 451 randomly chosen farmers where 376 farmers where participating in the project (CEDAC, 2008a). This<br />
baseline survey is the background and assistant paper on many of the agricultural findings within this paper.<br />
44
Riel<br />
3000000<br />
2800000<br />
2600000<br />
2400000<br />
2200000<br />
2000000<br />
1800000<br />
1600000<br />
1400000<br />
1200000<br />
1000000<br />
800000<br />
600000<br />
400000<br />
200000<br />
0<br />
Income sources<br />
Rice Vegetables Chicken / duck raising<br />
Categories<br />
Cattle / pig raising Other<br />
Figure 8 illustrating different sources of income. The category “other” is work outside the farm such as<br />
construction worker, village leader, seller, fishing and in general selling labour. 4000 riel = 1$.<br />
The income from rice is rather low which is due to the fact that farmers often consume their rice<br />
and if something is left it is sold. Hence in order to be able to afford investments of any kind for<br />
their household they rely mostly on their income from animal husbandry and off-farm work. Some<br />
families will however prefer to sell rice even if they are not subsistent and hence lack rice for<br />
several months a year. According to CEDAC (2008a) 26% of the households in the target area do<br />
not have enough rice to consume for several months every year. Within this percentage a majority<br />
of households lack rice for two to five months every year, often before the beginning of the rice<br />
season (CEDAC, 2008a).<br />
No correlation was found between sex, income, age and <strong>SRI</strong> yield. The sole correlation identified<br />
was a ‘*’ R 2 = 0.158 correlation between number of household members and income which is not<br />
surprising as many family members provide essential labour in the family farm, and contribute to<br />
the family economy with off-farm work. Figure 9 illustrates the correlation between household size<br />
and income.<br />
45
Income ($)<br />
3500<br />
3000<br />
2500<br />
2000<br />
1500<br />
1000<br />
500<br />
0<br />
Correlation between # of household members and income<br />
y = 147,05x - 3,9005<br />
R 2 0 1 2 3 4 5 6 7 8 9<br />
= 0,158<br />
N of household members<br />
Figure 9. The correlation between the number of household members and income.<br />
Typical off-farm work is as construction worker and motor bike taxi driver which are very typical<br />
jobs found in many areas of Cambodia. To work off-farm is part of the livelihood strategy<br />
“livelihood diversification” which seeks to reduce the risks of stresses or shocks by spreading the<br />
income sources of the household (Scoones, 1998). Risks/stress could in this study e.g. relate to<br />
severe droughts causing a very low rice yield and outbreaks of pests and diseases.<br />
Provided these informations on household income the question arises on which livelihood strategy<br />
is the most important for these RPF and many others in a similar situation. Figure 10 illustrates the<br />
various income sources for each of the 30 interviewed households. For a majority of the households<br />
the income from other sources (off-farm work – mostly selling labour, construction worker,<br />
motorbike driver) is a rather important source of income for the households. This livelihood<br />
strategy is as mentioned before livelihood diversification.<br />
The other livelihood strategy agriculture intensification/extensification provides the rest of the<br />
income but most of the production from this strategy is consumed at home. This livelihood strategy<br />
can be used in two ways roughly as mentioned by Scoones (1998):<br />
• Intensification – the outcome per unit of land is increased through extra input of labour or<br />
financial means.<br />
• Extensification – produce more output from more land<br />
46
The involved farmers seem to belong to the strategy category of intensification as a majority of<br />
them have sustained themselves from the same pieces of land through ages. In order to succeed<br />
within this strategy they are therefore very dependant on additional financial income from the<br />
diversification strategy in order to be sustainable. It is likely for the involved farmers and many<br />
other RPF that if land prices will increase in the future the extensification strategy is left out as land<br />
prices will be too expensive and intensification is the only mean of survival. If such a scenario<br />
would take place the migration livelihood strategy described by Scoones (1998) might become<br />
more important than it is today.<br />
Annual income per household (riel)<br />
14000000<br />
12000000<br />
10000000<br />
8000000<br />
6000000<br />
4000000<br />
2000000<br />
0<br />
1 2 3 4 5 6 7 8 9 101112131415161718192021222324252627282930<br />
Farmers<br />
Figure 10. Annual income per household. The category “Other” covers off-farm work<br />
Other<br />
Cattle pig<br />
Chicken<br />
and duck<br />
Income<br />
Vegetable<br />
s<br />
Income<br />
Rice<br />
9.3. Household assets<br />
The average size of conventional grown rice land including the land surrounding the homestead and<br />
present vegetable gardens was 16766 m 2 + (-) 8926 and average <strong>SRI</strong> land was 534 m 2 + (-) 558. See<br />
Appendix E for all livelihood assets discussed in this and the following chapters. The vegetable<br />
production often takes place on the homestead land but production is not large enough to provide<br />
households with enough vegetables (CEDAC, 2008a). The possessions of land can be regarded as a<br />
wealth indicator. Which is also the case for the domestic animals (Nesbitt & Phaloeun, 1997; SCW,<br />
2006) in times of difficulties especially buffaloes and cattle provide the household with security in<br />
terms of illness or sudden expenses (SCW, 2006). Most families have either a few cows or<br />
47
uffaloes, which are very important as draft power (SCW, 2006). Other domestic animals include,<br />
chickens, ducks, pigs and fish. Chickens and ducks are normally for home consumption (CEDAC,<br />
2008a) while pigs and fish are sold for additional income.<br />
9.4. Compost production<br />
24 farmers make their own compost but only 16 of them use the compost for the rice fields. This<br />
would imply that the rest of the farmers use the compost for vegetable production or to produce rice<br />
seedlings in a nursery which is quite common practice for Cambodian farmers (CEDAC, 2008a).<br />
Composts are located on the homestead land and the distances to the different fields vary a lot, but<br />
are often quite large. Figure 11 illustrates the different types of composts produced by farmers.<br />
Figure 12 pictures typical compost huts and compost piles found in the target area. The most<br />
common compost mix was: animal manure from mostly cows/buffaloes + chickens, crop residues<br />
(small amounts of rice straw), leaves, ash and general waste 7 . Rice straw is often used as livestock<br />
fodder during the dry season and is stored in large piles on the homestead land. The remainings of<br />
the rice plants on the fields is often burned or incorporated in the soil. Human waste is used for fish<br />
raising and toilets are often constructed near or over fish ponds and is therefore not an option<br />
farmers can use for rice fertilizers.<br />
N of farmers<br />
10<br />
9<br />
8<br />
7<br />
6<br />
5<br />
4<br />
3<br />
2<br />
1<br />
0<br />
3<br />
Animal<br />
manure, crop<br />
residues,<br />
kitchen<br />
residues,<br />
leaves<br />
Compost production and number of involved farmers<br />
1<br />
Animal<br />
manure, crop<br />
residues,<br />
kitchen<br />
residues,<br />
leaves and<br />
hay<br />
5<br />
Animal<br />
manure, crop<br />
residues,<br />
leaves<br />
9<br />
Animal<br />
manure, crop<br />
residues,<br />
leaves and<br />
other<br />
materials<br />
4<br />
Animal<br />
manure,<br />
leaves and<br />
other<br />
materials<br />
1 1<br />
Animal<br />
manure and<br />
leaves<br />
Animal<br />
manure<br />
Figure 11. Number of farmers producing compost with different components. Other<br />
materials include hay, ash and waste but differs from farmer to farmer. Leaves are in a<br />
majority of cases often from Sesbania, Leucaena and Neem trees.<br />
7 Waste does not include human waste but is a general definition for household waste of any kind.<br />
48
The farmers’ composts were often found in sizes ranging from 6-9 m 3 and located very close to the<br />
house on the homestead land. In a few cases a small hut or roof was constructed in order to protect<br />
the compost from rains and high temperatures. A majority of farmers were certain that they could<br />
produce more compost than they needed for one growing season. The farmers stated that to produce<br />
around 6-9m 3 of compost would in general take them two to three months. The question is however<br />
if they will have enough biomass and of a high enough quality? CEDAC (2008b) suggests that in<br />
areas with scarce resources for compost production a shift to biomass production could be used to<br />
increase soil fertility, such as e.g. green manure crops in the beginning of the wet season.<br />
Figure 12 illustrating a typical compost hut and a compost pile.<br />
9.5. Application of amendments<br />
73% and 53% the farmers applied green manure 8 (GM) and compost to their <strong>SRI</strong> fields respectively<br />
while 40% of farmers applied both green manure and composts. No correlation was found between<br />
the different kinds of fertilizers and the C and N content in the soil which is not surprising as only<br />
long term experiments can identify such correlations. See Appendix E for details on application<br />
rates. Average application rates for green manure and compost were 200 kg +(-) 188 and 303 kg +(-<br />
) 195 respectively per field size of 534 m 2 . Average application rates per m 2 were 0.33 kg and 1.90<br />
kg for compost and green manure respectively. Table 6 illustrates compost applications from other<br />
<strong>SRI</strong> growing areas.<br />
8 Green manure is often related to trees and shrubs where leaves are used as fertilizers or cover crops and nitrogen<br />
fixing species are also used. In this case green manure refers to leaf manures from Leucaena, Sesban and Neem.<br />
49
Table 6 illustrating five trials from four countries where different amounts of composts are applied. * The<br />
reported application of compost was for one single very successful farmer with a yield of 21 t/ha.<br />
Compost t/ha Compost kg/m2 Details Location Reference<br />
7 t/ha 0,70<br />
60 % cow + goat<br />
manure, 35%<br />
leguminous<br />
vegetation and<br />
5% ash<br />
West Java, Indonesia<br />
10 t/ha 1,00 Madagascar<br />
2 – 3 t/ha 0,2 – 0,3<br />
12 t/ha 1,20<br />
Organic manure<br />
mixed with cow<br />
dung and straw.<br />
Chemical<br />
fertilizers were<br />
also applied.<br />
Cow manure and<br />
straw. Contains<br />
4.6 g kg-1 total N.<br />
Chemical<br />
fertilizers were<br />
also applied.<br />
Haden et al.,<br />
(2007)<br />
Uphoff & Tefy<br />
Saina.<br />
Bangladesh Latif et al., (2005)<br />
Mozambique<br />
Menete et al.,<br />
(2008)<br />
5 t/13 acres* 4 Madagascar Uphoff, 1999.<br />
An application rate of 0.33 kg m -2 corresponds to 3.3 t ha -1 which is similar to the applications from<br />
Bangladesh listed in Table 6 above. However the composts above do to a large extent consists of<br />
large quantities of animal manure which the composts in Cambodia only comprise to a small extent.<br />
Thus there is a difference in quality and nutrient content. Latif et al. (2005) report that composts in<br />
Bangladesh had the following percentages of N, P and K: N (1,67%), P (0,83%) and K (1,66%)<br />
(Latif et al. 2005). No nutrient measurements were taken from the composts in Cambodia but it is<br />
likely that the contents are lower as composts mostly consist of plant material.<br />
CEDAC (2008a) states that during their baseline study, 98% of interviewed farmers used chemical<br />
fertilizers during the last year (2007) with an average amount of 180 kg. However during this<br />
report’s investigation in the area, only 13% used chemical fertilizers but in very small amounts.<br />
Chemical fertilizers are not “officially” a part of <strong>SRI</strong> (Stoop et al., 2002) but can very well be used<br />
if no organic matter or too little is available (Satyanarayana et al., 2007; Sheehy et al., 2004). The<br />
farmers might have told the author and CEDAC what they thought they had to say, i.e. that they<br />
only use composts and thus in reality more of the farmers probably still use small quantities of<br />
50
chemical fertilizers. It is part of the ILFARM project to inspire farmers to use more composts for<br />
those who use chemical fertilizers and thus reducing the chemical fertiliser consumption (CEDAC,<br />
2008c) and farmers do perhaps therefore not dare to say that they still use some chemical fertilizers<br />
as they have an interest in receiving extension services from CEDAC.<br />
Given that the sample size for this report was 30 households and the baseline study involved 451<br />
households (CEDAC, 2008a) the large reduction in chemical fertilizer use identified in the present<br />
study might have resulted from a skewed picture due to the sample size.<br />
The access and amount of biomass might pose problems upon extending <strong>SRI</strong> to larger areas.<br />
Dobermann (2004) states that a major constraint with <strong>SRI</strong> is the labour input needed to transport<br />
and apply organic materials to the fields. Bunch (2002) reports that upon a visit in Madagascar <strong>SRI</strong><br />
farmers spent up to l00 labour days collecting organic materials and applying them to their fields. In<br />
the area of Prey Veng access to organic material is scarce as all straw is removed in order to use as<br />
animal fodder. Anthofer (2004) found from <strong>SRI</strong> trials in Cambodia that farmers would conduct <strong>SRI</strong><br />
on the nearest field to the homestead land. This would imply that the load and transport of compost<br />
and organic amendments is reduced. Considering the workload involved in transporting and<br />
producing composts it would indicate that farmers are forced to use many labour hours, and only<br />
larger households can afford to use labour on such a large scale.<br />
The use of GMs might therefore be a solution in order to increase the amount and the access to<br />
organic materials. GMs are however normally not considered to be used traditionally by Cambodian<br />
farmers but is in many cases introduced by organizations (Anthofer, 2004). However most of the<br />
interviewed households had several trees such as e.g. Neem and Sesbania which are common<br />
around homesteads in Cambodia (Author’s own observation, 2008). The ILFARM project plans to<br />
plant 500.000 trees in order to increase the access to GM (NORDECO, 2008). Appendix E provides<br />
information on five main trees already found and which will be planted any time soon.<br />
9.5. <strong>SRI</strong><br />
The sustainability of a farming system can be measured in many ways. The following parameters<br />
were examined: use of seeds, rice varieties grown, <strong>SRI</strong> techniques, yields, present <strong>SRI</strong> field sizes<br />
and future <strong>SRI</strong> field sizes.<br />
51
9.5.1. Seeds and varieties<br />
The amount of seeds used for <strong>SRI</strong> versus traditional growing was very significant: farmers only<br />
used 0.02 kg seeds m -2 compared to their traditional fields where they used 0.63 kg seeds m -2<br />
respectively. The seeds are not directly sown in the fields but in small nurseries where after the rice<br />
seedlings are transplanted. These results are in accordance with <strong>SRI</strong> practices in other countries.<br />
Menete et al. (2008) used 0.1 kg of seed per m 2 for trials in Mozambique and Satyanarayana et al.<br />
(2007) report that <strong>SRI</strong> farmers in India are able to reduce the seeding rates (20% of conventional<br />
use) with app. 0.0005 kg to 0.001 kg m -2 . Anthofer (2004) reports that Cambodian <strong>SRI</strong> farmers<br />
were able to reduce seeding rates from 90 kg ha -1 30 kg ha -2 by converting to <strong>SRI</strong> corresponding to<br />
0.009 kg ha -1 to 0.003 kg ha -1 respectively.<br />
Most of the identified rice varieties used by farmers were traditional – 36 different (see Appendix<br />
E) with only few being modern introduced varieties such as IR varieties. The farmers use in average<br />
four different varieties, often mixed within the same field. Farmers use the same varieties for both<br />
<strong>SRI</strong> and their traditional fields. Koma (2002) states that local varieties perform very well with <strong>SRI</strong><br />
practices and even though modern cultivars give higher yields, consumers still prefer local varieties<br />
hence market prices are higher. Local varieties have probably adapted to the lowland rainfed<br />
conditions which according to Wade et al. (1999) are very alike in all lowland rainfed rice systems<br />
and often are tall as submergence comes and goes very unpredictable. Prasad (2006) evaluates that<br />
<strong>SRI</strong> can be seen as a variety independent system which does not seek higher yields from growing<br />
different varieties. Kabir & Uphoff (2007) did however find from <strong>SRI</strong> FFS in Myanmar that most<br />
popular non <strong>SRI</strong> methods included selecting better genetic material and higher quality seeds which<br />
resulted in 18% and 28% increase in yield respectively (performed with <strong>SRI</strong>).<br />
The green revolution only introduced new varieties for dry season production in Cambodia and only<br />
few varieties for the wet season (Koma, 2008) meaning few varieties for the rainfed systems. The<br />
green revolution had a great impact on irrigated areas with good soil with fertilizer responsive<br />
varieties but in indigenous systems trials have often tried to replace and not complement the<br />
farming systems which were not successful (Greenland, 1997). However with future breeding on<br />
rainfed rice the possibility of varieties performing well with rainfed conditions might prove very<br />
efficient with <strong>SRI</strong> practice.<br />
52
9.5.2 <strong>SRI</strong> techniques<br />
The different <strong>SRI</strong> techniques were identified within the group of target farmers. The three main<br />
techniques were: i) use of natural fertilizers, ii) one seedling per hill and iii) to plant in lines.<br />
Farmers used the term “natural fertilizers” which in this case means composts and green/leafy<br />
manures. The farmers also considered to plant seedlings in lines to be part of the <strong>SRI</strong> techniques<br />
which is most likely due to the fact that CEDAC encouraged farmers, when transplanting, to use a<br />
rope and plant in straight lines in order to achieve the same distance from plant to plant. Figure 13<br />
illustrates the <strong>SRI</strong> techniques practiced by percentage of farmers.<br />
Percentage of Farmers<br />
100,00<br />
90,00<br />
80,00<br />
70,00<br />
60,00<br />
50,00<br />
40,00<br />
30,00<br />
20,00<br />
10,00<br />
0,00<br />
93<br />
Use of natural fertilizer<br />
<strong>SRI</strong> techniques practised by farmers<br />
57<br />
Plant in lines<br />
10<br />
Regular weeding<br />
93<br />
Transplant one seedling<br />
13<br />
Plough twice before transplanting<br />
Levelling of field<br />
3 7 3 3<br />
Use of chemical fertilizers<br />
Figure 13. <strong>SRI</strong> techniques practiced by interviewed farmers.<br />
Use less water<br />
General care taking<br />
The use of natural fertilizers is not new to the farmers as they have used animal manure for growing<br />
rice for decades. Some respondents identified chemical fertilizers as being part of <strong>SRI</strong>. Chemical<br />
fertilizers can very well be used with <strong>SRI</strong> (Laulaníe, 1993) but the use of composts have been in<br />
focus as many RPF do not have access to chemical fertilizers (Stoop et al., 2002; Sheehy et al.<br />
,2004). The target farmers mainly combined use of natural fertilizers and one seedling per hill. See<br />
Appendix E for details for combinations on <strong>SRI</strong> techniques.<br />
A majority of the farmers do however not identify the age of the seedlings as being important –<br />
which is a rather important part of <strong>SRI</strong>. It is common to use young seedlings around 10 days<br />
(Prasad, 2006) or 8-12 days (Haden et al., 2007) which will ensure a better root growth and space<br />
53
for tiller development (Satyanarayana, 2004). The latter being a fair indicator of the yield potential<br />
(Moldenhauer & Gibbons, 2003).<br />
Another key force within <strong>SRI</strong> is the water management. Only very few farmers do however mention<br />
water management as a <strong>SRI</strong> technique. Probably due to no or very limited irrigation systems and<br />
channels in the area in order to control and manage water. Anthofer (2004) discovered similar<br />
results from a survey on <strong>SRI</strong> in Cambodia in 2004 and concluded that water management including<br />
flooding in some periods and dry conditions in other periods and regular weeding was difficult for<br />
farmers to manage. Husain et al. (2004) and Mcdonald et al. (2006) both concluded that main<br />
constraints to increase number of farmers practicing <strong>SRI</strong> are due to lack of irrigation facilities,<br />
which for the farmers in Prey Veng is very true.<br />
9.5.3 Rice yields<br />
Farmers have improved their yields significantly with <strong>SRI</strong> compared to their traditional grown rice<br />
fields, considering that this is their first season with <strong>SRI</strong>. Figure 14 illustrates the average yield for<br />
farmers’ traditional grown rice and their <strong>SRI</strong> grown rice. The average <strong>SRI</strong> yields of 3.53 t/ha is 1 t<br />
above the Cambodian national average rice yield of 2.49 (IRRI, 2006). The <strong>SRI</strong> yield was<br />
significantly different from the traditional yield with a *** p-value = 0.0001097. The traditional<br />
rice yield is however quite high compared to CEDAC’s findings from 2005 with an average yield of<br />
1.59 t/ha (CEDAC, 2008a) which is more in accordance of the expected yields of 800-1400 kg ha -1<br />
from the given soil conditions (White et al, 1997a). It is however possible that farmers have been<br />
influenced to adopt some <strong>SRI</strong> techniques for their traditional run fields thus improving their<br />
traditional rice production. Another possibility is that when questioned on their yields from <strong>SRI</strong> and<br />
traditional rice by CEDAC staff, the farmers exaggerated the yields from both systems or at least<br />
the <strong>SRI</strong> yields in order not to disappoint CEDAC and to attract free extension services from<br />
CEDAC.<br />
54
t/ha<br />
5,5<br />
5<br />
4,5<br />
4<br />
3,5<br />
3<br />
2,5<br />
2<br />
1,5<br />
1<br />
0,5<br />
0<br />
2,19<br />
Rice yields 2008<br />
3,53<br />
Traditional <strong>SRI</strong><br />
Rice cropping systems<br />
Figure 14. Average rice yields for traditional and <strong>SRI</strong> farming systems from the crop season of 2008.<br />
In reality the yields are not per ha as none of the farmers grow <strong>SRI</strong> fields that large but they have<br />
been recalculated to t/ha as a more flexible way of comparing local yields with other yields from<br />
Cambodia and other countries. Assuming the reported yields by farmers are correct the difference is<br />
significant and similar to other comparisons examined by e.g. Caesay (2002); Yamah (2002); Stoop<br />
et al. (2002); Anthofer (2004) and Kabir & Uphoff (2007). Table 2 illustrates the yield differences<br />
as well between <strong>SRI</strong> and traditional grown rice.<br />
There was however no correlation between amount and type of amendments (incl. chemical<br />
fertilizers) and <strong>SRI</strong> yield nor between income and <strong>SRI</strong>. However it would have been expected that<br />
larger farmers (higher household incomes) would be able to invest in more chemical fertilizers and<br />
labour input and thereby increase yields.<br />
The only real difference between the farmers’ traditional field and <strong>SRI</strong> is then the use of only one<br />
seedling per hill with a wider spacing as water level and management was the same for the two<br />
systems. One seedling per hill with wider spacing is known by <strong>SRI</strong> supporters to increase the root<br />
growth, tiller and canopy development of young transplanted seedlings because the plant has more<br />
time and space to develop itself (Satyanarayana, 2004; Kabir & Uphoff, 2007;). Fewer roots per hill<br />
reduce the risk of root growth inhibition sometimes found when seedlings are transplanted several<br />
together (Satyanarayana et al., 2007). Larger root systems will then increase nutrient uptake (Kabir,<br />
55
2006). Hence both nutrient uptake is higher and competition due to nutrients is lower than in a<br />
traditional field with 5-6 seedlings per hill. Normally the narrow spacing of transplants in<br />
conventional fields will produce fewer tillers app. 8-13 per plant (Stoop et al., 2002), although this<br />
will depend on soil and management practices and the used varieties. However for the conditions in<br />
Cambodia it was observed that traditional fields often had a little more than 10 tillers per plant<br />
whereas <strong>SRI</strong> plants often had a few more tillers. It is however notable here that most farmers did<br />
not transplant younger seedlings to their <strong>SRI</strong> fields (1 farmer mentioned he used younger<br />
seedlings). It is then remarkable that the difference in yields is more than 1 t. If farmers used<br />
younger seedlings the difference in yield could have related to uprooting damage from the seedbed<br />
as younger seedlings will be less damaged by uprooting upon transplanting (Yoshida, 1981). Young<br />
seedlings used in <strong>SRI</strong> are also believed to be more easily adapting to the new environments found in<br />
the field and the “stress” involved in transplanting (Kabir, 2006).<br />
The competition between the plants might have an effect on the yield potential – also called<br />
intraspecific competition which is competition between plants of the same species and is very much<br />
depending on density (Antonovics & Levin, 1980). Kawano et al. (1974) state that in soils low in N<br />
content, rice plants will first compete for the soil Nitrogen and later light which is vice versa in soils<br />
high in N content. Kawano et al. (1974) further conclude from trials in Peru on spacing and<br />
intraspecific competition involving 25 different varieties that in soils low in N content, wider<br />
spacing is beneficial which especially is suitable for vigorous tall growing varieties with long<br />
growth duration. With the given low N containing soils in Prey Veng, the wider spacing might thus<br />
have caused a yield increase in the <strong>SRI</strong> field as compared to the traditional fields.<br />
The competition from weeds could not have caused the differences in yield as weed problems are<br />
low in the traditional systems due to dense spacing and in the <strong>SRI</strong> fields hand weeding was done<br />
regularly by most farmers. Koma (2007) states that farmers can obtain higher yields with <strong>SRI</strong>, even<br />
if they only manage some of the concepts.<br />
Given these yield increases is also one of the reasons why farmers would like to continue with <strong>SRI</strong><br />
for the next season. Figure 15 pictures main reasons why farmers would like to continue with <strong>SRI</strong><br />
next year. However, when farmers were interviewed, only one household had harvested and the<br />
farmers could therefore not have experienced the increase in yield. This illustrates how confident<br />
56
the farmers are with <strong>SRI</strong>. Or farmers respond in this way because they are interviewed by CEDAC<br />
and the author and would like to satisfy CEDAC and the author on responding positively about <strong>SRI</strong>.<br />
Percentage of Farmers<br />
100,00<br />
90,00<br />
80,00<br />
70,00<br />
60,00<br />
50,00<br />
40,00<br />
30,00<br />
20,00<br />
10,00<br />
0,00<br />
100<br />
Profit with<br />
seeds<br />
Reasons why farmers would like to continue with <strong>SRI</strong><br />
62<br />
59<br />
Increase yield No health<br />
risks<br />
17<br />
Save time Plants are<br />
bigger<br />
Reasons<br />
3<br />
24<br />
21<br />
Save money The rice<br />
grows faster<br />
Figure 15 illustrates 7 major reasons why the interviewed farmers would like to continue with <strong>SRI</strong> next year.<br />
The profit with seeds (farmers relate this to reduced costs for seeds and the fact that they use less of<br />
their stored seeds from last season) is the main reason why farmers would like to continue with <strong>SRI</strong><br />
next year which also relates to the column of saving money. The reduction in seeding rates is one of<br />
the milestones of <strong>SRI</strong> trying to reduce external input costs (Stoop et al., 2002) and not surprisingly<br />
farmers find this approach appealing.<br />
A majority of farmers state that health risks by use of chemical pesticides are reduced with <strong>SRI</strong><br />
although most farmers conducting <strong>SRI</strong> world wide cannot afford chemicals (Uphoff, 1999). All the<br />
identified farmers except two however responded that they do not use chemical pesticides, which<br />
then questions if they though still use small amounts but sense that when interviewed by CEDAC or<br />
the author they feel afraid or insecure of telling that they use agrochemicals.<br />
Saving time was also appointed by the farmers as being one important issue why to continue <strong>SRI</strong><br />
next season. <strong>SRI</strong> is however viewed by many critics and advocates as a labour intensive farming<br />
system (Moser & Barrett, 2003 & Dobermann, 2004) or as stated by the advocates as labour<br />
investing (e.g. Uphoff, 1999 & Stoop et al., 2002). It is especially hand weeding which is time<br />
57
consuming due to larger spacing and a longer timeframe until closure of the canopy which will<br />
enhance weed growth (Dobermann, 2004). Anthofer (2004) states that for <strong>SRI</strong> trials in Cambodia<br />
farmers saved labour time during transplanting as seedlings were easier to uproot and transplanting<br />
fewer plants per field saved time as well, although first time, <strong>SRI</strong> practising farmers needed more<br />
time for this. Tong et al. (2007) reports that in average it takes 60-70 people to transplant a<br />
conventional/traditional rice field of 1 ha. By only transplanting 1 seedling instead of several, it is<br />
probably possible to decrease the number of people needed for transplanting dramatically.<br />
Anthofer (2004) states that for weeding the amount of labour increased within <strong>SRI</strong> trials from<br />
Cambodia. It is however expected that when farmers are more experienced with <strong>SRI</strong> techniques the<br />
amount of labour will decrease (Prasad, 2006) and <strong>SRI</strong> can become a labour saving technique<br />
(Satyanarayana et al., 2007). The work load relating to compost production and transporting it to<br />
the fields might however be a constraint for converting all fields to <strong>SRI</strong>, especially those located far<br />
from the homestead land which is typical in Cambodia.<br />
As a response to the factors illustrated in figure 12 on why farmers would like to continue they were<br />
also questioned on how big an area they would plan to conduct <strong>SRI</strong> on for next year’s crop season.<br />
At present farmers grow in average 534 m 2 with <strong>SRI</strong> and next year the average area is 3676 m 2 .<br />
Table 7 illustrates this year’s and next year’s percentage of <strong>SRI</strong> of the farmers’ total land.<br />
Table 7. Present and 2009 percentage of <strong>SRI</strong> of total agricultural area.<br />
% <strong>SRI</strong> of total<br />
land<br />
2008 2009<br />
5 (+ - 9) 24 (+ - 27)<br />
The increase in land area with <strong>SRI</strong> corresponds to an increase of almost 20% which is quite an<br />
increase. It is however questionable if the farmers will be able to produce enough compost for next<br />
year’s <strong>SRI</strong> crop. This is discussed further in subsection 9.5.4<br />
All the participating farmers in the study would as mentioned want to continue with <strong>SRI</strong>, but in<br />
most cases the farmers will not be able to increase <strong>SRI</strong> production unlimited to all their land due to<br />
lack of enough compost or money for chemical fertilizers. Moser and Barrett (2003) found that the<br />
disadoption rate of <strong>SRI</strong> was higher amongst farmers with lower incomes in Madagascar. Barrett et<br />
al. (2004) suggest that poor farmers in Madagascar have difficulties to afford the interseasonal<br />
credit needed to conduct <strong>SRI</strong> as they cannot afford to use family available labour on <strong>SRI</strong> as they are<br />
58
forced to sell labour in order to survive at this time of year. Husain et al. (2004) concluded from<br />
trials with <strong>SRI</strong> in Bangladesh that only large farmers could increase their production of <strong>SRI</strong> without<br />
any risks as they are not as vulnerable to changes and difficulties as small scale farmers. Larger<br />
farmers would in this case be identified as farmers with higher incomes.<br />
Richer farmers will in general have more time as they do not only rely on income from rice as<br />
illustrated in figure 9. Farmers with lower incomes will have to use large percentages of their<br />
available time on selling labour far away from their homestead thus having less time available to<br />
take care of their rice fields. In terms of compost production larger farmers would most likely also<br />
be able to produce larger amounts due more domestic animals.<br />
All in all the target farmers seem to have adopted <strong>SRI</strong> now, at least for the moment. Before the<br />
initiation of the project 50% of the households experienced some degrees of conflicts but after some<br />
time the <strong>SRI</strong> fields showed strong growth and the conflicting counterparts in the households are<br />
now satisfied and believes in <strong>SRI</strong>. Such scepticism is most likely found in many implementing<br />
projects in the beginning. Presumably it relates to the type of paradigm used out of the three<br />
described by Blaikie et al. (1997): Classic, Neo-Liberal and Neo populist.<br />
Another sign of the success of <strong>SRI</strong> so far in the area is that farmers have spread the knowledge of<br />
<strong>SRI</strong> to their neighbours, approximately 10 persons (+ -9) who did not attend any training with<br />
CEDAC. Again it is a very high number and the fact that the author and CEDAC staff interviewed<br />
the farmers might have affected them to respond in a more positive way than reality. The effect is<br />
however very interesting. It is a so called “roll on” effect where practising <strong>SRI</strong> farmers will share<br />
their techniques with other interested farmers (Kabir, 2006) and again these farmers will inspire<br />
others to adopt <strong>SRI</strong>. The success of such a roll on effect will depend on the way a given system (in<br />
this case <strong>SRI</strong>) has been introduced to the community – which is a different way of sharing<br />
knowledge often practised by organizations introducing and bringing an idea to farmers (Kabir,<br />
2006). CEDAC has introduced <strong>SRI</strong> to the farmers through <strong>SRI</strong> experiments, campaigns and leaflets<br />
amongst others. Thus the interpretation is rather open and hence farmers will perform <strong>SRI</strong> as they<br />
think it should be which by involving them in such a way must be considered more sustainable.<br />
59
However even with this roll-on effect and free interpretation it is questionable how <strong>SRI</strong> will<br />
develop and in what form in the future. There is a tendency that farmers practising <strong>SRI</strong> after some<br />
time will mix <strong>SRI</strong> with some of their traditional methods and thus move away from <strong>SRI</strong> (Ma<br />
Veasna – personal communication, 2008). Such tendencies are in accordance with the findings from<br />
Moser & Barrett (2003) on disadoption rates amongst <strong>SRI</strong> farmers in Madagascar. CEDAC is<br />
providing various extension services: <strong>SRI</strong>, production of organic fertilizers, pesticide reduction,<br />
developing farmer associations, saving groups etc. (CEDAC, 2008c). The ILFARM project is<br />
ending in October 2009 (CEDAC, 2008c) which raises the question, how will <strong>SRI</strong> survive without a<br />
strong organization like CEDAC providing extension and training? First of all <strong>SRI</strong> is not a set of<br />
rules to be strictly followed (Stoop & Kassam, 2005) and should not be regarded as a part of a TOT<br />
and T&V strategy but a tool farmers can use and adapt like they wish. Farmers have participated in<br />
<strong>SRI</strong> training sessions and have been involved throughout the process. Therefore the sustainability<br />
must be larger – as the more participatory a project is, the more sustainable it is. Matteson (2000)<br />
states that the conversion of development projects changing strategy from T&V to FFS experienced<br />
much higher success rates, as farmers were involved more throughout the process of the project.<br />
CEDAC did not use FFS but similar training strategies thus <strong>SRI</strong> would probably still be practiced<br />
by the target farmers in the future but perhaps in a different set up.<br />
However considering the major impact CEDAC has had with the farmers during the project the lack<br />
of extension services after the end of the project might result in some farmers moving away from<br />
<strong>SRI</strong>. The target farmers are now used to have some sort of access to extension through CEDAC<br />
after the end of the project they will suddenly face another truth. Probably the most labour intensive<br />
techniques will be left out such as. e.g. compost production and farmers who can afford chemical<br />
fertilizers will increase in using it which is most likely the richer farmers. Poorer farmers might still<br />
use compost production as means of supplying nutrients to their farming system.<br />
9.5.4 Can farmers produce enough compost/GM for the future expansion of their <strong>SRI</strong> fields?<br />
This section will evaluate if farmers will be able to produce enough compost and apply enough<br />
biomass for the increase in area of <strong>SRI</strong> production for the season of 2009. According to the findings<br />
from the household survey as mentioned earlier, the farmers will in average expand their <strong>SRI</strong> from<br />
the present 534 m 2 to 3676 m 2 . According to CEDAC (2008a), 14% of interviewed household in<br />
the ILFARM project area are in average able to produce 2.550 kg of compost per year and 81% of<br />
60
households were in average able to collect 1.817 kg of natural fertilizers per year 9 . Table 8<br />
illustrates how farmers split their compost and natural fertilizers between seedbed preparation, rice<br />
fields and vegetable productions.<br />
Table 8. Farmers’ use of compost and natural fertilizers for seedbeds, rice fields and vegetable<br />
production. Numbers are given in percentages of total compost and natural fertilizer production<br />
respectively. Derived from CEDAC (2008a).<br />
Seedbed Rice fields Vegetable production (dry season)<br />
Compost 38% 57% 3%<br />
Natural fertilizers 51% 44% 4%<br />
If in average one household is able to produce/save/collect 1.817 kg of natural fertilizers and use<br />
44% for rice fields then 805 kg will in average be available to use for the rice fields. With the given<br />
application rate of green manure of 1.90 kg per m 2 , a household will then be able to grow an area of<br />
423,65 m 2 with such applications of GM.<br />
The situation will be similar if the natural fertilizers are changed with the production and<br />
application of compost. One family can approximately produce 2550 kg year -1 of compost and if<br />
they use 58% of this amount for the rice field they will have 1475 kg available for their rice fields.<br />
With an average application rate of compost of 0.33 kg per m 2 their amount of compost will cover<br />
an area of 4472 m 2 .<br />
A gap in year 2009’s production<br />
It is assumed that the farmers are able to produce the app. same amount of compost every year.<br />
Average fields next year are, as mentioned before above, in average 3676 m 2 . Farmers relying on<br />
compost will need to produce 1213 kg of compost to meet the needs of next year’s area of 3676 m 2<br />
if they still rely on the same application rate of 0.33 kg compost m -2 . This is however not a problem<br />
as the farmers with compost are able to produce 4472 kg of compost only for rice fields<br />
disregarding the two other sectors: seedbed and vegetable production but on the other side is the<br />
application rate very low compared to other studies (see table 6) and could thus be increased.<br />
Farmers who rely on natural fertilizers will have to find 6985 kg to be able to grow <strong>SRI</strong> for the 2009<br />
season with an application rate of 1.9 kg m -2 which is an additional amount of 6180 kg and it will<br />
therefore be difficult for farmers to reach. The application rate of 1.9 kg m -2 is however also very<br />
9 Natural fertilizers comprise plant residues, green manure and leafy manures such as Neem, Sesbania, Leucaena etc.<br />
61
high compared to other doses (see table 6). 1.9 kg m -2 corresponds to 19 t/ha which is a very large<br />
amount for small scale farmers to produce/collect and very labour intensive. Almost 50% of the<br />
farmers do however apply both compost and green manure and such a method will lead to many<br />
possibilities on finding the necessary means and amounts of amendments needed in order to reach a<br />
sustainable level of inputs.<br />
The amount of compost collected per year will cover the increase next year, but the amount of<br />
natural fertilizers collected will not be enough. Farmers only relying on natural fertilizers will need<br />
to find additional amounts of organic amendments. In theory the more compost the farmers apply<br />
the higher the yield and improved soil quality they will reach. Uphoff (1999) reports from <strong>SRI</strong><br />
practising farmers in Madagascar that amount and quality of added composts was very different<br />
from farmer to farmer and those with highest yields did also apply high amounts of compost or had<br />
a higher soil quality than other farmers. Husain et al. (2004), Mcdonald et al. (2006) and<br />
Satyanarayana et al. (2007) state that a major limitation for farmers practising <strong>SRI</strong> is the lack or low<br />
quantity of organic amendments applied to fields, which will decrease benefits of <strong>SRI</strong>. <strong>SRI</strong> can<br />
however very well be practiced with chemical fertilizers (Laulanie, 1993) but only few farmers can<br />
afford to buy these or have been encouraged by CEDAC not to use them and instead focus more on<br />
natural amendments. The farmers will through the ILFARM project receive app. 500.000<br />
multipurpose trees to plant on their homestead land and around rice fields in order to increase<br />
production of especially green manures (leaf manures). See Appendix E. Depending on which rate<br />
and amount of added compost/fertilizers farmers will somehow be forced to grow a certain area of<br />
<strong>SRI</strong>. They can choose to apply less amounts per m 2 thus reaching a larger area but with the given<br />
soil conditions (low C and N) the need for large applications is necessary in order to reach<br />
sustainable yields.<br />
9.5.5 Nutrient balance<br />
Assuming the farmers convert all their rice land to <strong>SRI</strong> and obtain average rice yields of 3.5 t/ha,<br />
and the increase in leafy manures together with increased compost production will reach an average<br />
amount of 3t/ha per year. A rough estimate of a nutrient budget could then look like the illustration<br />
in Table 8. The net balance indicate that N and P inputs are in excess but the K pool is being<br />
depleted most likely due to the removal of straw, which is typical for rice systems with removal of<br />
residues (Greenland, 1997; Dobermann & Fairhurst, 2000). However given the inputs of N, P and<br />
62
K, only a minor fraction is available to the plants upon application. Kundu & Ladha (1999) refer to<br />
Shi et al. (1980), Koyama, (1981) and Zhu et al. (1983) who suggest that only 20-30 % is<br />
assimilated by the rice crop, 20-30% is lost and the rest is immobilized. Within the anaerobic<br />
conditions in flooded rice systems added OM will accumulate (Hesse, 1984) and the release of plant<br />
available nutrients is slowed down (Greenland, 1997) due to a slower mineralization rate.<br />
The low K contents are common in lowland rainfed soils in Asia and can limit future production in<br />
terms of yield increase and may as well result in poorer N use efficiency (Dobermann & Fairhurst,<br />
2000). By just returning some parts of the straw, K content can be increased (Greenland, 1997). If<br />
the target farmers in the future can sustain the high yields identified in this survey, the need to<br />
remove all straw might not be necessary and thus some of the straw could be returned to the system<br />
increasing K input.<br />
The drying and flooding of the soil will have large impacts on the loss of N. Upon flooding NH4<br />
amount is increasing in the soil and by the end of the flooded period organic N and NH4 – N is<br />
governing (George et al., 1992). When the water table decrease and aerobic conditions are<br />
prevailing, aerobic N transformations are enhanced, resulting in mineralization of organic N to NH4<br />
which is nitrified to NO3 accumulating in the soil (George et al., 1992). However when the soil is<br />
flooded again in the beginning of the wet season the accumulated NO3 is lost within a short time<br />
(George et al., 1992). Rainfed lowland rice systems do in general experience a high nitrate leaching<br />
especially on soils rich in coarse textured materials (Dobermann & Fairhurst, 2000) which is typical<br />
for the soil in Prey Veng. Catch crops such as legumes can be grown during the dry season and<br />
accumulate NO3 and at the same time fix N from the air, and thus before the transplanting of the<br />
rice in the wet season, be incorporated in the soil and a significant amount of N is then returned to<br />
the soil (George et al., 1992).<br />
Another way of increase inputs of N could be to enhance the Biological Nitrogen Fixation (BNF)<br />
through various sources such as the intended planting of trees within the ILFARM project (See<br />
appendix E). Some important world wide used BNFs are e.g. Sesbania and Leucaena (De Datta,<br />
1987) and Azolla (Li, 1984) – the latter being native to many rice fields. Azolla is listed in Table 8<br />
to be able to account for inputs of 30 kg N ha -1 , which might be too high, as the examined fields<br />
experienced periods with drought where the production of Azolla would decrease most likely.<br />
63
The effect of the leafy manures is though very much depending on the time of incorporation and<br />
growth period (De Datta, 1987). Young GM materials should be incorporated into the soil before<br />
rice transplanting app. after eight weeks of growth or if older then incorporated several months<br />
before the transplanting in order to increase decomposition (De Datta, 1987).<br />
Sesbania can in average produce 15 t ha -1 of green matter with an N content of 2.67% of the dry<br />
weight (Singh, 1984). This would roughly result in 400 kg N ha -1 which is a rather large input.<br />
However not all N will be plant available as mentioned earlier. Given the percentages Kundu &<br />
Ladha (1999) referred to above the Sesbania crop would result in 80-120 kg available N ha -1 . As<br />
Sesbania can tolerate anaerobic conditions resulting from flooding (De Datta, 1987), farmers could<br />
grow a Sesbania crop before transplanting in early wet season app. eight weeks before<br />
transplanting. This would provide the farmers with a considerable input of N. The cultivation of a<br />
catch crop or a GM crop before the rice transplanting would also reduce the labour of transporting<br />
and producing composts on the homestead land. Instead organic biomass would more easily be<br />
present to incorporate in the soils, even in fields located far from the homestead lands.<br />
Given the traditional rice yield of 2.19 t ha -1 (grain), this would result in a straw dry mass of 3.3 t<br />
ha -1 with a harvest index of 0.5. In theory farmers have sustained their domestic animal production<br />
with an approximate rice straw production of 3.3 t ha -1 or less as opposed to the estimated scenario<br />
in table 8 where all land would be converted to <strong>SRI</strong>, resulting in a straw production of 5.25 t ha -1<br />
which is a difference of 1.95 t ha -1 . This signifies that farmers would be able to return this amount<br />
to the field. With uptake rates estimated by De Datta (1987) this would result in a new net balance:<br />
N (14.3 kg ha -1 ), P (14.6 kg ha -1 ) and K (- 0.7 kg ha -1 ). The balance of especially K would be quite<br />
sustainable if farmers could afford to return the additional production of straw or some of it. This is<br />
of course depending on their amount of cows and buffaloes per farmer. One could argue that with<br />
additional straw they would be able to sustain more domestic animals thus a trade-off situation is<br />
arising.<br />
64
Table 8. An estimated picture of an annual nutrient budget for the target farmers. All nutrient values are in<br />
kg/ha. Kundu & Ladha (1999) refer to Koyama (1981) stating that upon applying organic materials 10-20% of<br />
the N is mineralized and thus plant available, and the rest is immobilised and lost. An average value of 15%<br />
mineralized N, P and K has been chosen. Nutrient inputs from sediments have not been included as no natural<br />
flooding occurred in the target area.<br />
N P K<br />
Input<br />
(Kg/ha) (Kg/ha) (Kg/ha) Specifications References<br />
Precipitation 12 0,2 12 Greenland (1997)<br />
Biological N fixation (BNF): mainly<br />
Azolla 30<br />
Dobermann & Fairhurst (2000)<br />
Seedling uptakes estimated to be 2% of straw of<br />
Transplanted seedlings (30 days)<br />
0,6 0,08 1,4<br />
5.25 t/ha. Uptake rates determined from De Datta<br />
(1987)<br />
N (1,67%), P (0,83%) and K (1,66%) of the<br />
Compost incl. GM 50 25 49,8 3t/ha<br />
compost estimated from Latif et al. (2005)<br />
Total 92,6 25,28 63,2<br />
Output<br />
Grain 38 7 11 3,5 t/ha grain yield Uptake rates estimated from De Datta (1987)<br />
Straw 26,6 3,8 67,5<br />
Leaching (percolation)<br />
Gaseous loss: Volatalization &<br />
20 1 10<br />
denitrification 4<br />
Total 88,6 11,8 88,5<br />
Net balance 4 13,48 - 25,3<br />
5,25t/ha dry<br />
weight<br />
Harvest Index 0,5 estimated from Dobermann &<br />
Fairhurst (2000). 5% from stubble not removed.<br />
Uptake rates estimated from De Datta (1987)<br />
Estimated from Dobermann & Fairhurst (2000) and<br />
N loss from leaching George et al. (1992)<br />
Estimated from Greenland (1997)<br />
9.6. Can <strong>SRI</strong> mitigate GHGs and at the same time increase soil quality<br />
through C sequestration?<br />
There are large differences between the theoretical concepts of <strong>SRI</strong> as described by Laulanie<br />
(1993), Stoop et al. (2002) and Sheehy et al. (2004) and the <strong>SRI</strong> conducted by the farmers in the<br />
target area of this study. This section will try to evaluate the consequences of the conceptual <strong>SRI</strong><br />
and the <strong>SRI</strong> conducted by the farmers in Prey Veng.<br />
Table 10 is a theoretical model illustrating how a theoretical <strong>SRI</strong> system as described by Stoop et al.<br />
(2002) and Sheehy et al. (2004) and the <strong>SRI</strong> practiced by farmers potentially will affect emissions<br />
of CH4, N2O and CO2 and influence the soil C pool.<br />
The use of a fluctuating water table resulting in periods of drainage and moist soils (Laulanie, 1993;<br />
Sheehy et al. 2004) will result in long periods with aerobic conditions reducing CH4, which though<br />
will lead to increased emissions of N2O but at the same time increase C content. SOM will therefore<br />
65
e increased during times of flooding and slowly decrease when drained (Mitsuchi, 1974). There<br />
will however be a trade-off when considering the possibilities of denitrification and emissions of<br />
N2O. Intermittent flooding showed a 17% lower GWP for N2O and CH4 than continuous flooding in<br />
China (Yue et al., 2005) and thus the most favorable would seem to go for a fluctuating water table<br />
as with <strong>SRI</strong>.<br />
The emissions of N2O are quite large during the dry season – up to three to four times larger than<br />
upon the growth season (Dobermann & Fairhurst, 2000) upon aerobic conditions. Denitrification is<br />
occurring in situations of lack of oxygen and some bacterial strains will then use nitrate as a source<br />
of respiration in stead of oxygen (Patrick & Reddy, 1976). Denitrification can especially occur in<br />
wetland soils, poorly drained soils and soils fertilized with nitrate (Borggaard & Elberling, 2003).<br />
The theoretical <strong>SRI</strong> will give fewer rises to denitrification due to the fluctuating water table. The<br />
<strong>SRI</strong> practiced by farmers seems though however to experience some periods with denitrification<br />
due to the long drought periods and aerobic conditions.<br />
The farmers in Prey Veng do however not possess the means to control water, they are able to drain<br />
their fields but not adjust water levels later on. It is therefore very risky if they drain at one point<br />
and not are able to adjust water if a prolonged drought is present. Only 3% of the target farmers use<br />
less water, and their fields might in theory build up less C than fields that are flooded according to<br />
the findings of Mitsuchi (1974) but it is though doubtful if there will be any significant difference<br />
between their C levels and the other participating farmers. Especially when considering that one<br />
rice season is very short – a few months followed by a fallow period throughout the rest of the year.<br />
The farmers who are able to adjust water levels (3%) will though be able to reduce CH4 emissions<br />
due to drainage periods resulting in aerobic conditions (Wassmann et al., 2000; Yue et al., 2005;<br />
Zou et al., 2005; Li et al., (2009) but will at the same time increase emissions of N2O and CO2 and<br />
thereby creating a trade-off. The success of the drainage concepts is though depending on the<br />
degree of drainage i.e. complete drainage or as in the <strong>SRI</strong> theories soil is kept moist/wet to dry<br />
depending on the farmer and the area. If the soil is just a little too wet/moist there will still be<br />
methane emissions due to anaerobic conditions.<br />
The majority of farmers do as mentioned not adjust water levels and their “<strong>SRI</strong>” fields will emit<br />
more CH4 but less N2O and CO2 due to long periods with anaerobic conditions. The question is then<br />
which systems are to be preferred considering the present trade-off. Since few farmers use chemical<br />
66
fertilizers which can increase N2O emissions (Nishimura et al., 2004; Mandal et al., 2008), drainage<br />
periods will not lead to heavy emissions of N2O.<br />
The other important <strong>SRI</strong> concept is the use of organic amendments (Laulanie, 1993) which will<br />
reduce all three GHGs (Yagi & Minami, 1990; Neue, 1993; Nayak et al., 2007) and increase the C<br />
content of the soil (Jarecki & Lal, 2003; Ramesh & Chandrasekaran, 2004; Mandal et al., 2008;<br />
Rajashekhara Rao & Siddaramappa, 2008). 93% of the farmers follow this <strong>SRI</strong> concept and their<br />
fields will therefore most likely have some influence on GHG emissions and build up of C pools.<br />
The fact that farmers remove the rice straw from the fields is removing nutrients, but removal of<br />
straw was according to Lou et al. (2007) found to decrease the emissions of CO2 and N2O. This is<br />
linked to the higher cellulose content of straw compared to the roots which will result in a slower<br />
decomposition of straw than roots (Lou et al., 2007).<br />
The degree of GHG emission reductions and C dynamics will very much depend on the applied<br />
amount of organic amendments and as discussed above in “compost production” are farmers able to<br />
collect quite a lot of natural fertilizers but they are not able to produce larger amounts of compost.<br />
Estimates are made on the C pool increase per year based on the organic inputs in table 9 and 10. If<br />
farmers in average would grow one ha or more with <strong>SRI</strong>, apply 3t/ha of compost/GM and have an<br />
average yield of 3.5 t rice per ha, a yearly input of C would be 348 kg C per ha per year which<br />
corresponds to close to 1% of the soil C pool of 49.5 t/ha. It is estimated that app. 1% of the C soil<br />
pool is mineralized per year thus resulting in a steady state where losses matches inputs app.<br />
Jarecki & Lal (2003) found similar results from a situation with a rice yield of 3.96 t ha -1 and input<br />
of crop residues amounting to 2.67 t ha -1 . They concluded that the soil C pool was enriched with<br />
401 kg C ha -1 annually (Jarecki & Lal, 2003). With the intensions of the ILFARM project to<br />
establish 500.000 trees the potential of storing larger amounts of C seems possible. Given the inputs<br />
assessed in section 9.5.5, under the nutrient budget, the plantings of e.g. Sesbania on 1 ha would<br />
yield 15 t ha -1 of green matter (Singh, 1984). Assuming a C percentage of 42 % (Brady & Weil,<br />
1999a) this would leave the farmers with an additional C input of 6300 kg/ha where however some<br />
parts would be lost due to decomposition especially if the Sesbania is added directly and not<br />
composted. Conservation tillage or no tillage could increase the C budget in the soil, it is however<br />
67
doubtful if such measure would work for the RPF as they would have to increase input costs on<br />
pesticides which they do not have.<br />
To really affect and increase the C pool, the inputs of biomass must be larger than the losses of C<br />
(Lal, 2007) and thus taking the steady state to a new level. Given the amount of trees planted in the<br />
ILFARM project (500.000) this would mean 625 trees per participating household (800 in total).<br />
The available input of biomass would then app. at least be the double resulting in 6 t ha -1 (incl.<br />
compost). Such a double input would result in a net balance of 116 kg C ha -1 in excess after<br />
mineralization per year. For long term effects (20-30 years), assuming farmers would apply at least<br />
6 t ha -1 , this would result in a C pool of 51.5 t C ha -1 and 53 t C ha -1 respectively which is a rather<br />
small increase. However farmers will reach a sustainable rice production with high yields<br />
(3.5 t ha -1 ) and a slowly increasing C pool improving soil quality in the long run.<br />
However producing and transporting such large quantities of biomass is very labor intensive and<br />
only larger families (richer) will be more likely to cope with such a scenario. It is however unlikely<br />
that both small and larger households will convert all their land to <strong>SRI</strong>, as it requires intensive<br />
labor. A more likely scenario is that farmers will use some of the <strong>SRI</strong> techniques and mix them into<br />
their traditional system. Farmers conducting <strong>SRI</strong> will sometimes stop after a few years and then<br />
start mixing their traditional systems with <strong>SRI</strong> (Ma Veasna, personal communication, 2008).<br />
68
Table 9. An estimated C budget. It is assumed that farmers convert all their land to <strong>SRI</strong> and have an annual<br />
compost production of 3t/ha and a rice yield of 3.5 t/ha.<br />
Inputs kg C ha Specifications References<br />
Roots 210 Undecomposed<br />
42% C estimated from Brady & Weil, (1999a).Root<br />
shoot ratio estimated from Yoshida (1981) to be<br />
0.1<br />
Stubble 110 Undecomposed<br />
42% C estimated from Brady & Weil, (1999a).<br />
Stubble estimated to be 5% of the straw mass<br />
(5.25 t/ha)<br />
Compost 1050 Undecomposed C% of the compost is estimated to be 35%<br />
Total 1370<br />
Losses<br />
Roots 141 67% lost Estimated from Brady & Weil (1999a)<br />
Stubble 94 85% lost Estimated from Brady & Weil (1999a)<br />
Compost 788 75% lost Estimated from Brady & Weil (1999a)<br />
Total 1022<br />
Net balance 348<br />
Soil C pool =<br />
49.5 t/ha<br />
A perfect <strong>SRI</strong> system as described by e.g. Stoop et al., (2002) compared to conventional rice<br />
systems will most likely emit less amounts of GHGs and increase C pools due the water<br />
management involving several drainage periods. The <strong>SRI</strong> practiced by the targeted farmers within<br />
this project does not seem to possess the means of really affecting a decrease of GHG emissions due<br />
to no water management. The potentials of increasing the C pool does however seem more<br />
appropriate for the RPF in Prey Veng with the input of 500.000 trees over the next years.<br />
On the basis of the discussion on GHG emissions and C sequestration, it is tempting to state that<br />
<strong>SRI</strong> is moving the target farmers’ livelihood sustainability towards a new and higher level. Or as<br />
stated by Pretty (2000) on the definition of a sustainable farming system being one that:<br />
“..sequesters carbon in soils through organic matter accumulation both contributes to the global<br />
good by mediating climate change and the private good by enhancing soil health”. RPF can turn a<br />
rice based farming system emitting large amounts of GHGs into a sustainable one (such as <strong>SRI</strong> or<br />
other systems) through C storage and develop a beneficial system with long term effects on<br />
increased soil quality and productivity. By reducing the emissions of GHGs, soil C is increasing in<br />
combination with applied organic materials and soil fertility can increase hence have a large<br />
positive influence on their livelihood strategies and future life.<br />
69
Table 10. Estimated effects of <strong>SRI</strong> techniques on GHG emissions and SOC changes. Theoretical <strong>SRI</strong> concepts as described by Sheehy et al. (2004) and Stoop et al. (2002) are<br />
compared with the identified <strong>SRI</strong> techniques from the 30 interviewed farmers. Numbers in brackets indicate the percentage of practicing farmers. - 1 = increase, 1 = decrease and 0 =<br />
no real effect. References are not dealing with <strong>SRI</strong> specifically but describe similar management tools affecting GHG emissions and C dynamics.<br />
<strong>SRI</strong> techniques N2O CH4 CO2 References ∆C References<br />
Compost + organic amendments 1 1 1<br />
Water management (several drainage periods) -1 1 -1<br />
1 seedling per hill -1 - 1; +1 -1<br />
Yagi & Minami<br />
(1990); Neue<br />
(1993); Nayak et al.<br />
(2007)<br />
Wassmann et al.<br />
(2000); Yue et al.<br />
(2005); Li et al.<br />
(2009); Zou et al.<br />
(2005).<br />
Denitrification.<br />
Patrick & Reddy<br />
(1976).<br />
Yagi & Minami<br />
(1990); Lou et al.<br />
(2007); Yan et al.<br />
(2009)<br />
70<br />
1<br />
-1<br />
Jarecki & Lal (2003); Ramesh &<br />
Chandrasekaran (2004); Mandal et<br />
al. (2008); Rajashekhara Rao &<br />
Siddaramappa (2008)<br />
Mitsuchi (1974); Nishimura et al.,<br />
(2008)<br />
1 Lou et al. (2007)<br />
Regular hand weeding 0 0 0 0<br />
<strong>SRI</strong> techniques practiced by the studied farmers N2O CH4 CO2 References ∆C References<br />
Use of natural fertilizers (compost+green manure) (93%) 1 1 1<br />
Yagi & Minami<br />
(1990); Neue<br />
(1993); Nayak et al.<br />
(2007)<br />
Wassmann et al.<br />
(2000); Yue et al.<br />
1<br />
Use less water (3%) -1 1 -1<br />
(2005); Li et al.<br />
(2009); Zou et al.<br />
(2005),<br />
-1<br />
Plough twice before transplanting (13%) -1 -1 -1 Harada et al. (2007) -1<br />
Plant in lines (56%) 0 0 0 0<br />
Leveling of field before transplanting (3%) -1 -1 -1 Harada et al. (2007) -1<br />
Transplant 1 seedling per hill (93%) -1 1 -1<br />
Yagi & Minami<br />
(1990); Lou et al.<br />
(2007)<br />
Regular weeding (10%) 0 0 0 0<br />
General care taking (3%) 0 0 0 0<br />
Chemical fertilizers (6%) -1 1 1<br />
Nishimura et al.<br />
(2004)<br />
Mandal et al. (2008); Ramesh &<br />
Chandrasekaran (2004); Jarecki &<br />
Lal (2003); Rajashekhara Rao &<br />
Siddaramappa (2008)<br />
Mitsuchi (1974); Nishimura et al.,<br />
(2008).<br />
West & Post (2002); Jarecki & Lal<br />
(2003)<br />
West & Post (2002); Jarecki & Lal<br />
(2003)<br />
1 Lou et al. (2007)<br />
1 Mandal et al. (2008)
10. Conclusion<br />
The farmers participating in the present study have successfully obtained a significant increase in<br />
their rice yields by growing <strong>SRI</strong> on a small piece of their land. The main management difference<br />
seems to be the use of one single transplant per hill and not several as in traditional growing. The<br />
wider spacing will provide less competition for nutrients in the low fertility soils and hence a higher<br />
yield. The farmers did not possess the equipment to control the water level in the fields, but they<br />
were still able to increase their yields significantly. This would imply that <strong>SRI</strong> works properly when<br />
farmers just use some of the concepts. The water management implied in the <strong>SRI</strong> theories is<br />
difficult to practice in many resource poor areas, but the results from this survey indicate that it is<br />
not necessary to follow all steps of <strong>SRI</strong> in order to increase yields.<br />
Both poor and rich farmers, in terms of household incomes, have proven equal in adopting and<br />
practising <strong>SRI</strong> to their fields with no correlation found between income and yield. Likewise there<br />
was no correlation between C and N content and income. For future aspects of conducting <strong>SRI</strong>,<br />
farmers with higher incomes might though be more likely to continue with <strong>SRI</strong> and grow larger<br />
areas than poorer farmers. Richer farmers will have more land, and thereby be able to produce more<br />
biomass for compost making and harvest more manure from domestic animals. <strong>SRI</strong> is tough still a<br />
very sustainable system targeting the poor farmers. The results obtained during this study indicate<br />
that the amount of compost/GM did not have any influence on the yield. Thus RPF poor or not so<br />
poor, will by using wider spacing be able to increase their yields which must be described as much<br />
more sustainable than their traditional system. The farmers have obtained these yields by using less<br />
inputs than in their traditional rice systems and their level of sustainability will move to another<br />
level, if they would continue with <strong>SRI</strong> or use some of the concepts.<br />
<strong>SRI</strong> is a farming system with much potential regarding GHG mitigation and increase in soil C<br />
contents if all concepts are followed. The theoretical concepts as described by Laulanie (1993) and<br />
Sheehy et al. (2004) would be able to reduce emissions of especially methane dramatically due to a<br />
fluctuating water table. The <strong>SRI</strong> practiced by the farmers will not be able to mitigate large amounts<br />
of GHGs, mainly because no water management was carried out. This is not a choice made by the<br />
farmers but due to no irrigation facilities in the area.<br />
71
Both the theoretical <strong>SRI</strong> and the one practiced by the target farmers seem to be able to increase the<br />
soil C pool due to the applications of compost/GM. With the amounts applied by the target farmers<br />
there is no increase in soil C but a steady state of inputs and outputs of C thus implying a<br />
sustainable balance. However with the introduction of the 500.000 trees farmers could in theory<br />
increase the C pool with 116 kg C ha -1 per year as the planting of trees would provide them with<br />
high amounts of biomass. The introduction of trees would also allow the farmers to have enough<br />
organic materials to e.g. convert all their land to <strong>SRI</strong> as their compost production at the moment is<br />
very limited.<br />
The fact that CEDAC will not be present for ever in the target area might indicate that farmers will<br />
not conduct <strong>SRI</strong> as described by Stoop et al. (2002) or Sheehy et al. (2004) but more a mixture<br />
between traditionally and <strong>SRI</strong>. This would also seem to be more sustainable as farmers have learned<br />
by participatory doing and thus made their own experiences. Especially the fact that using only one<br />
seedling brought higher yields than traditional seems likely that farmers would continue with this.<br />
Water management does not seem an option at the moment without any proper irrigation facilities<br />
in the area, but it might not be necessary considering the yield increases obtained using only one<br />
seedling. It is given the target farmers and their neighbours will use parts of <strong>SRI</strong>. Given the large<br />
roll on effect where farmers shared their experiences on <strong>SRI</strong> with in average 9 people would imply<br />
that the concepts and ideas of <strong>SRI</strong> are spreading rather fast and will survive in the area. CEDAC has<br />
then successfully implemented a sustainable long lasting project which will benefit farmers in many<br />
years to come.<br />
<strong>SRI</strong> has been through many controversial discussions about its potential in rural areas of the rice<br />
growing world. It has often been criticised of its alternative ways. This study indicates that by<br />
following only a few of the <strong>SRI</strong> concepts, farmers are able to increase their rice yields and <strong>SRI</strong><br />
could then be considered very appropriate for the poorest farmers groups with few resources.<br />
In a world with a growing population and risks of food shortages, <strong>SRI</strong> can provide security for the<br />
poorest groups and it should therefore receive more attention in the future regarding research<br />
projects and recognition.<br />
72
11. References<br />
Anthofer, J. 2004. The potential of the System of Rice<br />
Intensification (<strong>SRI</strong>) for Poverty Reduction in Cambodia. Deutscher<br />
Tropentag, Berlin. 2004. Conference on International Agricultural<br />
Research for Development. German Development Co-operation<br />
(GTZ). Available at internet:<br />
http://www.tropentag.de/2004/abstracts/full/399.pdf<br />
Antonovics, J. & Levin, D. A. 1980. The ecological and genetic<br />
consequences of density-dependent regulation in plants. Ann. Rev.<br />
Ecol. Syst. 11: 411-52.<br />
Barrett, C.B., Moser, C.M., Mchugh, O.V., Barison, J. 2004.<br />
Better technology, better plots, or better farmers? Identified changes<br />
in productivity and risk among Malagasy rice farmers. Amer. J. Agr.<br />
Econ 86(4): 869-888.<br />
Berg, H. van den., Jiggins, J. 2007. Investing in Farmers – The<br />
impacts of Farmer Field Schools in Relation to Integrated Pest<br />
Management. World Development Vol. 35(4): 663-686.<br />
Blaikie, P., Brown, K., Stocking, M., Tang, L., Dixon, P., Sillitoe,<br />
P. 1997. Knowledge in action: Local knowledge as a development<br />
resource and barriers to its incorporation in natural resource research<br />
and development. Agricultural Systems Vol 55(2): 217-237.<br />
Blair, G.J., Lefroy, R.D.B., Lisle, L. 1995. Soil Carbon fractions<br />
based on their degree of oxidation, and the development of a Carbon<br />
Management Index for agricultural systems. Aust. J. Agric. Res 46:<br />
1459-1466.<br />
Borggaard, O.K. & Elberling, B. 2003. Soil Organic Matter. In:<br />
Biogeochemistry in a pedological context. pp 101-140. Holte<br />
Bogtrykkeri A/S. Holte. Denmark.<br />
Borggaard, O.K. 2006. Environmental Chemistry and Pedology of<br />
Tropical Soils. Department of Natural Sciences, Royal Veterinary &<br />
Agricultural University, Frederiksberg. Pp 87.<br />
Brady, N.C. & Weil, R.R. 1999a. Soil Organic Matter. In The<br />
Nature and Properties of Soils. 12 th edition. Prentice Hall, Upper<br />
Saddle River, New Jersey, USA. pp: 446-489.<br />
Brady, N.C. & Weil, R.R. 1999b. Soil Reaction: Acidity and<br />
Alkalinity. In The Nature and Properties of Soils. 12 th<br />
edition. Prentice Hall, Upper Saddle River, New Jersey, USA. pp:<br />
446-489.<br />
Bunch, R. 2002. Use of Green Manures and Cover Crops with <strong>SRI</strong>.<br />
A presentation held at the International Conference "Assessments of<br />
the System of Rice Intensification (<strong>SRI</strong>)", Sanya, China, April 1- 4,<br />
2002. Available at internet:<br />
http://ciifad.cornell.edu/sri/proc1/sri_43.pdf<br />
CEDAC. 2008a. Improving Livelihood of Small Farmers in<br />
Kanhchriech District of Prey Veng Province. ILFARM-KCR. Second<br />
Draft Report. CEDAC October 2008.<br />
CEDAC, 2008b. Evaluation Study: Adoption and non-adoption of<br />
System or Rice Intensification (<strong>SRI</strong>) in Cambodia. CEDAC. July<br />
2008.<br />
CEDAC, 2008c. Description of the ILFARM project.<br />
http://cedac.org.kh/Ip_pdf02.pdf<br />
Ceesay, M.M. 2002. Experiments with the System of Rice<br />
Intensification in The Gambia. A presentation held at the<br />
International Conference "Assessments of the System of Rice<br />
Intensification (<strong>SRI</strong>)", Sanya, China, April 1- 4, 2002<br />
Available at Internet: http://ciifad.cornell.edu/sri/proc1/sri_13.pdf<br />
Dawson, J.J.C. & Smith, P. 2007. Carbon losses from soil and its<br />
consequences for land-use management. Science of the Total<br />
Environment 382: 165-190.<br />
De Datta, S.K. 1987. Principles and practices of rice production. 1 st<br />
edition 1981. Reprint edition 1987 with corrections. Robert E.<br />
Krieger Publishing Company, INC. Malabar, Florida, USA. p. 618.<br />
De Datta, S.K. & Hundal, S.S. 1984. Organic matter management<br />
on land preparation and structural regeneration in rice-based<br />
cropping systems. In Organic matter and rice. International Rice<br />
Research Institute. Manilla, Phillipines. pp: 399-416.<br />
Dobermann, A & White, P.F. 1999. Strategies for nutrient<br />
management in irrigated and rainfed lowland rice systems. Nutrient<br />
Cycling in Agroecosystems 53: 1-18.<br />
Dobermann, A. & Fairhurst, T. 1999. Nutrient Management. In:<br />
Rice. Nutrient Disorders & Nutrient Management. IRRI. Makati<br />
City, Philippines. pp. 13-17.<br />
Dobermann, A. & Witt, C. 2000. The potential impact of crop<br />
intensification on carbon and nitrogen cycling in intensive rice<br />
systems. p. 1-26. In: Carbon and Nitrogen dynamics in flooded soils.<br />
Ed: Kirk, G.J.D. & Olk, D.C. pp 188. IRRI, Philippines.<br />
Dobermann, A. 2004. A critical assessment of the system of rice<br />
intensification (<strong>SRI</strong>). Agricultural Systems 79: 261-281.<br />
Follett, R.F. 2001. Soil management concepts and carbon<br />
sequestration zin cropland soils. Soil & Tillage Research 61: 77-92.<br />
Frolking, S., Li, C., Braswell, R., Fuglestvedt, J. 2004. Short- and<br />
long-term greenhouse gas and radiative forcing impacts of changing<br />
water management in Asian rice paddies. Global Change Biology 10:<br />
1180-1196.<br />
George, T., Ladha, J.K., Buresh, R.J., Garrity, D.P. 1992.<br />
Managing native and legume-fixed nitrogen in lowland rice-based<br />
cropping systems. Plant & Soil 141: 69-91.<br />
Greenland, D.J. 1997. Rice Farming Today. In: The sustainability of<br />
rice farming. CAB International, Oxon, UK and New York, USA..<br />
IRRI, Manilla, Philippines. p. 273.<br />
Haden, V.R., Duxbury, J.M., DiTommaso, A., Losey, J.E. 2007.<br />
Weed Community Dynamics in the System of Rice Intensification<br />
(<strong>SRI</strong>) and the Efficacy of Mechanical Cultivation and Competitive<br />
Rice Cultivars for Weed Control in Indonesia. Journal of Sustainable<br />
Agriculture 30 (4): 5-26.<br />
Harada, H., Kobayashi, H., Shindo, H. 2007. Reduction in<br />
greenhouse gas emissions by no-tilling rice cultivation in<br />
Hachirogata polder, northern Japan: Life-cycle inventory analysis.<br />
Soil Science and Plant Nutrition 53: 668-677.<br />
Hesse, P.R. 1984. Potential of organic materials for soil<br />
improvement. In Organic matter and rice. International Rice<br />
Research Institute. Manilla, Phillipines. pp: 35-44.<br />
Husain, AM.M., Chowhan, G., Rahman, ABM. Z., Uddin, R.,<br />
Barua, P. 2004. Report on the System of Rice Intensification (SP 36<br />
02). Prepared for PETTRA Technology Workshop. BRRI<br />
Auditorium, Gazipur. May 23-24, 2004. Available at internet:<br />
http://ciifad.cornell.edu/sri/countries/bangladesh/bangpetechrep.pdf<br />
73
Hutchinson, J.J., Campbell, C.A., Desjardins, R.L. 2007. Some<br />
perspectives on carbon sequestration in agriculture. Agricultural and<br />
Forest Meteorology 142: 288-302.<br />
IPCC. 2000. Special report on Land Use, Land-Use Change and<br />
Forestry.<br />
Available at Internet:<br />
http://www.ipcc.ch/ipccreports/sres/land_use/index.htm<br />
Inoko, A. 1984. Compost as a source of plant nutrients. In: Organic<br />
Matter and rice. International Rice Research Institute. Manilla,<br />
Phillipines. pp: 137-146.<br />
IRRI. 2006. Available at internet:<br />
http://www.irri.org/science/ricestat/data/may2008/WRS2008-<br />
Table01.pdf<br />
http://www.irri.org/science/ricestat/data/may2008/WRS2008-<br />
Table02.pdf<br />
http://www.irri.org/science/ricestat/data/may2008/WRS2008-<br />
Table03.pdf<br />
Jarecki, M.K & Lal, R. 2003. Crop management for Soil Carbon<br />
Sequestration. Critical Reviews in Plant Sciences 22 (5): 471-502.<br />
Javier, E.L. 1997. Rice ecosystems and varieties. In: Rice<br />
production in Cambodia. Manila (Philippines): International Rice<br />
Research Institute. Ed: Nesbitt, H.J. p. 39-83.<br />
Kabir, H. 2006. Adaptation and Adoption of the System of Rice<br />
Intensification (<strong>SRI</strong>) in Myanmar using the Farmer Field School<br />
(FFS) approach. PhD thesis. Final draft. University of Honolulu. p.<br />
124. http://ciifad.cornell.edu/sri/theses/kabirthesis.pdf<br />
Kabir, H. & Uphoff, N. 2007. Results of Disseminating the System<br />
of Rice Intensification with Farmer Field School Methods in<br />
Northern Myanmar. Expl. Agric 43: 463- 476.<br />
Kawano, K., Gonzalez, H., Lucena, M. 1974. Intraspecific<br />
competition, competition with weeds, and spacing response in rice.<br />
Crop Science vol. 14: 841-845.<br />
Kimura, M., Murase, J., Lu, Y. 2004. Carbon cycling in rice field<br />
ecosystems in the context of input, decomposition and translocation<br />
of organic materials and the fates of their end products (CO2 and<br />
CH4). Soil Biology & Biochemistry 36: 1399-1416.<br />
Koma, Y.S. 2002. Experciences with the System of Rice<br />
Intensification in Cambodia. Proceedings of an International<br />
Conference on ASSESSMENTS <strong>OF</strong> <strong>THE</strong> <strong>SYSTEM</strong> <strong>OF</strong> <strong>RICE</strong><br />
<strong>INTENSIFICATI<strong>ON</strong></strong> (<strong>SRI</strong>)<br />
Sanya, China, April 1-4, 2002. Available at internet:<br />
http://ciifad.cornell.edu/sri/proc1/sri_19.pdf<br />
Koma, Y.S. 2007. Experiences with System of Rice Intensification<br />
(<strong>SRI</strong>) in Cambodia from 2000-2007. CEDAC. Available at internet:<br />
http://www.cedac.org.kh/<strong>SRI</strong>%202000-2007.pdf<br />
Koma, Y.S. 2008. Proposed Strategies to Utilize the Potential of<br />
Rice Production in Cambodia. Agriculture and Rural Development<br />
Discussion Note. Available at internet: www.cedac.org.kh<br />
Kumazawa, K. 1984. Beneficial effects of organic matter on rice<br />
growth and yield in Japan. In: Organic Matter and rice. International<br />
Rice Research Institute. Manilla, Phillipines. pp: 431- 444.<br />
Kundu, D.K. & Ladha, J.K. 1999. Sustaining productivity of<br />
lowland rice soils: issues and options related to N availability. In<br />
Resource Management in Rice Systems: Nutrients. Eds:<br />
Balasubramanian, V., Ladha, J.K., Denning, G.L. Klüwer Academic<br />
Publishers. AA Dordrecht, The Netherlands. pp. 27-44.<br />
Lal, R. 2002. Why Carbon Sequestration in Agricultural Soils.<br />
Nutrient Cycling in Agroecosystems 61: 1-6.<br />
Lal, R. 2004. Soil carbon sequestration to mitigate climate change.<br />
Geoderma 123: 1-22.<br />
Lal, R. 2006. Enhancing crop yields in the developing countries<br />
through restoration of the soil organic carbon pool in agricultural<br />
lands. Land Degradation & Development 17: 197-209.<br />
Lal, R. 2007. Soil Physical Properties and Erosion. In Soil Carbon<br />
Management. Economic, Environmental and Societal Benefits. Ed:<br />
Kimble, J.M., Rice, C.W., Reed, D., Mooney, S., Follett, R.F., Lal,<br />
R. CRS Press Boca Raton, Florida, USA. pp 165 – 178.<br />
Larson, W.E. & Clapp, C.E. 1984. Effects of Organic Matter on<br />
soil physical properties. In Organic Matter and rice. International<br />
Rice Research Institute, Manilla, Phillipines. pp: 363-386.<br />
Latif, M.A., Islam, M.R., Ali, M.Y., Saleque, M.A. 2005.<br />
Validation of the system of rice intensification (<strong>SRI</strong>) in Bangladesh.<br />
Field Crops Research 93: 281-292.<br />
Laulanie, H.D. 1993. Le système de riziculture intensive malgache.<br />
TROPICULTURA 11 (3) : 110-114.<br />
Li, C., Cao, C., Wang, J., Zhan, M., Yuan, W., Ahmad, S. 2009.<br />
Nitrous oxide emissions from wetland rice-duck cultivation sytems in<br />
southern China. Arch Environ Contam Toxicol 56: 21-29.<br />
Lou, Y., Ren, L., Li, Z., Zhang, T., Inubushi, K. 2007. Effect of<br />
rice residues on carbon dioxide and nitrous oxide emissions from a<br />
paddy soil of subtropical china. Water Air Soil Pollut 178: 157-168.<br />
Ma Veasna – personal communication, 2008. CEDAC project<br />
coordinator of the ILFARM project. Held 18 th of October 2008 in<br />
Prey Veng City – CEDAC office, Prey Veng province, Cambodia.<br />
See Appendix F.<br />
Mak, S. 2001. Continued innovation in a Cambodian rice based<br />
farming system: farmer testing and recombination of new elements.<br />
Agricultural Systems 69: 137-149.<br />
Mandal, B., Majumder, B., Adhya, T.K., Bandyopadhyay, P.K.,<br />
Gangopadhyay, A., Sarkar, D., Kundu, M.C.,Choudhury, S.G.,<br />
Hazra, G.C., Kundus, S., Samantaray, R.N., Misra, A.K. 2008.<br />
Potential of double-cropped rice ecology to conserve organic carbon<br />
under subtropical climate. Global Change Biology 14: 2139-2151.<br />
Matteson, P.C. 2000. Insect Pest Management in Tropical Asian<br />
irrigated rice. Ann. Rev. Entomol. 45: 549-574.<br />
Mcdonald, A.J., Hobbs, P.R., Riha, S.J. 2006. Does the system of<br />
rice intensification outperform conventional best management? A<br />
synopsis of the empirical record. Field Crops Research 96: 31-36.<br />
Menete, M.Z.L., Es, H.M.V., Brito, R.M.L., DeGloria, S.D.,<br />
Famba, S. 2008. Evaluation of system of rice intensification (<strong>SRI</strong>)<br />
component practices and their synergies on salt-affected soils. Field<br />
Crops Research 109: 34-44.<br />
Minamikawa, K. & Sakai, N. 2007. Soil carbon budget in a singlecropping<br />
paddy field with rice straw application and water<br />
management based on soil redox potential. Soil Science and Plant<br />
Nutrition 53: 657-667.<br />
Mitsuchi, M. 1974. Characters of humus formed under rice<br />
cultivation. Soil Sci. Plant Nutr. 20(3): 249-259.<br />
74
Moldenhauer, K.A.K. & Gibbons, J. 2003. Rice morphology and<br />
development. In Rice. Origen, History, Technology and Production.<br />
Eds: Smith, C.W. & Dilday, R.H. John Wiley & Sons, Inc. USA. pp:<br />
103-128.<br />
Morari, F., Lugato, E., Berti, A., Giardini, L. 2006. Long-term<br />
effects of recommended management practices on soil carbon<br />
changes and sequestration in north-eastern Italy. Soil Use and<br />
Management 22: 71-81.<br />
Moser, C.M. & Barrett, C.B. 2003. The disappointing adoption<br />
dynamics of a yield-increasing, low external-input technology: the<br />
case of <strong>SRI</strong> in Madagascar. Agricultural Systems 76: 1085–1100.<br />
Mosier, A.R., Duxbury, J.M., Freney, J.R., Heinemeyer, O.,<br />
Minami, K., Johnson, D.E. 1998. Mitigating agricultural emissions<br />
of methane. Climatic Change 40: 39-80.<br />
Nayak, D.R., Babu, Y.J., Datta, A., Adhya, T.K. 2007. Methane<br />
Oxidation in an Intensively Cropped Tropical Rice Field Soil under<br />
Long-Term Application of Organic Mineral Fertilizers. Journal of<br />
Environmental Quality 36: 1577 -1584.<br />
Nesbitt, H.J. 1997. Topography, climate, and rice production. In:<br />
Rice production in Cambodia. Manila (Philippines): International<br />
Rice Research Institute. Ed: Nesbitt, H.J. p. 15-21.<br />
Nesbitt, H.J. & Phaloeun, C. 1997. Rice-based farming systems. In:<br />
Rice production in Cambodia. Manila (Philippines): International<br />
Rice Research Institute. Ed: Nesbitt, H.J. p. 31-39.<br />
Neue, H.U. 1993. Methane Emission from Rice Fields. Wetland rice<br />
fields may make a major contribution to global warming. Bioscience<br />
43 (7): 466-473.<br />
Neue, H.U. 1997. Fluxes of methane from rice fields and potential<br />
for mitigation. Soil Use and Management 13: 258-267.<br />
Nishimura, A., Sawamoto, T., Akiyama, H., Sudo, S. 2004.<br />
Methane and nitrous oxide emissions from a paddy field with<br />
Japanese conventional water management and fertilizer application.<br />
Global Biochemical Cycles 18: 1-10.<br />
Nishimura, S., Yonemura, S., Sawamoto, T., Shirato, Y.,<br />
Akiyama, H., Sudo, S., Yagi, K. 2008. Effect of land use change<br />
from paddy rice cultivation to upland crop cultivation on soil carbon<br />
budget of a cropland in Japan. Agriculture, Ecosystems and<br />
Environment 125: 9-20.<br />
NORDECO, 2008. Available at internet: www.nordeco.dk Revised<br />
24-04-2008. Visited 8-01-09.<br />
Oberthür, T., White, P.F., Reyes, R.T., Dobermann, A., Sovuthy,<br />
P., Rickmann, J.F. 1997a. Major soils of the rice-growing areas. In:<br />
The Soils used for rice production in Cambodia. A manual for their<br />
identification and management. Ed; White, P.F., Oberthür, R.,<br />
Sovuthy, P. pp: 20-57. Cambodia-IRRI.Australia Project. IRRI,<br />
Manila. Philippines.<br />
Oberthür, T., Dobermann, A., White, P. 2000. The rice soils of<br />
Cambodia. II. Statistical discrimination of soil properties by the<br />
Cambodian Agronomic Soil Classification system. Soil Use and<br />
Management 16: 20-26.<br />
Olk, D.C., Kessel, C.V., Bronson, K.F. 2000. Managing soil<br />
organic matter in rice and nonrice soils: agronomic questions. p 27-<br />
48. In: Carbon and nitrogen dynamics in flooded soils”. Edited by<br />
G.J.D. Kirk and D.C. Olk. pp 188. IRRI, Philippines.<br />
Patrick, W.H.Jr. & Reddy, K.R. 1976. Nitrification-Denitrification<br />
reactions in flooded soils and water bottoms: Dependence on oxygen<br />
supply and ammonium diffusion. J. Environ.Qual. Vol 5 (4): 469-<br />
471.<br />
Pheav, S., Bell, R.W., Kirk, G.J.D., White, P.F. 2005. Phosphorus<br />
cycling in rainfed lowland rice ecosystems on sandy soils. Plant and<br />
Soil 269: 89-98.<br />
Prasad, C.S. 2006. System of Rice Intensification in India.<br />
Innovation history and Institutional Challenges. WWF Project “<br />
Dialogue on water, Food and Environment”. ICRISAT, Patancheru,<br />
Hyderabad. India. p. 77.<br />
Pretty, J. 2000. Can sustainable agriculture feed Africa? New<br />
evidence on progress, processes and impacts. Environment,<br />
Development and Sustainability 1:253-274.<br />
Pretty, J.N., Morison, J.I.L., Hine, R.E. 2003. Reducing food<br />
poverty by increasing agricultural sustainability in developing<br />
countries. Agriculture, Ecosystems and Environment 95: 217-234.<br />
Rajashekhara Rao, B.K. & Siddaramappa, R. 2008. Evaluation of<br />
soil quality parameters in a tropical paddy soil amended with rice<br />
residues and tree litters. European Journal of Soil Biology 44: 334-<br />
340.<br />
Ramesh, K. & Chandrasekaran, B. 2004. Soil Organic Carbon<br />
build-up and dynamics in rice-rice cropping systems. J. Agronomy &<br />
Crop Science 190:21-27.<br />
Röling, N. 1994. Facilitating sustainable agriculture: turning policy<br />
models upside down. In Beyond Farmer First. Rural people’s<br />
knowledge, agricultural research and extension practice. Eds:<br />
Scoones, I. & Thompson, J. Intermediate Technology Publications.<br />
London, UK. pp.245-248.<br />
Röling, N. & van de Fliert, E. 1994. Transforming extension for<br />
sustainable agriculture: The case of Integrated Pest Management in<br />
Rice in Indonesia. Vol 11(2-3): 96-108.<br />
Sasaki, N. 2006. Carbon emissions due to land-use change and<br />
logging in Cambodia: a modelling approach. J For Res 11: 397-403.<br />
Satyanarayana, A. 2004. Correspondence. Rice, research and real<br />
life in the field. In the spirit of science, we should ask why studies<br />
don’t reflect farmers’ experiences. Nature (429): 803.<br />
Satyanarayana, A., Thiyagarajan, T.M., Uphoff, N. 2007.<br />
Opportunities for water saving with higher yield from the system of<br />
rice intensification. Irrig. Sci 25: 99-115.<br />
Schlesinger, W.H. & Andrews, J.A. 2000. Soil respiration and the<br />
global carbon cycle. Biogeochemistry 48: 7-20.<br />
Scoones, I. 1998. Sustainable Rura Livelihoods: A Framework for<br />
Analysis. Institute of Development Studies (IDS) working paper 72.<br />
p. 1-22.<br />
Scoones, I. & Thompson, J. 1994. Knowledge, power and<br />
agriculture – towards a theoretical understanding. In Beyond Farmer<br />
First. Rural people’s knowledge, agricultural research and extension<br />
practice. Eds: Scoones, I. & Thompson, J. Intermediate Technology<br />
Publications. London, UK. pp. 16-31.<br />
SCW, 2006. Atlas of Cambodia: National Poverty and Environment<br />
Maps. Save Cambodia’s Wildlife, Phnom Penn, Cambodia. pp 139<br />
and CD. DANIDA.<br />
Seng, V., Bell, R.W., Willet, I.R., Nesbitt, H.J. 1999. Phosphorus<br />
nutrition of rice in relation to flooding and temporary loss of soilwater<br />
saturation in two lowland soils of Cambodia. Plant and Soil<br />
207: 121-132.<br />
SerCon Ltd. 2001. The Stable Isotope Company. ANCA-GSL.<br />
Users Manual Version 4.0, February 2001.<br />
75
Sheehy, J.E., Peng, S., Dobermann, A., Mitchell, P.L., Ferrer, A.,<br />
Yang, J., Zou, Y., Zhong, X., Huang, J. 2004. Fantastic yields in<br />
the system of rice intensification: fact or fallacy? Field Crops<br />
Research 88: 1-8.<br />
Sinha, S.K & Talati, J. 2007. Productivity impacts of the system of<br />
rice intensification (<strong>SRI</strong>): A case study in West Bengal, India.<br />
Agricultural Water Management 87: 55 – 60.<br />
Singh, N.T. 1984. Green manures as sources of nutrients in rice<br />
production. In: Organic matter and rice. International Rice Research<br />
Institute. Manilla, Phillipines. pp: 217-228.<br />
Stevenson, F.J. & Cole, M.A. 1999. Soil Organic Matter quality and<br />
characterization. In Cycles of Soil. Carbon, Nitrogen, Phosphorus,<br />
Sulfur, Micronutrients. 2 nd edition. John Wiley & Sons, INC. Newy<br />
York, USA. pp: 78-106.<br />
Street, J. E. & Bollich, P.K. 2003. Rice Production. In: In Rice.<br />
Origen, History, Technology and Production. Eds: Smith, C.W. &<br />
Dilday, R.H. John Wiley & Sons, Inc. USA. pp: 271-295.<br />
Stoop, A.W., Uphoff, N., Kassam, A. 2002. A review of agricultural<br />
research issues raised by the system of rice intensification (<strong>SRI</strong>) from<br />
Madagascar: opportunities for improving farming systems for<br />
resource-poor farmers. Agricultural Systems 71: 249-274.<br />
Surridge, C. 2004. Feast or Famine? Nature Vol (428): 360-361.<br />
Tong, L., Yoshida, T., Maeda, T., Kimijima, H. 2007. Effects of<br />
Temperature, Sowing Depth and Soil Hardness on Seedling<br />
Establishment and Yield of Cambodian Rice Direct-seeded in Flood<br />
Paddy Fields. Plant Prod. Sci. 10(1):129-<br />
135.<br />
Tong, L. & Yoshida, T. 2008. Genetic Diversity of Cambodian Rice<br />
Cultivars. Plant Prod. Sci. 11(3): 366-367.<br />
Tripp, R., Wijeratne, H., Piyadasa, V,H. 2005. What should we<br />
expect from Farmer Field Schools? A Sri Lanka Case Study. World<br />
Development Vol 33 (10): 1705-1720.<br />
Tsubo, M., Fukai, S., Tuong, T.P., Ouk, M. 2007. A water balance<br />
model for rainfed lowland rice fields emphasising lateral water<br />
movement within a toposequence. Ecological Modelling 204: 503-<br />
515.<br />
Tsujimoto, Y., Horie, T., Randriamihary, H., Shiraiwa, T.,<br />
Homma, K. 2009. Soil management: The key factors for higher<br />
productivity in the fields utilizing the system of rice intensification<br />
(<strong>SRI</strong>) in the central highland of Madagascar. Agricultural Systems<br />
100: 61-71.<br />
Uphoff, N. 1999. Agroecological Implications of the System of Rice<br />
Intensification (<strong>SRI</strong>) in Madagascar. Environment, Development and<br />
Sustainability 1: 297-313.<br />
Uphoff & Tefy Sainy. Year unknown. COMMENT FAIRE POUR<br />
AVOIR DES PLANTS DE RIZ QUI CROISSENT MIEUX ET QUI<br />
PRODUISENT PLUS INFORMEZ-VOUS ET INFORMEZ LES<br />
AUTRES. Available at internet:<br />
(http://tefysaina.org/manuel<strong>SRI</strong>.pdf)<br />
Soil Survey Staff. 2006. Keys to soil taxonomy. United States<br />
Department of Agriculture. 10 th edition. p. 323.<br />
Vergé, X.P.C., De Kimpe, C., Desjardings, R.L. 2007. Agricultural<br />
production, greenhouse gas emissions and mitigation potential.<br />
Agricultural and Forest Meteorology 142: 255-269.<br />
Wade, L.J., George, T., Ladha, J.K., Singh, U., Bhuiyan, S.I.,<br />
Pandey, S. 1998. Opportunities to manipulate nutrient-by-water<br />
interactions in rainfed lowland rice systems. Field Crops Research<br />
56: 93-112.<br />
Wade, L.J. Fukai, S., Samson, B.K., Ali, A., Mazid, M.A. 1999.<br />
Rainfed lowland rice: physical environment and cultivar<br />
requirements. Field Crops Research 64: 3-12.<br />
Watanabe, I. 1984. Anaerobic decomposition of organic matter in<br />
flooded rice soils. In Organic Matter and rice. International Rice<br />
Research Institute, Manilla, Philippines. pp: 237-258.<br />
Watanabe, A., Yamada, H., Kimura, M. 2005. Analysis of<br />
temperature effects on seasonal and interannual variation in CH4<br />
emissions from rice-planted pots. Agriculture, Ecosystems and<br />
Environment 105: 439-443.<br />
Wassmann, R., Neue, H.U., Lantin, R.S., Buendia, L.V.,<br />
Rennenberg, H. 2000. Characterization of methane emissions from<br />
rice fields in Asia. I. Comparison among field sites in five countries.<br />
Nutrient Cycling in Agroecosystems 58: 1-12.<br />
West, T.O. & Post, W.M. 2002. Soil Organic Carbon sequestration<br />
rates by tillage and crop rotation: A global data analysis. Soil Sci.<br />
Soc. Am. J. 66: 1930-1946.<br />
White, P., Dobermann, A., Oberthür, T., Ros, C. 2000. The rice<br />
soils of Cambodia. I. Soil classification for agronomists using the<br />
Cambodian Agronomic Soil Classification system. Soil Use and<br />
Management 16: 12-19.<br />
White, P.F. & Öberthür, T. 1997. Geomorphology and Hydrology<br />
of Cambodian Ricelands. In: The Soils used for rice production in<br />
Cambodia. A manual for their identification and management. Ed;<br />
White, P.F., Oberthür, R., Sovuthy, P. pp: 3-8. Cambodia-<br />
IRRI.Australia Project. IRRI, Manila. Philippines.<br />
White, P.F., Oberthür, T., Sovuthy, P. 1997a. Soils and rice. In:<br />
Rice production in Cambodia. Manila (Philippines): International<br />
Rice Research Institute. Ed: Nesbitt, H.J. p. 21-31.<br />
White, P.F., Reyes, R.T., Oberthür, T., Hobermann. 1997b. Key<br />
to the major soils of the rice-growing areas. In: The Soils used for<br />
rice production in Cambodia. A manual for their identification and<br />
anagement. Ed; White, P.F., Oberthür, R., Sovuthy, P. pp: 15-19.<br />
Cambodia-IRRI.Australia Project. IRRI, Manila. Philippines.<br />
White, P.F. & Seng, V. 1997. Response of rainfed lowland rice to<br />
phosphorus fertiliser application in Cambodia. In: ACIAR<br />
Proceeding No. 77: Breeding Strategies for rainfed lowland rice in<br />
drought-prone environments. Eds. ACIAR. pp. 202-208. Australian<br />
Centre for International Agricultural Research, Canberra, Australia.<br />
Yagi, K. & Minami, K. 1990. Effect of Organic Matter Application<br />
on Methane Emission from Some Japanese Paddy Fields. Soil Sci.<br />
Plant Nutr. 36 (4): 599-610.<br />
Yamah, A. 2002. The practice of the System of Rice Intensification<br />
in Sierre Leone. A presentation held at the International Conference<br />
"Assessments of the System of Rice Intensification (<strong>SRI</strong>)," Sanya,<br />
China, April 1-4, 2002.<br />
Available at Internet: http://ciifad.cornell.edu/sri/proc1/sri_24.pdf<br />
Yan, X., Akiyama, H., Yagi, K., Akimoto, H. 2009. Global<br />
estimations of the inventory and mitigation potential of methane<br />
emissios from rice cultivation conducted using the 2006<br />
Intergovernmental Panel on Climate Change Guidelines. Global<br />
Biochemical Cycles 23: 1-15.<br />
Yoshida, S. 1981. Growth and development of the rice plant. In:<br />
Fundamentals of rice crop science. International Rice Research<br />
Institute. Manilla, Philippines. pp: 1- 63.<br />
76
Yue, J., Shi, Y., Liang, W., Wu, J., Wang, C., Huang, G. 2005.<br />
Methane and Nitrous Oxide emissions from rice field and related<br />
microorganism in black soil, northestern China. Nutrient Cycling in<br />
Agroecosystems 73: 293-301.<br />
Xu, X., Tian, H., Hui, D. 2008. Convergence in the relationship of<br />
CO2 and N2O exchanges between soil and atmosphere within<br />
terrestrial ecosystems. Global Change Biology 14: 1651-1660.<br />
Zou, J., Huang, Y., Jiang, J., Zheng, X., Sass, R.L. 2005. A 3-year<br />
field measurement of methane and nitrous oxide emissions from rice<br />
paddies in China: Effects of water regime, crop residue, and fertilizer<br />
application. Global Biogeochemical Cycles 19: 1-9.<br />
Zou, J., Huang, Y., Qin, Y., Liu, S., Shen, Q., Pan, G., Lu, Y.,<br />
Liu, Q. 2009. Changes in fertilizer-induced direct N2O emissions<br />
from paddy fields during rice-growing season in China between<br />
1950s and 1990s. Global Change Biology 15: 229-242.<br />
77
APPENDICES<br />
APPENDIX A. Name, village and sex of interviewed farmers.<br />
Name of farmer Village Sex<br />
Ban Bear Chambork (COP) M<br />
Huy Ben Chambork (COP) M<br />
Hut Sarmean Kan Dach (COP) M<br />
Sun Sengly Kan Dach (COP) F<br />
Lek Vuthy Prey Svay (COP) M<br />
Hom Hort Prey Svay (COP) F<br />
Lajh Larch Prey Svay (COP) M<br />
Uong Venon Prey Svay (COP) M<br />
Chhean Chorn Prey Svay (COP) F<br />
Say Srony Pear Rong (COP) M<br />
Cheang Him Pear Rong (COP) F<br />
Porn Hi Pear Rong (COP) F<br />
Chuom Cheat Pear Rong (COP) M<br />
Sean Suong Pear Rong (COP) M<br />
Chorn Choung Pear Rong (COP) F<br />
Yang Mon Sar Loung (KR) F<br />
Hi Rum Sar Loung (KR) F<br />
Sory Pean Sar Loung (KR) F<br />
Reum Seab Sam Rong (KR) M<br />
Khim Khorn Sam Rong (KR) M<br />
Yorn Sambath Sam Rong (KR) M<br />
Vorn Savet Sam Rong (KR) F<br />
Hr Chek Sam Rong (KR) F<br />
Yean Yenon Beuny AngChaj (KR) M<br />
Khorn Euen Doung Veal (KR) M<br />
Earn Art Doung Veal (KR) M<br />
Chhun March Doung Veal (KR) F<br />
Meas Oun Doung Veal (KR) F<br />
Pros Yet Doung Veal (KR) F<br />
Yan Kim Chheng Doung Veal (KR) F<br />
COP = Chorng Om Pil commune KR = Kdeuon Reay commune<br />
78
APPENDIX B. Soil sampling methodology.<br />
Procedure: The centre of each field was located and marked with a bamboo stick and thereafter the<br />
other sampling locations were plotted. 19 subsamples were taken from each field in the same star<br />
shaped pattern to form one composite sample for each field. 19 points were chosen due to achieve a<br />
systematic sampling procedure for all 30 fields which were shaped very differently. The 19 dotted<br />
star shape pattern coped very well with all field sizes and shapes and helped increase the accuracy<br />
of the composite sample for each field. As the fields were very heterogeneous the 19 star systems<br />
also covers all areas of the field. It would also have been accessible to sample less than 19<br />
subsamples for each field however the level of accuracy is increased with more subsamples.<br />
A vertical core sample from the topsoil/plough layer, 20 cm, was collected with a stainless steel<br />
auger tube fabricated at the National School of Agriculture at Preak Leap, Cambodia. The steel tube<br />
auger is 3 cm wide and the tube is 50 cm long. At the top is located a handle in order to push the<br />
tube into the soil.<br />
Each subsample was sampled by pushing the tube perpendicular down through present water into<br />
the soil. Each subsample consisted of 240 cm 3 soil incl. present stones and plant residues.<br />
In order to be able to push the soil out of the tube a small steel spoon was used to press out the soil<br />
and then collected in plastic bags. After sampling one field the auger tube and the metal spoon were<br />
cleaned with water and then rinsed with rice alcohol 90% vol.<br />
79
APPENDIX C. <strong>SRI</strong> farmer questionnaire.<br />
1. General information<br />
Sample Number:....................... Date:.......................................................<br />
Village:..................................................................................................................................<br />
Commune:..............................................................................................................................<br />
2. Personal information<br />
2.1 Name of farmer....................................... Sex(M/F): ......................<br />
Age:……………………..<br />
2.2 Total number of members in your household: ...........................................................<br />
2.3 Your annual average income per household (Riel):<br />
From Rice………............ From Vegetables………………. Chicken and duck raising……….<br />
Cattle and Pig raising………............ Other………………………………………………..<br />
3. Agricultural information<br />
3.1 Total land area (ha/acres):..................... How big is your <strong>SRI</strong> field?(ha/acres)……………<br />
Total land area with conventional rice (ha/acres):.......................................................................<br />
3.2 Animals<br />
Total<br />
number<br />
Pig Cow Buffalo Chicken Duck Horse<br />
Other………………<br />
……………………<br />
3.3 What rice cultivar/variety do you use? ...................................................................................<br />
3.4 How many kg of seeds do you use for your sri field?.............................................................<br />
3.6 How many kg seed you use for traditional rice?....................................................................<br />
3.7 How old is the <strong>SRI</strong> rice in this field (days)?............................................................................<br />
3.8 What <strong>SRI</strong> techniques do you apply?........................................................................................<br />
……………………………………………………………………………………………………..<br />
4. What type of fertilizer do you apply to your <strong>SRI</strong> field?<br />
80
Type How much do you<br />
apply to your <strong>SRI</strong> field<br />
(kg)?<br />
Compost<br />
Green manure<br />
Chemical fertilizer<br />
How many times per year?<br />
What time of the year?<br />
5. How do you make your compost? Animal manure□ Crop residues□<br />
How many years have you<br />
applied to this field?<br />
Kitchen residues□ Leaves □ Other………………………………………………<br />
6. Do you use any chemical pesticides? □ Yes □ No<br />
If yes what kind and how much?.......................................................................................<br />
7. Do you want to continue with <strong>SRI</strong> next year: Yes No <br />
If yes why?........................................................................................................................................<br />
8. How big an area will you plant with <strong>SRI</strong> next year?..............................................................<br />
9. What did your wife/husband think about <strong>SRI</strong> when you began working with <strong>SRI</strong>?<br />
Very satisfied Satisfied Not satisfied <br />
10. What does your wife/husband think about <strong>SRI</strong> now?<br />
Very satisfied Satisfied Not satisfied <br />
11. Have you shared your <strong>SRI</strong> knowledge with your neighbor? Yes No <br />
If yes how many?...........................................................................................................................<br />
81
APPENDIX D. Soil analysis results.<br />
Farmers pH KCL Total C % Total N % C:N<br />
Ban Bear 4,6 0,6475 0,07056 9,18<br />
Huy Ben 4,5 0,3044 0,04502 6,76<br />
Hut Sarmean 5,1 0,4003 0,05427 7,38<br />
Sun Sengly 4,8 0,29 0,04123 7,03<br />
Lek Vuthy 4,7 0,2969 0,04483 6,62<br />
Hom Hort 4,2 0,3851 0,05059 7,61<br />
Lajh Larch 4,5 0,2847 0,03935 7,24<br />
Uong Venon 5,2 0,3699 0,04747 7,79<br />
Chhean Chorn 5,2 0,2636 0,03951 6,67<br />
Say Srony 3,9 0,319 0,04343 7,35<br />
Cheang Him 4 0,3268 0,04704 6,95<br />
Porn Hi 3,9 0,4255 0,0554 7,68<br />
Chuom Cheat 4,1 0,4194 0,05728 7,32<br />
Sean Suong 4,2 0,4363 0,05575 7,83<br />
Chorn Choung 4,4 0,4142 0,05546 7,47<br />
Yang Mon 5,3 0,3155 0,04304 7,33<br />
Hi Rum 4,2 0,2809 0,04352 6,45<br />
Sory Pean 5,7 0,2244 0,03948 5,68<br />
Reum Seab 4,3 0,3761 0,04968 7,57<br />
Khim Khorn 4,5 0,3029 0,04305 7,04<br />
Yorn Sambath 4,5 0,4174 0,04995 8,36<br />
Vorn Savet 4,2 0,2795 0,04174 6,7<br />
Hr Chek 5,5 0,2859 0,04625 6,18<br />
Yean Yenon 3,9 0,3161 0,04705 6,72<br />
Khorn Euen 4,4 0,2759 0,03615 7,63<br />
Earn Art 4,6 0,3188 0,04529 7,04<br />
Chhun March 4,4 0,2425 0,03981 6,09<br />
Meas Oun 4,5 0,2459 0,03694 6,66<br />
Pros Yet 4,5 0,1761 0,02887 6,1<br />
Yan Kim Chheng 4 0,2524 0,03904 6,47<br />
Average<br />
Standard<br />
4,53 0,3297967 0,0459017 7,1<br />
deviation 0,23 0,0894943 0,0080691 0,72<br />
82
APPENDIX E. LIVELIHOOD ASSESTS.<br />
Personal information on the interviewed farmers.<br />
Name of farmer Village Sex<br />
Age<br />
(years)<br />
Members in<br />
HH<br />
Total income<br />
$<br />
Ban Bear Chambork (COP) M 33 6 1329<br />
Huy Ben Chambork (COP) M 65 2 256<br />
Hut Sarmean Kan Dach (COP) M 56 6 732<br />
Sun Sengly Kan Dach (COP) F 39 4 707<br />
Lek Vuthy Prey Svay (COP) M 53 6 683<br />
Hom Hort Prey Svay (COP) F 51 5 1098<br />
Lajh Larch Prey Svay (COP) M 58 7 146<br />
Uong Venon Prey Svay (COP) M 44 7 366<br />
Chhean Chorn Prey Svay (COP) F 44 3 98<br />
Say Srony Pear Rong (COP) M 53 8 1024<br />
Cheang Him Pear Rong (COP) F 43 4 122<br />
Porn Hi Pear Rong (COP) F 52 5 317<br />
Chuom Cheat Pear Rong (COP) M 28 5 610<br />
Sean Suong Pear Rong (COP) M 35 4 756<br />
Chorn Choung Pear Rong (COP) F 21 2 488<br />
Yang Mon Sar Loung (KR) F 38 5 1805<br />
Hi Rum Sar Loung (KR) F 42 4 598<br />
Sory Pean Sar Loung (KR) F 33 6 963<br />
Reum Seab Sam Rong (KR) M 49 3 280<br />
Khim Khorn Sam Rong (KR) M 40 6 976<br />
Yorn Sambath Sam Rong (KR) M 34 4 488<br />
Vorn Savet Sam Rong (KR) F 30 4 537<br />
Hr Chek Sam Rong (KR) F 36 4 732<br />
Yean Yenon Beuny AngChaj (KR) M 46 4 171<br />
Khorn Euen Doung Veal (KR) M 38 6 683<br />
Earn Art Doung Veal (KR) M 52 7 2927<br />
Chhun March Doung Veal (KR) F 27 5 500<br />
Meas Oun Doung Veal (KR) F 53 3 890<br />
Pros Yet Doung Veal (KR) F 25 6 561<br />
Yan Kim Chheng Doung Veal (KR) F 50 6 659<br />
Average 42,27 4,9 716,67<br />
Stdev + (-)10,85 + (-)1 ,52 + (-) 561,07<br />
COP = Chorng Om Pil commune KR = Kdeuon Reay commune<br />
Percentage of households with different domestic animals and the amount per household.<br />
Pigs Cows Buffaloes Chickens Ducks Fish<br />
% of Households 37 57 53 90 30 33<br />
Per Household 4 2 2 8 5 405<br />
83
Type of fertilizers used by farmers with amount, application per year and total history of<br />
application.<br />
Applied materials % of farmers Kg/m 2<br />
# of applications year -<br />
1<br />
Years of<br />
application<br />
Compost 53,33 0.33 + (-) 0.49 1,4 + (-) 0.63 5 + (-) 10<br />
Green manure 73,33 1.90 + (-) 7.24 1.45 + (-) 0.67 9 + (-) 11.79<br />
Organic fertilizers 13,33 0.01 + (-) 0.02 1 1<br />
Chemical fertilizers 13,33 0.004 + (-) 0.02 1.25 + (-) 0.5 7.67 + (-) 10.69<br />
Percentage of farmers combing different kinds of fertilizers.<br />
Applied materials % of total # of farmers % of group<br />
Compost and Green<br />
manure<br />
20 42,67<br />
Compost and Organic<br />
fertilizers<br />
Green manure and<br />
organic fertilizers<br />
Green manure and<br />
chemical fertilizers<br />
Compost, green<br />
manure and organic<br />
fertilizer<br />
Compost, green<br />
manure and chemical<br />
fertilizer<br />
10 21,43<br />
3,33 7,14<br />
6,67 14,29<br />
3,33 7,14<br />
3,33 7,14<br />
Rice varieties.<br />
Percentages in brackets indicate the percentage of farmers who cultivated these varieties.<br />
Dorn Neb (80%) Sorsor Rang Cheay Kum Srov Phakarmodul Kror Ob<br />
Mrom (70%) Neang Meas Torng Chhuk Chheing Ses Sen Pidao Ka Prom<br />
Somaly (45%) Kro Orb Phka Ten Leung Tek Kror Ya Orn Lov<br />
Kror Sang<br />
Phmor Moung Many Pdao Pen Neang Sar Thmor Teab<br />
Neang Kong Pkar Mlis Orsar Kro Ourb UA Moung Mong Pdaov<br />
Chom Reuom Ornoub Thom Bam Larr Chmar Tot Sa Ang E Aer<br />
84
3<br />
2<br />
1<br />
Combination of <strong>SRI</strong> techniques within the target farming community.<br />
Natural fertilizers cover composts and leafy/green manures.<br />
1<br />
1<br />
1<br />
1<br />
1<br />
1<br />
1<br />
Farmers' <strong>SRI</strong> techniques<br />
4<br />
10<br />
2<br />
Natural fertilizers and plant in lines<br />
Natural fertilizers, 1 seedling in lines,<br />
regular weeding<br />
Natural fertilizers, 1 seedling in lines<br />
Leveling of field,natural fertilizers, 1<br />
seedling in lines, and general care taking<br />
1 seedling in lines, plant carefully, use<br />
natural fertilizer, young seedling<br />
1, 2 or 3 old seedlings per hill, natural<br />
fertilizers<br />
1 seedling per hill, natural fertilizers<br />
Plough twice prior to transplanting,<br />
natural fertilizers, 1 seedling per hill<br />
Plough twice, 1 seedling per hill, natural<br />
and chemical fertilizers<br />
Regular weeding, 1 seedling in lines, use<br />
less water, natural fertilizers<br />
1 seedling per hill<br />
Natural fertilizers<br />
85
Leafy manures from 5 common trees. The ILFARM plans to plant more trees of especially the five mentioned here but also other<br />
multipurpose species.<br />
Scientific name English name Cambodian name Use Location<br />
Cassia siamea Cassia Angkanh<br />
Sesbania<br />
bispinosa & S.<br />
grandifora<br />
Acacia<br />
auriculiformus<br />
Azadicrachta<br />
indica<br />
Leucaena<br />
leucacephala<br />
Sesban Angkea Dey<br />
Acacia Acasia<br />
Neem Sdao<br />
Leucaena Kamthuthet<br />
Fuel wood, fencing and<br />
animal feed<br />
Fuel wood, fencing,<br />
animal feed, construction<br />
and green manure<br />
Construction and fuel<br />
wood<br />
Vegetable, traditional<br />
medicine, botanical<br />
pesticide, construction,<br />
green manure<br />
Fuel wood, fencing,<br />
animal feed, vegetable,<br />
green manure<br />
Homestead, along roads,<br />
pagoda gardens<br />
Homestead and along<br />
roads<br />
Homestead, along roads,<br />
pagoda gardens<br />
Homestead, rice dikes<br />
bordering rice fields<br />
Homestead and along<br />
roads<br />
86<br />
Years of<br />
production<br />
30 years<br />
5-6 years<br />
Until death<br />
80 years<br />
20 years
APPENDIX F. Interview with Ma Veasna project coordinator of the<br />
ILFARM project.<br />
Held 18th of October 2008 at the CEDAC office in Prey Veng city, Prey Veng province, Cambodia.<br />
Marc Dumas-Johansen: How many <strong>SRI</strong> concepts do farmers follow in average and which ones?<br />
Ma Veasna: Farmers normally use big seedlings for transplanting, leveling of land, use more<br />
compost than in traditional fields, planting the rice plants in strait lines and do weeding. Most<br />
farmers carry out all these techniques. Good farmers do like this. Lazy farmers do not do so much.<br />
Marc Dumas-Johansen: What is the disadoption rate of <strong>SRI</strong> farmers? How many farmers will not<br />
practise <strong>SRI</strong> after some years?<br />
Ma Veasna: Most farmers stop with <strong>SRI</strong> after three to four years because they are used to working<br />
with traditional rice farming and then they mix the two concepts and stop with <strong>SRI</strong>. <strong>SRI</strong> also means<br />
more work for them, so they gradually go back to traditional rice farming.<br />
Marc Dumas-Johansen: What do farmers feed their animals?<br />
Ma Veasna: Grass and rice straw. They also eat tree leaves. This is mostly for cows.<br />
Marc Dumas-Johansen: How many <strong>SRI</strong> farmers are there in the in total in the project and how<br />
many in each commune?<br />
Ma Veasna: There are 160 farmers in the three target communes but the number is growing.<br />
Chourn Ampol commune has 25 <strong>SRI</strong> farmers and Kdoung Reay commune has 70-78 sri farmers.<br />
The most successful farmers are found in this commune. The total land of <strong>SRI</strong> is 8 ha in these two<br />
communes where farmers are medium and small farmers..<br />
Marc Dumas-Johansen: Where do farmers get their seeds from?<br />
Ma Veasna: They use their own seeds and save seeds from last year’s harvest. They keep the seed<br />
stocks from their parents. Some farmers buy seeds from outside.<br />
Marc Dumas-Johansen: What trees are used in the project and how many?<br />
Ma Veasna: 500.000 trees in total will be mobilized by the project. Multiple use trees and fruit trees<br />
will be used.<br />
87