XPS and laser Raman analysis of hydrogenated amorphous carbon ...
XPS and laser Raman analysis of hydrogenated amorphous carbon ...
XPS and laser Raman analysis of hydrogenated amorphous carbon ...

You also want an ePaper? Increase the reach of your titles
YUMPU automatically turns print PDFs into web optimized ePapers that Google loves.
Fig. 4. A typical <strong>laser</strong> <strong>Raman</strong> spectrum (514.5 nm excitation) from<br />
y1<br />
an a-C:H film showing the prominent G peak (1580 cm ) <strong>and</strong> small-<br />
y1<br />
er shoulder (1350 cm ) due to the D b<strong>and</strong>. The fitted curves are<br />
also shown.<br />
2 3<br />
is that the sp :sp C ratio alone is not a reliable estimate<br />
3<br />
<strong>of</strong> the film structure or properties, since the sp C could<br />
be bonded to either C or H.<br />
3<br />
Fig. 3 also shows a comparison <strong>of</strong> the sp values that<br />
are obtained using the two-curve fitting method <strong>of</strong> Leung<br />
et al. w9x. 3<br />
By comparison with sp values derived from<br />
the three-curve fitting method, these values are less<br />
precise, had greater day-to-day variability, <strong>and</strong> are not<br />
consistent with other experimental findings, such as the<br />
trends with hardness <strong>and</strong> H content. Also, the two-curve<br />
data cannot be rationalised using the theoretical models<br />
<strong>of</strong> film growth mentioned above. This suggests that the<br />
three-curve fitting method is a more precise way <strong>of</strong><br />
2 3<br />
obtaining sp :sp ratios than previous methods.<br />
A typical <strong>laser</strong> <strong>Raman</strong> spectrum from an a-C:H film<br />
is given in Fig. 4, showing the prominent G b<strong>and</strong><br />
y1<br />
(centred approximately 1580 cm ) <strong>and</strong> a smaller<br />
underlying D b<strong>and</strong> shoulder (centred approximately<br />
y1 1350 cm ). The presence <strong>of</strong> the D peak in most <strong>of</strong> the<br />
spectra from these a-C:H films prohibited the use <strong>of</strong> a<br />
2 3<br />
single BWF lineshape to quantify the sp :sp ratio.<br />
However, some <strong>of</strong> the films that were grown at the<br />
lowest bias values gave spectra with only one G peak.<br />
These could be fitted to a BWF lineshape, but gave Q<br />
18<br />
values <strong>of</strong> y1=10 , so that 1yQ;0. This suggests that<br />
the BWF fitting method is not appropriate for hydrogen<br />
containing a-C:H films due to their highly symmetrical<br />
G peak shape. A possible reason for this is that the<br />
presence <strong>of</strong> H within the films stabilises graphitic<br />
clusters by terminating dangling bonds on the aromatic<br />
rings.<br />
Tamor et al. w17x state that for their spectra two<br />
Gaussians functions faithfully reproduced the peak structure,<br />
<strong>and</strong> therefore more elaborate line shapes were not<br />
needed. Following this procedure, the individual G <strong>and</strong><br />
D peaks from our spectra were fitted with Gaussian line<br />
shapes to quantify their respective FWHM <strong>and</strong> peak<br />
heights. A plot <strong>of</strong> the ratio <strong>of</strong> the intensities <strong>of</strong> the D<br />
J. Filik et al. / Diamond <strong>and</strong> Related Materials 12 (2003) 974–978<br />
977<br />
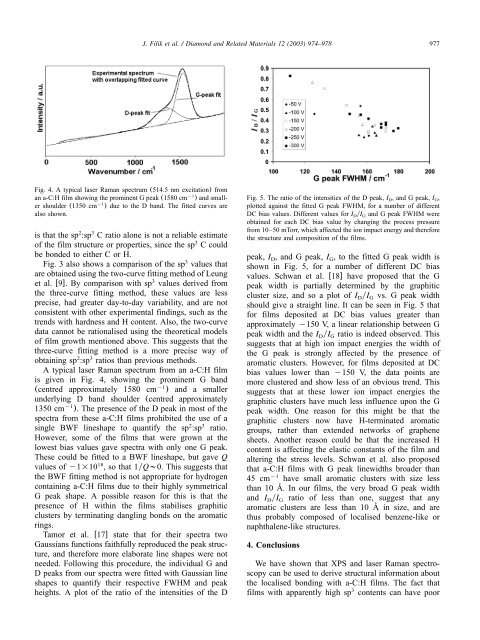
Fig. 5. The ratio <strong>of</strong> the intensities <strong>of</strong> the D peak, I D, <strong>and</strong> G peak, I G,<br />
plotted against the fitted G peak FWHM, for a number <strong>of</strong> different<br />
DC bias values. Different values for IDyIG <strong>and</strong> G peak FWHM were<br />
obtained for each DC bias value by changing the process pressure<br />
from 10–50 mTorr, which affected the ion impact energy <strong>and</strong> therefore<br />
the structure <strong>and</strong> composition <strong>of</strong> the films.<br />
peak, I , <strong>and</strong> G peak, I , to the fitted G peak width is<br />
D G<br />
shown in Fig. 5, for a number <strong>of</strong> different DC bias<br />
values. Schwan et al. w18x have proposed that the G<br />
peak width is partially determined by the graphitic<br />
cluster size, <strong>and</strong> so a plot <strong>of</strong> I yI vs. G peak width<br />
D G<br />
should give a straight line. It can be seen in Fig. 5 that<br />
for films deposited at DC bias values greater than<br />
approximately y150 V, a linear relationship between G<br />
peak width <strong>and</strong> the I yI ratio is indeed observed. This<br />
D G<br />
suggests that at high ion impact energies the width <strong>of</strong><br />
the G peak is strongly affected by the presence <strong>of</strong><br />
aromatic clusters. However, for films deposited at DC<br />
bias values lower than y150 V, the data points are<br />
more clustered <strong>and</strong> show less <strong>of</strong> an obvious trend. This<br />
suggests that at these lower ion impact energies the<br />
graphitic clusters have much less influence upon the G<br />
peak width. One reason for this might be that the<br />
graphitic clusters now have H-terminated aromatic<br />
groups, rather than extended networks <strong>of</strong> graphene<br />
sheets. Another reason could be that the increased H<br />
content is affecting the elastic constants <strong>of</strong> the film <strong>and</strong><br />
altering the stress levels. Schwan et al. also proposed<br />
that a-C:H films with G peak linewidths broader than<br />
y1 45 cm have small aromatic clusters with size less<br />
than 10 A. ˚ In our films, the very broad G peak width<br />
<strong>and</strong> IDyIG ratio <strong>of</strong> less than one, suggest that any<br />
aromatic clusters are less than 10 A˚ in size, <strong>and</strong> are<br />
thus probably composed <strong>of</strong> localised benzene-like or<br />
naphthalene-like structures.<br />
4. Conclusions<br />
We have shown that <strong>XPS</strong><strong>and</strong> <strong>laser</strong> <strong>Raman</strong> spectroscopy<br />
can be used to derive structural information about<br />
the localised bonding with a-C:H films. The fact that<br />
3<br />
films with apparently high sp contents can have poor