GUIDE TO PRODUCTION FORECAST IN R3
- No tags were found...

Create successful ePaper yourself
Turn your PDF publications into a flip-book with our unique Google optimized e-Paper software.
DECL<strong>IN</strong>E CURVE<br />
ANALYSIS<br />
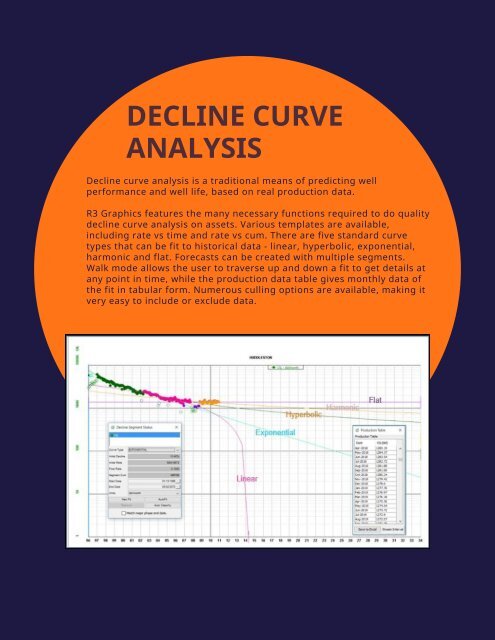
Decline curve analysis is a traditional means of predicting well<br />
performance and well life, based on real production data.<br />
<strong>R3</strong> Graphics features the many necessary functions required to do quality<br />
decline curve analysis on assets. Various templates are available,<br />
including rate vs time and rate vs cum. There are five standard curve<br />
types that can be fit to historical data - linear, hyperbolic, exponential,<br />
harmonic and flat. Forecasts can be created with multiple segments.<br />
Walk mode allows the user to traverse up and down a fit to get details at<br />
any point in time, while the production data table gives monthly data of<br />
the fit in tabular form. Numerous culling options are available, making it<br />
very easy to include or exclude data.