978.full.pdf
978.full.pdf
978.full.pdf

Create successful ePaper yourself
Turn your PDF publications into a flip-book with our unique Google optimized e-Paper software.
Plant Physiol. (1983) 72, 978-988<br />
0032-0889/83/72/0978/1 1/$00.50/0<br />
Effect of Cold Acclimation on Intracellular Ice Formation in<br />
Isolated Protoplastst<br />
MICHAEL F. DOWGERT AND PETER L. STEPONKUS<br />
Department ofAgronomy, Cornell University, Ithaca, New York 14853<br />
ABSTRACT<br />
When cooled at rapid rates to temperatures between -10 and -30°C,<br />
the incidence of intracellular ice formation was less in protoplasts enzymically<br />
isolated from cold acclimated leaves of rye (Secale cereale L. cv<br />
Puma) than that observed in protoplasts isolated from nonacclimated<br />
leaves. The extent of supercooling of the intracellular solution at any given<br />
temperature increased in both nonacclimated and acclimated protoplasts<br />
as the rate of cooling increased. There was no unique relationship between<br />
the extent of supercooling and the incidence of intracellular ice formation<br />
in either nonacclimated or acclimated protoplasts. In both nonacclimated<br />
and acclimated protoplasts, the extent of intracellular supercooling was<br />
snimlar under conditions that resulted in the greatest difference in the<br />
incidence of intracellular ice formation-cooling to -15 or -20°C at rates<br />
of 10 or 16'C/mitute. Further, the hydraulic conductivity determined<br />
during freeze-induced dehydration at -5°C was similar for both nonacclimated<br />
and acclimated protoplasts. A major distinction between nonacclimated<br />
and acclimated protoplasts was the temperature at which nucleation<br />
occurred. In nonacclimated protoplasts, nucleation occurred over a relatively<br />
narrow temperature range with a median nucleation temperature of<br />
-15°C, whereas in acclimated protoplasts, nucleation occurred over a<br />
broader temperature range with a median nucleation temperature of<br />
-42°C. We conclude that the decreased incidence of intracellular ice<br />
formation in acclimated protoplasts is attributable to an increase in the<br />
stability of the plasma membrane which precludes nucleation of the supercooled<br />
intracellular solution and is not attributable to an increase in<br />
hydraulic conductivity of the plasma membrane which purportedly precludes<br />
supercooling of the intracellular solution.<br />
It is commonly observed that the incidence of intracellular ice<br />
formation is a function of the cooling rate. As early as 1886,<br />
Muller-Thurgau (20) observed that rapid cooling resulted in intracellular<br />
ice formation whereas during slow cooling ice crystals<br />
were confined to extracellular spaces. Similar observations were<br />
reported in 1897 by Molisch (19). Since that time, a cooling rate<br />
dependence of intracellular ice formation has been demonstrated<br />
in a diverse range of biological cell types (17).<br />
Levitt and Scarth (10) were among the first to offer a mechanistic<br />
explanation for the cooling rate dependence of intracellular<br />
ice formation. They reasoned that intracellular ice formation<br />
occurs only if the cytoplasm cools faster than its freezing point is<br />
lowered by solute concentration due to water efflux. They concluded<br />
that the rate of water efflux is limiting at rapid cooling<br />
'This material is, in part, based on work supported by the National<br />
Science Foundation under Grant PCM-8012688 and the United States<br />
Department of Energy under Contract DE-AC02-81ER 10917. Department<br />
of Agronomy Series Paper 1450.<br />
Received for publication December 27, 1982 and in revised form April 8, 1983<br />
rates; and the higher the permeability to water, the lower the<br />
probability of intracellular ice formation. Further, because the<br />
deplasmolysis time of cells in cold hardy tissues was less than that<br />
for cells in nonhardy tissues, they inferred that water permeability<br />
increased following cold acclimation and that the incidence of<br />
intracellular ice formation would be less in acclimated tissues. In<br />
1938, Siminovitch and Scarth (23) experimentally demonstrated<br />
that intracellular ice formation occurs less frequently in hardy<br />
tissues than nonhardy tissues when cooled at comparable rates.<br />
They too attributed this difference to the purported increase in<br />
water permeability of the plasma membrane following cold acclimation<br />
as proposed by Levitt and Scarth (10).<br />
Although this concept has been widely accepted and frequently<br />
cited, direct experimental verification of an increase in water<br />
permeability following cold acclimation has been lacking, and the<br />
proposed diminished extent of supercooling in acclimated tissues<br />
has never been experimentally documented during a freeze-thaw<br />
cycle. In fact, there have been few experimental studies of the<br />
relationship between water permeability and cold acclimation.<br />
Sukumaran and Weiser (29) determined water permeability constants<br />
by following the time course of leaf protoplast expansion<br />
during deplasmolysis, which is the same technique used by Levitt<br />
and Scarth (10), and found no difference in the water permeability<br />
of hardy and nonhardy potato cultivars. McKenzie et al. (18)<br />
determined a 'permeability ratio,' ie. the diffusive flux of tritiated<br />
water in live tissue relative to that of dead tissue, for cortex cells<br />
of Cornus stolonifera. The permeability ratio decreased (a higher<br />
permeability) during the initial photoperiodically induced increase<br />
in hardiness from -3 to - 12°C but changed little, if any, during<br />
subsequent acclimation to -65°C. Stout et al. (28), used a nuclear<br />
magnetic resonance technique to determine the rate of ice formation<br />
and diffusional water permeability in Hedera helix. They<br />
concluded that water permeability was not limiting in nonacclimated<br />
tissues.<br />
In spite of these reports, Levitt (9) has steadfastly championed<br />
the notion that the lower incidence of intracellular ice formation<br />
in acclimated tissues is the result of an increase in water permeability<br />
of the plasma membrane. This is disconcerting because the<br />
original report (10) acknowledged that 'on account of the complications<br />
in the methods so far used, the relation between water<br />
permeability and hardiness is not completely worked out. Some<br />
more satisfactory procedure will have to be evolved in order to get<br />
accurate results.' Similarly, neither the method used by McKenzie<br />
et al. (18) nor that of Stout et al. (28) is unequivocal.<br />
More importantly, however, the mechanistic interpretation of<br />
intracellular ice formation proposed by Levitt and Scarth (10) did<br />
not consider the manner by which the supercooled intracellular<br />
solution was nucleated. Our interpretation of their analysis is that<br />
the extent of supercooling of the intracellular solution was considered<br />
the primary determinant of intracellular ice formation and<br />
that any degree of supercooling would result in intracellular ice<br />
formation. A more appropriate explanation for intracellular ice<br />
978
INTRACELLULAR ICE FORMATION IN ISOLATED PROTOPLASTS<br />
Table I. Incidence of Intracellular Ice Formation in Nonacclimated and Acclimated Protoplasts as a Function of<br />
Cooling Rate and Minimum Temperature Imposed<br />
-5<br />
-10<br />
-15<br />
Cooling Rate ( C/min)<br />
3.1 5 10 16<br />
non-acc. acc. non-acc. acc. non-acc. acc. non-acc. acc.<br />
15% 0% 23% 0% 0% 0% 14% 0%<br />
(7/46) (0/24) (6/26) (0/23) (0/20) (0/18) (4/28) (0/20)<br />
18% 19% 24% 8% 41% 31% 86% 11%<br />
(9/50) (4/21) (8/34) (2/25) (7/17) (5/16) (19/22) (2/18)<br />
5% 12% 39% 19% 63% 19% 87% 38%<br />
(1/22) (2/17) (7/18) (3/16) (10/16) (4/21) (26/30) (6/16)<br />
t -20 24% 33% 58% 16% 92% 18% 96% 30%<br />
' -20<br />
E- (5/21) (8/24) (15/26) (3/19) (12/13) (4/22) (22/23) (12/40)<br />
-30<br />
-40<br />
-50<br />
16% 33% 50% 6% 81% 36% 95% 43%<br />
(3/19) (3/9) (12/24) (1/16) (17/21) (5/14) (19/20) (6/14)<br />
20% 21% 52% 45% 95% 79% 97% 86%<br />
(4/20) (4/19) (12/23) (13/29) (21/22) (31/39) (32/33) (19/22)<br />
15% 28% 45% 61% 95% 84% 100% 96%<br />
(3/20) (9/32) (10/22) (14/23) (18/19) (27/32) (19/19) (24/25)<br />
The incidence is given as the percentage of protoplasts in which intracellular ice formation was observed using<br />
the cryomicroscope. Values in parentheses represent the number of protoplasts that froze intracellularly and the<br />
total number of protoplasts observed at each temperature and cooling rate. The total number of protoplasts<br />
observed was in excess of 1200.<br />
formation has been provided by Mazur (14, 17). To wit, at some<br />
finite cooling rate, supercooling of the intracellular solution will<br />
occur, but the probability of intracellular ice formation will increase<br />
only if the cells are supercooled below their nucleation<br />
temperature. Therefore, it is possible that the decreased incidence<br />
of intracellular ice formation in acclimated tissues may be the<br />
result of an alteration in the nucleation temperature rather than<br />
a decrease in the extent of supercooling.<br />
The objective of this study was to determine by cryomicroscopy<br />
the incidence of intracellular ice formation in protoplasts isolated<br />
from nonacclimated and acclimated rye leaves as a function of<br />
cooling rate and temperature. From measurements of volumetric<br />
behavior under rigorously controlled cooling rates, the hydraulic<br />
conductivity, extent of intracellular supercooling, and temperature<br />
at which intracellular ice formation occurred were determined.<br />
MATERIALS AND METHODS<br />
Seeds of Secale cereale L. cv Puma were germinated and grown<br />
for 7 d in vermiculite under a controlled environment (16-h light<br />
period at 20°C and 8-h dark period at 15°C). Nonacclimated<br />
plants, LTso -3 to -5°C, were grown an additional 7 d. Plants to<br />
be acclimated were transferred to 13°C/7°C (11.5-h photoperiod)<br />
for 1 week and then to 2°C (10-h photoperiod) for 4 weeks after<br />
which they were fully acclimated, LT50-25 to -30°C. Protoplasts<br />
were enzymically isolated from leaves in a solution of 1.5% (w/v)<br />
979<br />
Cellulysin (Calbiochem) 0.5% Macerase (Calbiochem), and 0.3%<br />
potassium dextran sulfate as described previously (30). Protoplasts<br />
from nonacclimated tissue were isolated in 0.1 M CaCl2 + 0.15 M<br />
NaCl (0.53 osm2) while those from acclimated tissue were isolated<br />
in 0.9 M sorbitol, then washed 3 times and suspended in 0.19 M<br />
CaCl2 + 0.29 M NaCl (1.033 osm). The different concentrations<br />
were required to maintain the in situ volume of the protoplasts<br />
because of an increase in the internal solute concentration during<br />
cold acclimation. All solution osmolalities were determined using<br />
a freezing point osmometer. Hereafter, protoplasts isolated from<br />
nonacclimated or acclimated leaves will be referred to as nonacclimated<br />
and acclimated protoplasts respectively and should not<br />
be construed to mean that the isolated protoplasts per se were<br />
subjected to the cold acclimation regime in vitro.<br />
Direct observation of protoplast suspensions during cooling and<br />
warming was accomplished using an electronically programmable<br />
cryomicroscope (27). Nonacclimated and acclimated protoplasts<br />
were cooled at rates of 3.1, 5, 10, and 16°C/min to temperatures<br />
of -5, -10, -15, -20, -30, -40, and -50°C. These cooling rates<br />
and temperatures were chosen such that the incidence of intracellular<br />
ice formation ranged from a low to high value.<br />
Individual freeze/thaw runs, along with sample temperature<br />
2Abbreviations: osm, osmolal; PBS, phosphate-buffered saline; DMSO,<br />
dimethyl sulfoxide.
980 DOWGERT AND STEPONKUS<br />
Plant Physiol. Vol. 72, 1983<br />
a NON-ACCLIMATED<br />
i-so TE ERATURE E'C)<br />
f.75<br />
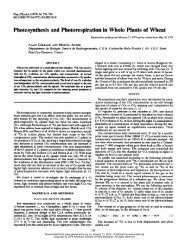
FIG. 1. Incidence of intracellular ice formation in (a) nonacclimated<br />
and (b) acclimated protoplasts as a function of the cooling rate and<br />
minimum temperature imposed (from Table I).<br />
and time after initiation of cooling, were recorded on a video<br />
cassette recorder and projected on a 19-inch color monitor. A x<br />
20 objective and x 5 photo-ocular produced a total magnification<br />
of x 2380 on the monitor. Typically, two or three protoplasts were<br />
viewed during each cooling/warming cycle. Protoplast diameter<br />
and intracellular ice formation as a function of temperature and<br />
time were measured at intervals during replay of the video cassettes<br />
using the 'freeze-frame' on the video cassette recorder.<br />
Intracellular ice formation was identified as the sudden darkening<br />
of the cellular contents ('black flashing') due to gas bubble formation<br />
(24).<br />
Cell volume was calculated from diameter measurements assuming<br />
sphericity. Fractional cell volumes (relative to the isotonic<br />
volume) were calculated in order to compare the volumetric<br />
behavior of protoplasts of different initial volumes. Generally,<br />
protoplasts remained spherical at the higher fractional volumes<br />
(>0.4) with an increasing incidence of irregular shapes at lower<br />
fractional volumes (0.4 were not considered<br />
for volumetric determinations. Diameter measurements were<br />
made at temperature intervals ranging from 1.5°C when cooled at<br />
3.1 °C/min to 3°C intervals when cooled at 16°C/min. The precise<br />
measurement interval for individual protoplasts varied somewhat<br />
depending on the focus of the cells and the observed volumetric<br />
change.<br />
Osmometric behavior of protoplasts was determined by equilibrating<br />
protoplasts in solutions of varied tonicities at 0°C and<br />
calculating volumes from diameter measurements. Approximately<br />
100 protoplasts were measured at 22 different osmolalities over<br />
the range of 0.3 to 3.0 osm for nonacclimated and at 31 different<br />
osmolalities over the range of 0.4 to 6.0 osm for acclimated<br />
protoplasts. The average volume at each osmolality was plotted as<br />
a Boyle-van't Hoff plot and the linear regression and 95% confidence<br />
belts were calculated.<br />
The extent of intracellular supercooling was determined from<br />
the pooled volumetric response at each cooling rate. Fractional<br />
volumes were pooled at 1 °C intervals and the mean and standard<br />
deviation calculated. From the mean fractional volume, the su-<br />
percooling of the intracellular solution was calculated as the extent<br />
in °C to which a given volumetric curve departed from the<br />
equilibrium curve at 1°C intervals. In addition, the range of<br />
supercooling about the mean was calculated for the mean fractional<br />
volume plus or minus 1 SD.<br />
Net water flux (J,) out of the protoplasts during cooling was<br />
calculated using the formula J, = i V/At where A V is the change<br />
in water volume, A is the surface area of the protoplast averaged<br />
over the time of the experiment, and t is the time in seconds.<br />
Hydraulic conductivity (Lp) was determined using the equation<br />
Lp = J,I/A4, where Ai\ is the osmotic potential difference between<br />
the internal and external solutions averaged over the time of the<br />
experiment. The internal osmotic potential at any protoplast volume<br />
was determined from the Boyle-van't Hoff relationship while<br />
the external osmotic potential was estimated by the relationship m<br />
- 273 - T/1.86 where m is the osmolality of the partially frozen<br />
solution and T is the temperature in 'K. Because a comparison<br />
was made of J. and Lp in acclimated and nonacclimated protoplasts<br />
under identical conditions, a more complicated analysis was<br />
considered unnecessary. To determine J. and Lp, protoplasts were<br />
cooled to -5°C at 10°C/min and cellular volumetric changes<br />
were measured during the first 30 s after -5°C was attained. The<br />
cooling rate and temperature were chosen to allow for determinations<br />
of water efflux at high fractional volumes (>0.4) during<br />
the measurement period, thus improving measurement accuracy.<br />
Measurements were made after -5°C was achieved so that the<br />
external osmotic concentration could be assumed constant.<br />
RESULTS<br />
Incidence of Intracellular Ice Formation. When cooled to temperatures<br />
in the range of-5 to -30°C at rapid cooling rates (5°C/<br />
min or faster) and held at the particular temperature for 3 min,<br />
the incidence of intracellular ice formation was consistently greater<br />
in nonacclimated protoplasts than in acclimated protoplasts (Table<br />
I). Over this temperature range, maximal differences occurred at<br />
faster cooling rates and lower temperatures. For example, when<br />
cooled to -20°C at 16°C/min, intracellular ice formation was<br />
observed in 96% of the nonacclimated protoplasts but in only 30%<br />
of the acclimated protoplasts. Only upon cooling to -50°C at<br />
16°C/min was a high incidence of intracellular ice formation<br />
(96%) observed in acclimated protoplasts.<br />
In nonacclimated protoplasts, the incidence of intracellular ice<br />
formation was strongly dependent on both the cooling rate and<br />
minimum temperature imposed (Fig. la). If the protoplasts were<br />
cooled to only -5°C, the incidence was low and independent of<br />
the cooling rate. When cooled to temperatures of -10°C or lower,<br />
the incidence of intracellular ice formation increased greatly as<br />
the cooling rate increased. At a cooling rate of 3.1 °C/min, the<br />
incidence was largely independent of the temperatures imposed<br />
(-5 to -50°C). At cooling rates of 5°C/min and greater, the<br />
incidence of intracellular ice formation increased greatly as the<br />
minimum temperature imposed was decreased over the range of<br />
-3 to -20°C. The incidence of intracellular ice formation, however,<br />
did not increase over the range of -20 to -50°C at any<br />
cooling rate.<br />
In acclimated protoplasts, a cooling rate dependence of the<br />
incidence of intracellular ice formation was observed only when<br />
the protoplasts were cooled to -40 or -50°C (Fig. lb). Over the<br />
range of -5 to -30°C, the incidence was low and independent of<br />
the cooling rate. The temperature dependence of the incidence of<br />
intracellular ice formation was less pronounced in acclimated<br />
protoplasts and occurred over a broader temperature range extending<br />
to -50°C rather than being limited to the range of -3 to<br />
-20°C as observed for nonacclimated protoplasts.<br />
Equilibrium Osmometric Behavior. Protoplasts equilibrated in<br />
solutions of NaCl + CaCl2 of varied tonicities at 0°C behaved as<br />
osmometers over a wide range of osmolalities from 0.3 to 3.0 osm
INTRACELLULAR ICE FORMATION IN ISOLATED PROTOPLASTS<br />
OSMOLALITY<br />
FIG. 2. Boyle-van't Hoff plot of the fractional protoplast volume as a function of osmolality-' for nonacclimated and acclimated protoplasts. For<br />
calculation of the linear regression of volume versus osm-' that is shown, approximately 100 protoplasts were measured at 22 different osmolalities over<br />
the range of 0.3 to 3.0 osm for nonacclimated (A) and at 31 different osmolalities over the range of 0.4 to 6.0 osm for acclimated protoplasts (A). Vb<br />
(nonosmotic volume) was determined by extrapolation of the regression to infinite osmolality. (0) Nonacclimated protoplast volumes ±SD determined<br />
following volumetric equilibration at subzero temperatures of -3, -5, -10, -15, and -20°C. (0) Acclimated protoplast volumes determined following<br />
volumetric equilibration at subzero temperatures of -5, -10, -15, and -20°C.<br />
and 0.4 to 6.0 osm for nonacclimated and acclimated protoplasts,<br />
respectively (Fig. 2). The greater slope observed in the Boyle-van't<br />
Hoff relationship for acclimated protoplasts is the result of the<br />
increase in internal solute concentration that occurs during cold<br />
acclimation. Acclimated protoplasts also have a greater Vb (nonosmotic<br />
volume) which was inferred from extrapolation of the<br />
Boyle-van't Hoff relationship to an infinite osmolality.<br />
Following cooling to subzero temperatures, protoplasts decreased<br />
in volume due to the increase in the osmolality of the<br />
partially frozen suspending medium. The extent of contraction<br />
varied as a function of the minimum temperature imposed. The<br />
average equilibrium volumes attained, plotted as a function of the<br />
osmolality encountered at each subzero temperature (m - T/1.86)<br />
(Fig. 2, circles), were within the 95% confidence belts of the<br />
regressions for the Boyle-van't Hoff relationships calculated from<br />
volumetric measurements at 0°C (Fig. 2). The agreement was very<br />
good considering measurements at subzero temperatures were<br />
limited because protoplasts may depart from sphericity at low<br />
temperatures. The close agreement of the equilibrium volumetric<br />
behavior at subzero temperatures and the osmometric behavior at<br />
0°C in both acclimated and nonacclimated protoplasts strongly<br />
suggests that protoplasts cooled to subzero temperatures attain a<br />
volume consistent with that predicted by Boyle-van't Hoff behavior<br />
at 0°C.<br />
Volumetric Behavior during Cooling to -20°C. Volumetric<br />
changes during cooling were determined for nonacclimated and<br />
acclimated protoplasts cooled to -5, -10, -15, and -20°C at<br />
cooling rates of 3.1, 5, 10, and 16°C/min. For a given cooling rate,<br />
the volumetric behavior over a comparable temperature range was<br />
similar whether the protoplasts were cooled to -5, -10, -15, or<br />
-20°C. As the greatest difference in the incidence of intracellular<br />
ice formation between acclimated and nonacclimated protoplasts<br />
occurred in protoplasts cooled to -20°C, only these results are<br />
presented (Fig. 3). Protoplast volumes were normalized with respect<br />
to the initial volume before cooling. No attempt was made<br />
to present an average or 'typical' response for a particular cooling<br />
981<br />
rate. Instead, the volumetric response of all protoplasts observed<br />
is presented. The range of fractional volumes among protoplasts<br />
at any given temperature and cooling rate was admittedly large.<br />
As the specimen temperature was controlled within ±0.050C, and<br />
the precision of the linear measurements corresponded to ±0.25<br />
P.m, neither contributed greatly to the variability observed. Instead,<br />
the variation is attributed to the inherent variability in water efflux<br />
from individual protoplasts and, at low fractional volumes (
982<br />
I<br />
id<br />
;I<br />
9<br />
I..<br />
I 'K<br />
.4<br />
c<br />
DI~~~~~~~~~~~~~~<br />
NON-ACCLIMATED<br />
Cookin Note lC/uww<br />
.qblIum<br />
09 -I -b -1<br />
1CI<br />
TEMPERATURE<br />
DOWGERT AND STEPONKUS Plant Physiol. Vol. 72, 1983<br />
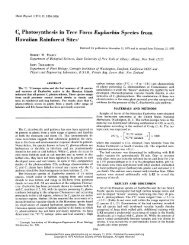
FIG. 3. Volumetric behavior of nonacclimated and acclimated protoplasts during cooling to -20°C. An asterisk indicates that the protoplast froze<br />
intracellularly at the indicated temperature and fractional volume.
a<br />
Z<br />
u-<br />
a<br />
a<br />
10<br />
'K<br />
a<br />
I IC I!<br />
r<br />
fin<br />
a<br />
-1<br />
M0R-CLIMATED<br />
Cooing Room. 3jlCMM<br />
C - tttI<br />
INTRACELLULAR ICE FORMATION IN ISOLATED PROTOPLASTS<br />
_I<br />
-- -to -5 -20<br />
TEMPERATURE (0<br />
IL<br />
it<br />
r<br />
NON-ACCLIATED<br />
CodWg Room: 5*CMO<br />
,ttttt2l<br />
0~~~~~~~~~4<br />
L ' R4-- in -20<br />
TEMERATURE PC1<br />
ttittttt,<br />
NO-ACCLIMATED<br />
CoOig Rate: 0IC_<br />
~~t<br />
II<br />
-D -iLO -;5 -20<br />
TEMPERATURE PC)<br />
MON-ACCLIMATED<br />
Coding Rot: 16 'CAt<br />
0~~~~~<br />
0<br />
0<br />
0<br />
0<br />
_ _ _ I<br />
_t -.a _ -a0<br />
&<br />
TEMPEiXTURE (-C) -t<br />
9<br />
t<br />
I<br />
I<br />
w'<br />
.<br />
la<br />
, S0<br />
-i<br />
.<br />
8<br />
Z;<br />
L.<br />
Ig<br />
Ito<br />
I<br />
_ACLIMATED<br />
Cooli" Reot. 3.Cni<br />
p<br />
0<br />
ACCLIMATED<br />
Cooing Rote 5C/min<br />
ti<br />
t I<br />
It I<br />
-5 -10 -IS -20<br />
TEMPERATURE rC)<br />
-5 -1 -IS -20<br />
TEMPERATURE (IC)<br />
FIG. 4. Extent of intracellular supercooling in nonacclimated and acclimated protoplasts during cooling to -20°C. Circles represent the supercooling<br />
calculated for the means of the fractional volumes at I °C intervals for each of the cooling rates shown in Figure 3. The vertical bars represent the range<br />
of supercooling calculated for the mean fractional volume + 1 SD (upper limit of the bars) and the mean fractional volume -I SD (lower unit of the bars).<br />
0<br />
1!<br />
-1<br />
n0<br />
0<br />
E5 - 0 nk -I R -M~~~~~~~~~~~~_<br />
(C<br />
TEMPERATURE (I C )<br />
II II<br />
ACCLIMATED 4 -<br />
Coinin ROt 10C/<br />
0<br />
0<br />
0<br />
04 I<br />
0 O<br />
n I I<br />
° -S -10 -15 -20<br />
TEMPERATURE rC)<br />
r<br />
I 1IT ----I<br />
ACCLIMATED<br />
CoDolPAgRot SC/mlOt t<br />
"~~~~~~~<br />
t<br />
0<br />
0<br />
0<br />
0<br />
0~~~~<br />
0<br />
0<br />
I<br />
;<br />
983<br />
I I~~~~~~~~~~~~~~~~~~~~~~~~~~~
984<br />
oc<br />
6C<br />
4a4<br />
20<br />
I<br />
DOWGERT AND STEPONKUS Plant Physiol. Vol. 72, 1983<br />
Table II. Water Flux and Hydraulic Conductivity of Nonacclimated and Acclimated Protoplasts at -5°C<br />
Protoplasts were suspended in either 0.53 or 1.03 osm solutions of CaC12 + NaCl (0.1 M CaCl2 + 0.15 M NaCl<br />
and 0.19 M CaCl2 + 0.29 M NaCI, respectively) and cooled to -5°C at 1O°C/min. Protoplast volumes were<br />
calculated from measurements of protoplast diameters taken at 5-s intervals during the first 30 s after -50C was<br />
attained. See "Materials and Methods" for calculations of J. and Lp.<br />
Nonacclimated Acclimated<br />
*v<br />
m 0<br />
a,£ 0<br />
y<br />
Z* -v<br />
0'07<br />
0.53 osm 1.03 osm 0.53 osm 1.03 osm<br />
J. (x 10-6 cm s') 5.55 ± 1.77 3.08 ± 1.86 4.66 ± 1.92 3.84 ± 1.06<br />
Lp (x 10-7 cm s-' bar-) 1.22 ± 0.40 0.99 ± 0.56 1.04 ± 0.44 1.20 ± 0.32<br />
.<br />
y v<br />
V V<br />
v~~~~~~<br />
v<br />
v<br />
a<br />
v<br />
F v 0<br />
a v<br />
v<br />
* v<br />
V V0 0<br />
A<br />
vo 0<br />
000<br />
voO<br />
-000<br />
ao0 00<br />
v ° 0° Cooling Rate:<br />
v 0<br />
f<br />
v o A<br />
0 0 non-accimoted<br />
A 0 31CArin A<br />
A ° 10*rfin OC'II<br />
AO<br />
A 0<br />
16TCAnin<br />
ooimoted<br />
uN<br />
-10 -20 -30 -40<br />
NUCLEATION TEMPERATURE<br />
-50<br />
EC)<br />
-60<br />
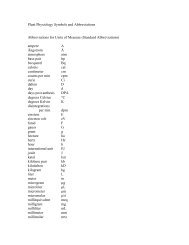
FIG. 5. Cumulative frequency of intracellular ice formation as a function<br />
of the temperature at which intracellular ice formation was observed<br />
to occur in nonacclimated and acclimated protoplasts cooled to -50°C.<br />
For nonacclimated protoplasts, the total number of protoplasts observed<br />
at each cooling rate was 20, 23, 22, and 33 for the rates of 3.1, 5, 10, and<br />
16°C/min, respectively. For acclimated protoplasts, the total number of<br />
protoplasts observed at each cooling rate was 32, 23, 32, and 25 for the<br />
rates of 3.1, 5, 10, and 16°C/min, respectively.<br />
cooling is equal to the extent in °C to which a given volumetric<br />
curve departed from the equilibrium curve (17). In all instances,<br />
protoplasts that froze intracellularly were supercooled. This was<br />
especially obvious in nonacclimated protoplasts (Fig. 3). Nonetheless,<br />
protoplasts which were supercooled did not always freeze<br />
intracellularly. This was especially obvious in acclimated protoplasts<br />
(Fig. 3).<br />
To provide a general contrast between nonacclimated and<br />
acclimated protoplasts cooled at the various rates, the average<br />
extent of supercooling was calculated from a pooled volumetric<br />
response of nonacclimated or acclimated protoplasts. For each of<br />
the cooling rates, individual fractional volumes were averaged at<br />
1°C intervals to yield the average volumetric response. Supercooling<br />
was then calculated for the average volume and for ±SD<br />
(Fig. 4). Estimates of supercooling at large fractional volumes<br />
(>0.4) were reasonably accurate because of the initial steep decline<br />
in the equilibrium volume at relatively warm subzero temperatures.<br />
As a result, the accuracy of calculation of the extent of<br />
supercooling is largely a function of the accuracy of the protoplast<br />
temperature inferred and is relatively insensitive to errors in the<br />
estimate of volume. Nonetheless, because departure of the protoplasts<br />
from sphericity was minimal at fractional volumes >0.4,<br />
estimates of volume are quite good. In contrast, at small fractional<br />
volumes (
0.2_<br />
0.4<br />
INTRACELLULAR ICE FORMATION IN ISOLATED PROTOPLASTS<br />
0'0 -0 -3 -so<br />
TEMPERATURE (rC)<br />
1.0 ~~~~~~~~ ~CCLII"ATED<br />
0.2 equilbrium -<br />
-<br />
-10 --40 -50<br />
TEMPERATURE I*C)<br />
VouercbhvoIfaciatdpoolssdrn<br />
~ |.<br />
to -50°C. An asterisk indicates that the protoplast froze intracellularly at<br />
the indicated temperature and fractional volume.<br />
985<br />
cooled at 5°C/min was not considered too compelling to warrant<br />
the inference that the protoplasts were supercooled. Although the<br />
greatest difference in the incidence of intracellular ice formation<br />
between nonacclimated and acclimated protoplasts occurred at<br />
cooling rates of 10 and 16°C/min, there was little difference in<br />
the extent of supercooling between nonacclimated and acclimated<br />
protoplasts at these rates (Fig. 4). At these rates, the fractional<br />
volumes were greater than 0.3 and, hence, estimates of supercooling<br />
were most accurate.<br />
Plasma Membrane Hydraulic Conductivity and Water Flux.<br />
The volumetric behavior during cooling suggested that the water<br />
permeability of the plasma membrane did not increase during<br />
cold acclimation. Furthermore, at the slowest cooling rate, water<br />
flux from acclimated protoplasts appeared to be less than that<br />
from nonacclimated protoplasts. This apparent difference could,<br />
in part, be attributable to the differences in the internal solute<br />
concentration between nonacclimated (0.53 osm) and acclimated<br />
(1.03 osm) protoplasts. Therefore, a more direct measure of water<br />
flux and hydraulic conductivity was attempted. Nonacclimated<br />
and acclimated protoplasts were cooled to -5°C at 10°C/min and<br />
cellular volumetric changes were measured during the first 30 s<br />
after -5°C was achieved. Experiments were conducted for both<br />
nonacclimated and acclimated protoplasts cooled in either 0.53 or<br />
1.03 osm solutions.<br />
When cooled in the respective isotonic solutions (nonaccimated,<br />
0.53 osm; acclimated, 1.03 osm), water flux (J.) was<br />
significantly less for acclimated protoplasts (Table II). This difference,<br />
however, was entirely due to the difference in internal solute<br />
concentration because the calculated hydraulic conductivities (4),<br />
which compensated for the difference in solute concentration,<br />
were not significantly different. Further, when considered at equal<br />
osmolalities (0.53 or 1.03), J. and Lp for nonacclimated and<br />
acclimated protoplasts were not significantly different.<br />
Nucleation Temperature. In Table I and Figure 1, a and b, the<br />
incidence of intracellular ice formation is reported as a function<br />
of the cooling rate and minimum temperature imposed and presents<br />
the percentage of protoplasts that froze intracellularly during<br />
cooling and the subsequent isothermal period at the minimum<br />
temperature. These results indicated that the incidence of intracellular<br />
ice formation was strongly temperature dependent. They<br />
did not, however, indicate at what temperature intracellular ice<br />
formation occurred. A more direct approach for determining the<br />
temperature at which intracellular ice was nucleated involved<br />
cooling at the various rates to a single low temperature (-50°C)<br />
and recording only the number of protoplasts that froze intracellularly<br />
during cooling (Fig. 5).<br />
For nonacclimated protoplasts, nucleation occurred over a relatively<br />
narrow temperature range independent of the cooling rate<br />
(from 3.1 to 16°C/min) with the median nucleation temperature<br />
at -15°C. For acclimated protoplasts cooled at 3.1 or 5°C/min,<br />
nucleation occurred over a narrow temperature range with a<br />
median nucleation temperature of -42°C. For those cooled at 10<br />
and 16°C/min, the range of nucleation temperatures was much<br />
broader, but still the median nucleation temperature was -40°C.<br />
Effect of Tonicity of the Suspending Medium on the Nucleation<br />
Temperature. In the preceding experiments, nonacclimated and<br />
acclimated protoplasts were routinely suspended in 0.53 and 1.03<br />
osm solutions of NaCl + CaCl2, respectively, in order to maintain<br />
similar volumes and surface areas. Because the volumetric response<br />
was of interest, it was considered not appropriate to<br />
compare nonacclimated and acclimated protoplasts at equal osmolalities<br />
because of the large difference in volumes which would<br />
result. For example, the fractional volume of acclimated protoplasts<br />
suspended in 0.53 osm was 1.8 compared to 1.0 for nonacclimated<br />
protoplasts (Fig. 2). Conversely, the fractional volume of<br />
nonacclimated protoplasts suspended in 1.03 osm was 0.55 compared<br />
to 1.0 for acclimated protoplasts. Despite these large differ-
986 DOWGERT AND STEPONKUS<br />
Plant Physiol. Vol. 72, 1983<br />
ences in fractional volumes at equal osmolalities, the large difference<br />
in the median nucleation temperature between nonacclimated<br />
and acclimated protoplasts prompted consideration of the<br />
influence of the osmolality of the suspending medium on the<br />
nucleation temperature and the incidence of intracellular ice<br />
formation.<br />
Because the incidence of intracellular ice formation was greatest<br />
at cooling rates of 10 and 16'C/min, the effect of osmolality on<br />
the nucleation temperature was considered only at these cooling<br />
rates (Fig. 6). For both nonacclimated and acclimated protoplasts<br />
at either cooling rate, the median nucleation temperature was<br />
decreased at the higher (1.03) osmolality. For example, the median<br />
nucleation temperature for nonacclimated protoplasts cooled at<br />
10IC/min decreased from -14C when suspended in 0.53 osm to<br />
-280C when suspended in 1.03 osm. When cooled at 16'C/min,<br />
the nucleation temperature decreased from - 16'C in 0.53 osm to<br />
-230C in 1.03 osm solutions. In acclimated protoplasts cooled at<br />
10IC/min, the median nucleation temperature increased from<br />
-420C when suspended in 1.03 osm to -19'C when suspended in<br />
0.53 osm. When cooled at 16'C/min, the increase was from<br />
-420C in 1.03 osm to -280C in 0.53 osm. Nevertheless, when<br />
compared at equal osmolalities, the median nucleation temperature<br />
was consistently lower in acclimated than nonacclimated<br />
protoplasts whether suspended in 0.53 or 1.03 osm solutions.<br />
Volumetric Behavior of Acclimated Protoplasts Cooled to<br />
-50°C. Contrasting the volumetric behavior of nonacclimated<br />
and acclimated protoplasts during cooling to -20°C (Fig. 3)<br />
indicated that the extent of supercooling was not reduced in<br />
acclimated protoplasts as proposed by Levitt and Scarth (10).<br />
Instead, the results with nonacclimated protoplasts were consistent<br />
with the hypothesis of Mazur (17) that intracellular ice formation<br />
occurs if cells are supercooled below their nucleation temperature.<br />
A median nucleation temperature of -42°C in acclimated protoplasts<br />
was not anticipated and thus precluded testing of Mazur's<br />
hypothesis in acclimated protoplasts cooled only to -20°C. Therefore,<br />
the volumetric behavior of acclimated protoplasts was determined<br />
during cooling to -50°C (Fig. 7). For these experiments,<br />
the volumetric behavior was determined at more frequent intervals<br />
during cooling using a digital video image processor as described<br />
by Steponkuset al. (27) rather than video tapes.<br />
The proportion of protoplasts that approached volumetric equilibrium<br />
during cooling decreased as the rate of cooling increased.<br />
At 3.1°C/min, the protoplasts did not approach osmotic equilibrium<br />
or a volumetric plateau until temperatures of -25°C or<br />
lower. At 5°C/min, some protoplasts appeared to approach equilibrium<br />
at -30°C. At either 10 or 16°C/min, few, if any, of the<br />
protoplasts approached osmotic equilibrium at -50°C. Intracellular<br />
ice formation occurred over a relatively narrow temperature<br />
range beginning at approximately -35 to -40°C in acclimated<br />
protoplasts cooled at 3.1 or 5°C/min. In contrast, when acclimated<br />
protoplasts were cooled at rates of 10 or 16°C/min, nucleation<br />
occurred over a broader range which began at approximately<br />
-20°C but with a high frequency in the range of -35°C or lower.<br />
At each cooling rate, the proportion of protoplasts that froze<br />
intracellularly and the temperature range over which nucleation<br />
occurred were consistent with the results reported in Figure 5. For<br />
example, at a cooling rate of 5°C/min, intracellular ice formation<br />
occurred in approximately 50%o of the protoplasts cooled to -50°C,<br />
whereas at a cooling rate of 16°C/min intracellular ice formation<br />
occurred in all of the protoplasts cooled to -50°C. The results of<br />
the separate experiments presented in Figures 5 and 7 also were<br />
consistent with the results of the initial experiment presented in<br />
Table I. A minor inconsistency was the somewhat higher incidence<br />
of intracellular ice formation at the 3.1 and 5°C/min cooling rates<br />
reported in Table I relative to that reported in Figures 5 and 7.<br />
This was attributed to the fact that in Figure 1 the results report<br />
the total incidence of intracellular ice formation during cooling<br />
and the subsequent isothermal period (3 min) at the indicated<br />
temperature. In Figures 5 and 7, only the incidence during cooling<br />
was reported. As intracellular ice formation is a probabilistic<br />
phenomenon, a greater incidence would be expected if supercooled<br />
protoplasts were subjected to the lower temperatures for a<br />
longer period of time.<br />
DISCUSSION<br />
The observation that the incidence of intracellular ice formation<br />
was less in acclimated protoplasts compared to nonacclimated<br />
protoplasts subjected to rapid cooling rates to temperatures be-<br />
tween-10 and -30'C is consistent with the report of Siminovitch<br />
and Scarth (23) that intracellular ice formation is less likely to<br />
occur in acclimated tissues. The lower incidence of intracellular<br />
ice formation, however, was not the result of an increase in water<br />
permeability of the plasma membrane following cold acclimation<br />
as commonly inferred and originally suggested by Levitt and<br />
Scarth (10) and Siminovitch and Scarth (23). The hydraulic<br />
conductivity measured during freeze-induced dehydration at<br />
-5SC was similar for both acclimated and nonacclimated protoplasts<br />
(Table II). Speculation that intracellular supercooling is<br />
precluded during cooling of acclimated cells because of the purported<br />
increase in water permeability (10, 23) was not confirmed<br />
with isolated protoplasts. On the contrary, there was no unique<br />
relationship between the extent of supercooling and the incidence<br />
of intracellular ice formation in either nonacclimated or acclimated<br />
protoplasts. In both nonacclimated and acclimated protoplasts,<br />
the extent of intracellular supercooling was similar under<br />
conditions that resulted in the greatest difference in the incidence<br />
of intracellular ice formation and which provided for the most<br />
accurate estimate of supercooling-cooling to -15 or -20'C at<br />
rates of 10 or 16'C/min.<br />
The major distinction between nonacclimated and acclimated<br />
protoplasts was the temperature at which nucleation occurred, a<br />
point not considered in the analysis of Levitt and Scarth (10). In<br />
nonacclimated protoplasts, nucleation occurred over a relatively<br />
narrow temperature range with a median nucleation temperature<br />
of - 15'C, whereas in acclimated protoplasts, nucleation occurred<br />
over a broader temperature range with a median nucleation<br />
temperature of -420C. We submit that the large difference in the<br />
incidence of intracellular ice formation between nonacclimated<br />
and acclimated protoplasts cooled at rapid rates over the range of<br />
-10 to-30'C is due to a lower nucleation temperature of acclimated<br />
protoplasts.<br />
In contrast to the mechanistic interpretation proposed by Levitt<br />
and Scarth (10), Mazur (14, 17) reasoned that intracellular ice<br />
formation occurs if cells do not approach osmotic equilibrium<br />
before reaching a characteristic nucleation temperature. For cells<br />
that have achieved osmotic equilibrium prior to reaching the<br />
nucleation temperature, the probability of intracellular ice formation<br />
is zero. For cells that are extensively supercooled when<br />
they reach the nucleation temperature, the probability approaches<br />
1.0. Implied is the tacit assumption that at temperatures above the<br />
nucleation temperature the probability of intracellular ice formation<br />
is zero regardless of the extent of supercooling.<br />
Over the range of -10 to -30'C, the incidence of intracellular<br />
ice formation in both nonacclimated and acclimated protoplasts<br />
is entirely consistent with Mazur's proposal. For nonacclimated<br />
protoplasts, the low incidence of intracellular ice formation at a<br />
cooling rate of 3.1 °C/min reflected the proportion of protoplasts<br />
that did not achieve osmotic equilibrium at -15°C. At the faster<br />
cooling rates, the increased incidence of intracellular ice formation<br />
reflected the increasingly higher proportion that did not approach<br />
osmotic equilibrium before the characteristic nucleation temperature<br />
was attained. The constancy of the incidence of intracellular<br />
ice formation at temperatures lower than the nucleation temperature<br />
(Fig. Ia) is consistent with the interpretation that protoplasts
INTRACELLULAR ICE FORMATION IN ISOLATED PROTOPLASTS<br />
which attain osmotic equilibrium before attaining the characteristic<br />
nucleation temperature would not be subject to intracellular<br />
ice formation.<br />
For acclimated protoplasts cooled over the range of -10 to<br />
-30°C, the incidence was relatively low at all cooling rates in<br />
spite of extensive supercooling of the intracellular solution because<br />
the nucleation temperature was not encountered. Only upon cooling<br />
to temperatures of -40 or -50°C did the incidence of intracellular<br />
ice formation in acclimated protoplasts increase in proportion<br />
to the cooling rate.<br />
Other than presenting an average value for the extent of supercooling<br />
at each of the cooling rates (Fig. 4), no further quantitative<br />
analysis has been attempted. A more quantitative analysis of the<br />
incidence of intracellular ice formation as a function of the extent<br />
of supercooling at low fractional osmotic volumes is limited<br />
because of the asymptotic nature of the equilibrium volumetric<br />
response. Under these conditions, small variations in volume may<br />
result in the inference of substantial variations in supercooling of<br />
the protoplast contents (compare Figs. 3 and 4 at slow cooling<br />
rates). These limitations are inconsequential at high fractional cell<br />
volumes where, because of the initial sharp decline in the equilibrium<br />
volumetric response, calculations of the extent of supercooling<br />
are insensitive to errors in the estimate of the fractional<br />
volume. Therefore, the conclusion that little difference exists<br />
between the supercooling of nonacclimated and acclimated protoplasts<br />
cooled at rapid rates is not subject to this limitation. The<br />
limitation of inferring supercooling at low fractional cell volumes<br />
is a consequence of the nature of the equilibrium volumetric<br />
response at low temperatures which is not unique to the protoplast<br />
system but applies to all systems where supercooling is inferred<br />
from volumetric changes during freezing.<br />
Mazur (17) suggests that the lower the nucleation temperature<br />
the higher the critical cooling rate necessary for intracellular ice<br />
formation to occur, assuming all other parameters are constant.<br />
For example, for red blood cells, he has predicted that a 10°C<br />
difference in the assumed nucleation temperature will alter the<br />
critical cooling rate by approximately 1 order of magnitude (17).<br />
Although the median nucleation temperature of acclimated protoplasts<br />
(-42°C) was substantially lower than that of nonaccimated<br />
protoplasts (-15°C), there was no difference in the cooling<br />
rate dependence for intracellular ice formation if the protoplasts<br />
were cooled to -50°C (Table I). This suggests that 'all other<br />
parameters' were not constant. To maintain similar surface areas<br />
and volumes, nonacclimated and acclimated protoplasts were<br />
suspended in 0.53 and 1.03 osm solutions, respectively. The difference<br />
in the internal solute concentration would lessen the<br />
difference in the osmotic gradient during cooling, but this would<br />
have a minimal effect on the extent of supercooling because less<br />
water would have to be removed from the acclimated protoplasts<br />
at any given subzero temperature. In fact, the extent of supercooling<br />
to -20°C was similar for both nonacclimated and acclimated<br />
protoplasts cooled at either 10 or 16°C/min. Although, the<br />
Lp measured at -5°C was similar for both nonacclimated and<br />
acclimated protoplasts, we suspect that impeded water efflux is<br />
occurring at the lower temperatures imposed on the acclimated<br />
protoplasts. This is suggested by theoretical considerations that<br />
reduced water efflux at low temperatures may occur due to the<br />
influence of temperature and increased osmolality on the hydraulic<br />
conductivity of the plasma membrane (8, 22).<br />
Insight into the mechanism of nucleation is required to provide<br />
an explanation for the large difference in the nucleation temperature<br />
of nonacclimated and acclimated protoplasts. As early as<br />
1932, Chambers and Hale (4) deduced that the plasma membrane<br />
acts as a barrier to intracellular ice formation and, so long as the<br />
plasma membrane remains intact, the intracellular solution can<br />
be supercooled below its freezing point. The critical temperature<br />
for a tissue was considered to be the temperature at which the<br />
987<br />
plasma membrane breaks down to permit the external ice to<br />
nucleate the intracellular solution. Subsequently, Asahina (1) also<br />
suggested that intracellular ice formation depends on whether or<br />
not the plasma membrane can prevent nucleation by external ice.<br />
More recently, Mazur (15, 17) has provided a more comprehensive<br />
analysis and also concluded that intracellular ice formation results<br />
from seeding by extracellular ice rather than spontaneous crystallization<br />
within the cell. He cites many reports that nucleation<br />
occurs at lower temperatures in the absence of external ice than in<br />
its presence. Further, in the presence of extracellular ice, nucleation<br />
occurs in the range of -10 to -20° C in a diverse array of cell<br />
types.<br />
The behavior of nonacclimated protoplasts (Fig. 5) is consistent<br />
with the interpretation that intracellular ice formation is the result<br />
of heterogeneous nucleation by external ice in that nucleation<br />
occurred at temperatures well above the expected homogeneous<br />
nucleation temperature of the intracellular solution or the eutectic<br />
of the extracellular solution.<br />
Although the median nucleation temperature of acclimated<br />
protoplasts (-42°C) is close to the homogeneous nucleation temperature<br />
of pure water, we do not believe that this is responsible<br />
for the nucleation of acclimated protoplasts. First, the intracellular<br />
solution is not pure water, and a lower homogeneous nucleation<br />
temperature for such a solution would be expected (5, 21). Second,<br />
if homogeneous nucleation were responsible, a sharper temperature<br />
dependency at -40°C would have been expected and was<br />
not observed, especially at the faster cooling rates. Finally, when<br />
suspended in a 0.53 osm solution, the median nucleation temperature<br />
was substantially higher.<br />
Under some circumstances, nucleation of acclimated protoplasts<br />
(Fig. 5), was associated with a crystallization event. During cooling<br />
of the NaCl + CaCl2 solution to -50°C, a crystallization event<br />
occurred at approximately -35°C during cooling at 3.1°C/min,<br />
at approximately -40°C during cooling at 5°C/min, and only<br />
after (2 to 3 min) -50°C was achieved at cooling rates of 10 or<br />
16°C/min. During warming, melting of the crystals occurred<br />
between -20 and -25°C, regardless of the previous cooling rate.<br />
Because crystallization of NaCl in such a solution is expected to<br />
occur in the range of -20 to -25°C, we conclude that this was<br />
responsible for the crystallization event observed.<br />
In some instances, intracellular ice formation was associated<br />
with the crystallization event. In Figure 5, the sharp initial increases<br />
in the cumulative frequency of intracellular ice formation<br />
in protoplasts cooled at either 3.1 or 5°C/min corresponded to<br />
the temperatures at which the crystallization event occurred, -35<br />
and -40°C, respectively. At these rates, the crystallization event<br />
proceeded directionally across the microscope field due to thermal<br />
characteristics of the cryostage (see Ref. 27). In many cases,<br />
nucleation was observed to occur when the advancing front of<br />
crystallization encountered a protoplast. At the faster cooling rates<br />
(10 and 16°C/min), however, the steep increase in the frequency<br />
was not associated with any visible crystallization event, because<br />
at these rates the crystallization event only occurred after -50°C<br />
was attained. These results indicate that eutectic crystallization<br />
of the suspending medium may influence the nucleation temperature<br />
under certain conditions, but cannot be considered to be the<br />
singular cause of intracellular nucleation. Thus, although nucleation<br />
of yeast cells (13) or sea urchin eggs (Strongyocentrotus nudus)<br />
(2) is not associated with eutectic crystallization under the conditions<br />
imposed, nucleation of eggs of another species of sea urchin<br />
(Hemicentrotus pulcherrimus) is associated with the eutectic crystallization<br />
(3).<br />
Although Mazur (15, 17) suggests that nucleation is largely a<br />
consequence of temperature effects on ice crystals, we have reason<br />
to believe that nucleation is primarily the result of a membrane<br />
alteration per se. Previously, we have presented a preliminary<br />
report of the phenomenology of intracellular ice formation with
988 DOWGERT AND STEPONKUS<br />
Plant Physiol. Vol. 72, 1983<br />
respect to observed perturbations of the plasma membrane (25).<br />
Specifically, with high resolution video cryomicroscopy, the following<br />
phenomena have been observed; immediately before (0.03<br />
to 1 s) intracellular ice formation the following events have been<br />
observed: (a) outward flow of the intracellular solution; (b) fluttering<br />
of the plasma membrane; or (c) eddy-like flow patterns in<br />
the cytoplasm. Upon ice nucleation and attendant gas bubble<br />
formation (see Ref. 24), gas bubbles emerge from the protoplast<br />
in the region of the plasma membrane where the above phenomena<br />
were observed. Upon thawing, gas bubbles and cellular contents<br />
(cytoplasm and chloroplasts) emerge from the same region.<br />
Collectively, these observations suggest that mechanical breakdown<br />
of the plasma membrane precedes intracellular ice formation<br />
and exposes the supercooled intracellular solution to the<br />
external ice matrix. (See Steponkus et al. [26] for a further discussion<br />
of mechanical breakdown of the plasma membrane.)<br />
That nucleation is a consequence of mechanical breakdown of<br />
the plasma membrane is consistent with a literal interpretation of<br />
the comment by Chambers and Hale (4) that the critical temperature<br />
is 'the one at which the barrier (plasma membrane) breaks<br />
down.' It differs considerably, however, from the suggestion of<br />
Mazur (15, 17) that only below -10°C will extracellular ice<br />
crystals of a suitably small size be sufficiently stable to pass<br />
through aqueous channels in the membrane. Mazur's analysis<br />
supposes that an organized crystalline surface is passing through<br />
the membrane. If, however, mechanical breakdown of the membrane<br />
occurs, then ice need not pass through the membrane.<br />
Instead the barrier ceases to exist at the locus of breakdown.<br />
Inferring that the primary cause of nucleation is mechanical<br />
breakdown of the plasma membrane does not exclude the possibility<br />
that the composition of the suspending medium can affect<br />
the nucleation temperature or, in our interpretation, the temperature<br />
at which membrane breakdown occurs. Whereas Mazur (12)<br />
observed no effect of the initial concentration of the suspending<br />
medium on the survival of yeast cells cooled at rapid rates, the<br />
initial concentration of the suspending medium does influence the<br />
nucleation temperature of isolated protoplasts (Fig. 6). An obvious<br />
effect of increasing the external concentration of the suspending<br />
medium is to increase the fraction of unfrozen solution at any<br />
subzero temperature (16). Therefore, one possibility to account for<br />
the lower nucleation temperature in protoplasts suspended in the<br />
higher concentration is that the proximity of ice to the plasma<br />
membrane is decreased. Alternatively, differences in the composition<br />
of the suspending medium may directly affect the stability<br />
of the plasma membrane. Recently, Leibo (6, 7) reported that the<br />
nucleation temperature of mouse ova suspended in PBS is -7°C<br />
whereas those suspended in PBS + 1 M DMSO nucleate below<br />
-40°C. Considering the report that the stability of the plasma<br />
membrane of Friend leukemia cells is increased by the addition of<br />
DMSO to the suspending medium (11), it is possible that DMSO<br />
acts, in part, by increasing the stability of the plasma membrane<br />
at lower temperatures.<br />
A corollary to the hypothesis that nucleation is a result of<br />
destabilization of the plasma membrane is that cold acclimation<br />
increases the stability of the plasma membrane during a freezethaw<br />
cycle. The nucleation temperature of acclimated protoplasts<br />
suspended in a 1.03 osm solution is considerably lower than the<br />
nucleation temperature of nonacclimated protoplasts suspended<br />
in a 0.53 osm solution (Fig. 5). This difference is greater than what<br />
can be accounted for by differences in the tonicity of the suspending<br />
medium. Whether contrasted at 0.53 or 1.03 osm, the median<br />
nucleation temperature is lower in acclimated protoplasts. Considering<br />
that cold acclimation increases the tolerance of the plasma<br />
membrane of isolated protoplasts to mechanical and chemical<br />
stresses (26), it is not unexpected that its efficacy in precluding<br />
intracellular ice nucleation is greater in acclimated protoplasts.<br />
In summary, in previous studies of the cooling rate dependence<br />
of intracellular ice formation and the influence of cold acclimation,<br />
emphasis has been placed on water permeability and cellular<br />
volumetric behavior during cooling. In contrast, relatively little<br />
attention has been directed to the nucleation event, either systematic<br />
determinations of the temperature at which nucleation<br />
occurs or the mechanism of nucleation. An accurate analysis of<br />
factors affecting intracellular ice formation requires the experimental<br />
determination of both cellular volumetric behavior and<br />
the nucleation event. For this, cryomicroscopy offers many advantages.<br />
LITERATURE CITED<br />
1. ASAHINA E 1956 The freezing process of plant cell. Contrib Inst Low Temp Sci<br />
10: 83-126<br />
2. ASAHINA E 1961 Intracellular freezing and frost resistance in egg-cells of the sea<br />
urchin. Nature 191: 1263-1265<br />
3. ASAHINA E 1962 Frost injury in living cells. Nature 196: 445-446<br />
4. CHAMBERS R, HP HALE 1932 The formation of ice in protoplasm. Proc R Soc<br />
Lond Ser B 110: 336-352<br />
5. FRANKS F, M BRAY 1980 Mechanism of ice nucleation in undercooled plant cells.<br />
Cryo-Letters 1: 221-226<br />
6. LEIBO SP 1976 Nucleation temperatures of intracellular ice formation in mouse<br />
ova. Cryobiology 13: 646<br />
7. LEIBO SP, JJ McGRATH, EG CRAVALHO 1978 Microscopic observation of intracellular<br />
ice formation in unfertilized mouse ova as a function of cooling rate.<br />
Cryobiology 15: 257-271<br />
8. LEVIN RL, EG CRAVALHO, CE HUGGINS 1976 A membrane model describing<br />
the effect of temperature on the water conductivity of erythrocyte membranes<br />
at subzero temperatures. Cryobiology 13: 415-429<br />
9. LEVITT J 1978 An overview of freezing injury and survival, and its interrelationships<br />
to other stresses. In PH Li, A Sakai, eds, Plant Cold Hardiness<br />
and Freezing Stress. Academic Press, New York, pp 3-15<br />
10. LEVrrT J, GW SCARTH 1936 Frost-hardening studies with living cells. II. Permeability<br />
in relation to frost resistance and the seasonal cycle. Can J Res C 14:<br />
285-305<br />
11. LYMAN GH, HD PREISLER, D PAPAHADJOPOULOS 1976 Membrane action of<br />
DMSO and other chemical inducers of Friend leukemia cell differentiation.<br />
Nature 262: 360-363<br />
12. MAZUR P 1961 Physical and temporal factors involved in the death of yeast at<br />
subzero temperatures. Biophys J 1: 247-264<br />
13. MAZUR P 1963 Studies on rapidly frozen suspensions of yeast cells by differential<br />
thermal analysis and conductometry. Biophys J 3: 323-353<br />
14. MAZUR P 1963 Kinetics of water loss from cells at subzero temperatures and the<br />
likelihood of intracellular freezing. J Gen Physiol 47: 347-369<br />
15. MAZUR P 1965 The role of cell membranes in the freezing of yeast and other<br />
single cells. Ann NY Acad Sci 125: 658-676<br />
16. MAZUR P 1970 Cryobiology: the freezing of biological systems. Science 168: 939-<br />
949<br />
17. MAZUR P 1977 The role of intracellular freezing in the death of cells cooled at<br />
supraoptimal rates. Cryobiology 14: 251-272<br />
18. McKENZIE JS, CJ WEISER, EJ STADELMANN, MJ BuRKuE 1974 Water permeability<br />
and cold hardiness of cortex cells in Cornus stolonifera Michx.-a preliminary<br />
report. Plant Physiol 54: 173-176<br />
19. MOLISCH H 1897 Untersuchungen uber das Erfrieren der Pflanzen. Jena 1-73<br />
20. MULLER-THURGAu H 1886 Ueber das Gefrieren und Erfrieren der Pflanzen.<br />
Landwirtsch Jahrb 15: 453-610 (original not seen; cited by Chandler WH<br />
(1913) The killing of plant tissue by low temperature. Mo Agric Exp Sta Res<br />
Bull 8: 141-309)<br />
21. RASMUSSEN DH, MN MACAULAY, AP MACKENZIE 1975 Supercooling and<br />
nucleation of ice in single cells. Cryobiology 12: 328-339<br />
22. SILVARES OM, EG CRAVALHO, WM TOSCANO, CE HUGGINS 1975 The thermodynamics<br />
of water transport from biological cells during freezing. J Heat<br />
Transfer 97: 582-588<br />
23. SIMINOVITCH D, GW SCARTH 1938 A study of the mechanism of frost injury to<br />
plants. Can J Res C 16: 467481<br />
24. STEPONKUS PL, MF DOWGERT 1981 Gas bubble formation during intracellular<br />
ice formation. Cryo-Letters 2: 4247<br />
25. STEPONKUS PL, MF DOWGERT 1981 Phenomenology of intracellular ice nucleation<br />
in isolated protoplasts. Plant Physiol 67: S-58<br />
26. STEPONKUS PL, MF DOWGERT, WJ GORDON-KAMM 1983 Destabilization of the<br />
plasma membrane of isolated plant protoplasts during a freeze-thaw cycle: the<br />
influence of cold acclimation. Cryobiology 20: In press<br />
27. STEPONKUS PL, MF DOWGERT, JR FERGUSON, RL LEVIN 1983 Cryomicroscopy<br />
of isolated protoplasts. Cryobiology 20: In press<br />
28. STOUT DG, PL STEPONKUS, RM CoTrs 1977 Quantitative study of the importance<br />
of water permeability in plant cold hardiness. Plant Physiol 60: 374-378<br />
29. SUKUMARAN NP, CJ WEISER 1972 Freezing injury in potato leaves. Plant Physiol<br />
50: 564-567<br />
30. WIEST SC, PL STEPONKUS 1978 Freeze-thaw injury to isolated spinach protoplasts<br />
and its simulation at above freezing temperatures. Plant Physiol 62: 699-705