TempTrax temperature graphing with MRTG ... - Openxtra
TempTrax temperature graphing with MRTG ... - Openxtra
TempTrax temperature graphing with MRTG ... - Openxtra

Create successful ePaper yourself
Turn your PDF publications into a flip-book with our unique Google optimized e-Paper software.
<strong>TempTrax</strong> <strong>temperature</strong> <strong>graphing</strong> <strong>with</strong> <strong>MRTG</strong><br />
=======================================<br />
Author: Marc Bigler / oriented.net<br />
Summary: This document will guide you through configuring <strong>MRTG</strong> to graph and<br />
monitor the <strong>temperature</strong> using a <strong>TempTrax</strong> device.<br />
Pre-requisites: - UNIX operating system like Linux<br />
- PERL<br />
- Device-SerialPort PERL module<br />
- <strong>MRTG</strong><br />
Optional:<br />
<strong>MRTG</strong> configuration part<br />
-----------------------<br />
- Web server (for example Apache)<br />
<strong>MRTG</strong> was initially created to graph the incoming and outgoing network traffic<br />
from a router's interface card using the SNMP protocol. With it's big gain in<br />
popularity it has been enhanced and can now graph anything simply by using any<br />
kind of shell script including PERL and this is how we are going to use it.<br />
<strong>MRTG</strong> will execute every 5 minutes a PERL script. This script opens the serial<br />
device where the <strong>TempTrax</strong> is connected to get the current <strong>temperature</strong>, <strong>MRTG</strong> will<br />
then read in this value, process it and generate the new graph. <strong>MRTG</strong> per default<br />
generates a daily, weekly, monthly and yearly graph it will even generate you an<br />
HTML page which can be used <strong>with</strong> your web server to nicely display those graphs.<br />
First of all you will need to install <strong>MRTG</strong> on your system, for that you will<br />
have to follow the well documented <strong>MRTG</strong> installation guide which you can find on<br />
it's web site or in the <strong>MRTG</strong> package itself.<br />
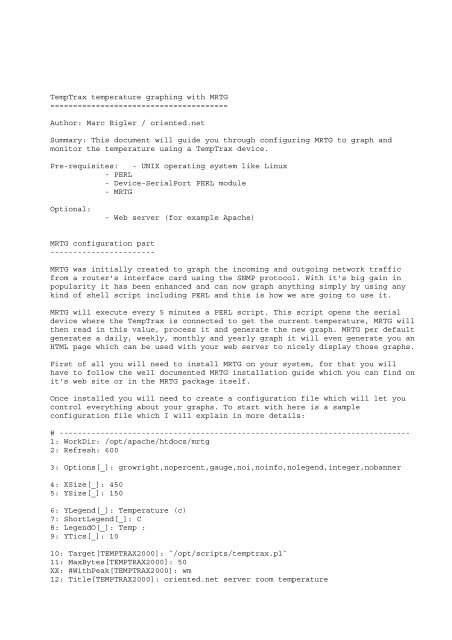
Once installed you will need to create a configuration file which will let you<br />
control everything about your graphs. To start <strong>with</strong> here is a sample<br />
configuration file which I will explain in more details:<br />
# -----------------------------------------------------------------------------<br />
1: WorkDir: /opt/apache/htdocs/mrtg<br />
2: Refresh: 600<br />
3: Options[_]: growright,nopercent,gauge,noi,noinfo,nolegend,integer,nobanner<br />
4: XSize[_]: 450<br />
5: YSize[_]: 150<br />
6: YLegend[_]: Temperature (c)<br />
7: ShortLegend[_]: C<br />
8: LegendO[_]: Temp :<br />
9: YTics[_]: 10<br />
10: Target[TEMPTRAX2000]: `/opt/scripts/temptrax.pl`<br />
11: MaxBytes[TEMPTRAX2000]: 50<br />
XX: #WithPeak[TEMPTRAX2000]: wm<br />
12: Title[TEMPTRAX2000]: oriented.net server room <strong>temperature</strong>
13: PageTop[TEMPTRAX2000]: oriented.net server room <strong>temperature</strong><br />
14: <br />
15: Maintainer: Marc Bigler<br />
16: Description:<strong>TempTrax</strong> 2000 Sensor<br />
17: <br />
# -----------------------------------------------------------------------------<br />
WARNING: If you use this sample configuration file don't forget to remove the<br />
number and the colon as it is only for explanation.<br />
[1]: The workdir is the directory where you want <strong>MRTG</strong> to save the graphs, i<br />
would recommend you to be it a directory in your web server's document root. If<br />
you do so, you will be able to access those graphs from anywhere on your network<br />
by accessing your web server. If you don't use a web server then the directory<br />
doesn't mind. In my sample I am having <strong>MRTG</strong> save the graphs in the mrtg subdirectory<br />
of my Apache web server's root directory /opt/apache/htdocs.<br />
[2]: This defines the refreshing rate in seconds of the HTML page which is<br />
generated by <strong>MRTG</strong> along <strong>with</strong> the graphs. I've got it here setted to 6 minutes.<br />
[3]: The options configuration directive lets you configure quite a lot of<br />
boolean switches which directly affect the generated graph. I've found that<br />
those options are the most suited for <strong>temperature</strong> <strong>graphing</strong>. Explaind quickly I<br />
want my grpah to grow on the right side (growright), I don't want to display<br />
percentages (nopercent), the value of my <strong>temperature</strong> is a current status<br />
measurement and not an incrementing counter (gauge), don't display the second<br />
graph line which is not required because we have only one variable which is our<br />
<strong>temperature</strong> (noi), we do not want to display the uptime and device name as this<br />
is not valid for our case (noinfo), we don't want any extra legends (nolegend),<br />
we are using an integer value and want the summary lines below the graphs also<br />
as integers <strong>with</strong>out comma (integer), we choose not to display the <strong>MRTG</strong> banner<br />
(nobanner).<br />
[4-5]: By default all graphs generated by <strong>MRTG</strong> are 100x400 pixels wide, I want<br />
them to be slightly a bit larger, as you've guessed XSize is it's width and<br />
YSize is it's height. The unit is in pixels.<br />
[6]: Here we define the legend of our Y axis which is the <strong>temperature</strong> and will<br />
be displayed along the Y axis. The X axis is the time but that's the default so<br />
we only need to change Y's axis legend.<br />
[7]: A short version of the legend which will be used for the summary lines<br />
under the graph, the unit is a good choice as legend for example F or C,<br />
depending if you use Fahrenheit or Celcius.<br />
[8]: This string will be displayed at the summary line under the graph.<br />
[9]: The YTics option will let use define the number of vertical lines displayed<br />
in the graph, I have changed this to 10 which will display 10 vertical dotted<br />
lines, this gives a better readability to the graph.<br />
[10]: Here we come to the most important piece of the configuration, the Target<br />
option here is used to call our script which will return the <strong>temperature</strong>. We<br />
will talk later about the script, it's important here that you point to the<br />
correct path to the script and don't forget the "`" before and after the<br />
script's full path. This character is well-known in UNIX scripts, it permits to<br />
run a script for example.
[11]: The MaxBytes parameter has a misleading name but you would maybe have<br />
guessed it is to define the maximum value of our X axis, which is of course the<br />
<strong>temperature</strong>. <strong>MRTG</strong> uses this parameter to define the upper limit of the X axis.<br />
For those who use celcius as unit a value of 50 is a good choice, for those who<br />
use fahrenheit 100 should also be a good choice.<br />
[12]: This is the title of the generated HTML page, this value is mainly used in<br />
the HTML tag.<br />
[13-17]: This is HTML code which you would like to add at the top of the HTML<br />
page which <strong>MRTG</strong> generates. Usually as in my case it's just a title and some<br />
brief description but it can be anything for example you could use a tag<br />
to display your company's logo.<br />
With all these parameters you will already have a nice <strong>temperature</strong> graph but if<br />
you wish you can further customize it for example change the lines colors and so<br />
on. A good description of all the other extra parameters can be found on the<br />
website of <strong>MRTG</strong>.<br />
Save this configuration file somewhere for example I have it in /etc/mrtg and<br />
have called the file mrtg.temptrax.cfg. From here on the next step is to have<br />
the PERL script in the right place specified in Target parameter on line 10.<br />
PERL script<br />
-----------<br />
Now for <strong>MRTG</strong> to work you need an interface which can speak or better which can<br />
retreive the value of the <strong>TempTrax</strong> device. That's what the script defined in the<br />
Target parameter of <strong>MRTG</strong>'s configuration file is for. Before you can use this<br />
script you will need to download and install the Device-SerialPort PERL module<br />
from CPAN. Just follow the installing instructions provided <strong>with</strong> the module.<br />
Here is the script which will gather the <strong>temperature</strong> from the <strong>TempTrax</strong> and<br />
return it to <strong>MRTG</strong>:<br />
# -----------------------------------------------------------------------------<br />
#!/usr/bin/perl -w<br />
use strict;<br />
# Requires the Device-SerialPort PERL module<br />
use Device::SerialPort;<br />
# Define variables (change here to the device where your <strong>TempTrax</strong> is connected)<br />
my $temptrax_device = "/dev/ttyS0";<br />
# Initialize variables<br />
my $pass;<br />
my $return;<br />
my @values;<br />
my ($probe1_value, $probe2_value, $battery_status);
my $<strong>temperature</strong>;<br />
# Open serial device and set the connection parameters<br />
my $ob = Device::SerialPort->new ($temptrax_device) || die "Can't open<br />
${temptrax_device}: $!";<br />
$ob->baudrate (9600) || die "fail setting baudrate";<br />
$ob->parity ("none") || die "fail setting parity";<br />
$ob->databits (8) || die "fail setting databits";<br />
$ob->stopbits (1) || die "fail setting stopbits";<br />
#$ob->handshake ("none") || die "fail setting handshake";<br />
$ob->dtr_active (1) || die "fail setting dtr_active";<br />
$ob->write_settings || die "no settings";<br />
sleep 1;<br />
# Send a dummy character to the <strong>TempTrax</strong> device to "wake it up", this will<br />
return the <strong>temperature</strong><br />
$pass = $ob->write("a") or die ("Could not write to <strong>TempTrax</strong>: $!");<br />
sleep 1;<br />
# Process the output returned by the <strong>TempTrax</strong> device<br />
if (($return = $ob->input) ne "") {<br />
} else {<br />
$ob->write ($return);<br />
# Insert each value in it's respective variable<br />
($probe1_value, $probe2_value, $battery_status) = split("\r", $return);<br />
# Get the <strong>temperature</strong> in Fahrenheit<br />
chomp($<strong>temperature</strong> = $probe1_value + 0);<br />
# Temperature is in Fahrenheit so we convert it here into Celcius<br />
$<strong>temperature</strong> = (($probe1_value - 32) * 5) / 9;<br />
# Remove the decimal part as <strong>MRTG</strong> doesn't like decimals<br />
$<strong>temperature</strong> =~ s/([0-9]+)\.([0-9]+)/$1/;<br />
# Print the result to be processed by <strong>MRTG</strong><br />
print "0\n";<br />
print $<strong>temperature</strong>;<br />
print $battery_status, "\n";<br />
print "oriented.net server room\n" # This can be set to anything<br />
print "ERROR: Did not receive a <strong>temperature</strong> reading from <strong>TempTrax</strong>.\n";
}<br />
undef $ob;<br />
exit(0);<br />
# -----------------------------------------------------------------------------<br />
If you know PERL the script is pretty self explaining, in a few words, it opens<br />
the device where the <strong>TempTrax</strong> is connected, retreives the <strong>temperature</strong> and<br />
display is to the standard output.<br />
The only two things which you will need to parameter is the device name of your<br />
<strong>TempTrax</strong>, in my case running Linux I have it connected on the first serial port<br />
of my PC (COM1) so the device is /dev/ttyS0. For a Sun Solaris box also on the<br />
first serial port device it would be /dev/term/a. So don't forget to modify the<br />
$temptrax_device variable at the beginning of the script if you are not running<br />
Linux and your <strong>TempTrax</strong> is not connected to COM1.<br />
The second piece of code to tweak is if you want the output to be in Fahrenheit<br />
instead of Celcius, as I live in Switzerland our unit for the <strong>temperature</strong> is the<br />
Celcius. But for the folks living in the US it would be in Fahrenheit. I need to<br />
do some conversion in Celcius in the script because the <strong>TempTrax</strong> device, as it<br />
is built in the US, returns the <strong>temperature</strong> in Fahrenheit. So for those using<br />
Fahrenheit as <strong>temperature</strong> unit you will need to remove the following single line<br />
near the end of the script:<br />
$<strong>temperature</strong> = (($probe1_value - 32) * 5) / 9;<br />
Then the output of the script will be in Fahrenheit. Now save this script in the<br />
same path and filename as you have used in <strong>MRTG</strong>'s configuration file, in my<br />
example that is /opt/scripts/temptrax.pl. You will need to run this script as<br />
root or give the user which will run the script read access to the serial<br />
device. Also make sure the script is executable and that the path to PERL on the<br />
very first line of the script is correct. You should now try if your script<br />
works correctly by executing it like this:<br />
/opt/scripts/temptrax.pl<br />
A sample output would be:<br />
0<br />
25<br />
Bat Ok<br />
oriented.net server room<br />
The only important line of output for <strong>MRTG</strong> is the second one which is actually<br />
the <strong>temperature</strong>, here in Celcius. The other lines are required to fool <strong>MRTG</strong> as<br />
it expects this 4-line output format and won't work if it's not exactly like<br />
that.<br />
Credits: This script is originaly from Sensatronics, I have found it on their<br />
website, I simply modified it to add support for the Celcius unit and to make it<br />
work <strong>with</strong> <strong>MRTG</strong>.<br />
The next step is to execute <strong>MRTG</strong> automatically at regular intervals for that we<br />
will use UNIX crontab.
UNIX crontab configuration part<br />
-------------------------------<br />
As you should know the crontab in UNIX lets you run anything at anytime or at<br />
regular intervals in background. We will use it to run <strong>MRTG</strong> <strong>with</strong> our<br />
configuration file every 5 minutes, this means that every 5 minutes the<br />
<strong>temperature</strong> will be read from the <strong>TempTrax</strong> and <strong>MRTG</strong> will re-generate the graphs<br />
taking in account the new value.<br />
The easiest way is to edit the crontab of the root user <strong>with</strong> the following<br />
command on Linux:<br />
crontab -e<br />
and add the following lines at the end:<br />
#<br />
# Crontab entry for <strong>MRTG</strong><br />
#<br />
*/5 * * * * /opt/mrtg/bin/mrtg /etc/mrtg/mrtg.temptrax.cfg >/dev/null 2>&1<br />
The value /opt/mrtg/bin/mrtg should point to you <strong>MRTG</strong> file which you installed<br />
at the beginning and the value /etc/mrtg/mrtg.temptrax.cfg should be the special<br />
configuration file of <strong>MRTG</strong> for <strong>TempTrax</strong>. The rest of that line simply tells to<br />
run <strong>MRTG</strong> every five minutes and to redirect all output to /dev/null.<br />
The first two times <strong>MRTG</strong> is ran it won't produce much because it somehow<br />
initializes some files it needs. So you will have to wait a few minutes before<br />
seeing some output. All the files generated by <strong>MRTG</strong> will be located in the<br />
directory defined by the WorkDir parameter in the <strong>MRTG</strong> configuration file. If<br />
you use the computer where your <strong>TempTrax</strong> device is connected as a desktop<br />
computer you could point your browser to that directory. If it is a server I<br />
would recommend you to use Apache to display the graphs remotely on your local<br />
network or even onto the internet, as you wish.<br />
TIPS<br />
----<br />
If you have two probes on your <strong>TempTrax</strong> device you could slightly modify the<br />
<strong>MRTG</strong> configuration file and the PERL script to read the two values and have two<br />
lines in your graph, one per probe.<br />
By adding the following parameter in the <strong>MRTG</strong> configuration file:<br />
WithPeak[TEMPTRAX2000]: wmy<br />
You can get <strong>MRTG</strong> to graph the maximum value, it will add a new line, per default<br />
the color is pink and will always represent the maximum value. Normally <strong>MRTG</strong><br />
only graphs the line for the average value which is the one you see <strong>with</strong>out this<br />
option. The "wmy" value instructs to draw that maximum line for the Weekly<br />
Montly and Yearly graphs. It's not possible to get an maximum value for the<br />
daily graph as it's already the real value.
LINKS<br />
-----<br />
Here are all the links where you can find the sofware which is discussed in this<br />
document.<br />
Device-SerialPort PERL module:<br />
http://search.cpan.org/author/COOK/Device-SerialPort-0.12/<br />
Apache web server:<br />
http://www.apache.org/<br />
<strong>MRTG</strong> itself:<br />
http://www.mrtg.org/<br />
PERL:<br />
http://www.perl.org/<br />
Linux:<br />
http://www.linux.org/