Land vs. Water Temp Lab
Land vs. Water Temp Lab
Land vs. Water Temp Lab

Create successful ePaper yourself
Turn your PDF publications into a flip-book with our unique Google optimized e-Paper software.
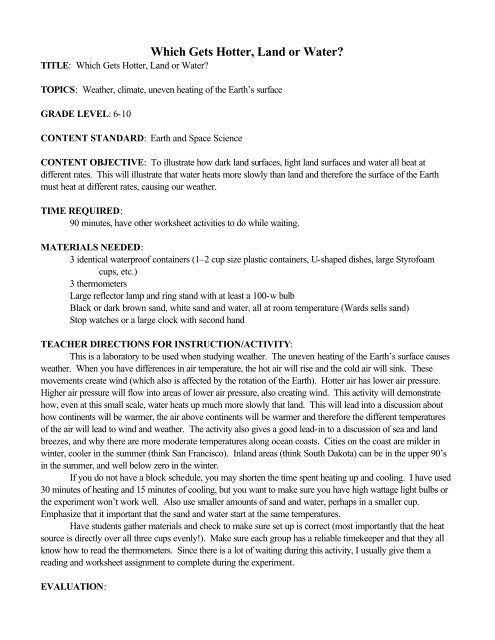
Which Gets Hotter, <strong>Land</strong> or <strong>Water</strong>?<br />
TITLE: Which Gets Hotter, <strong>Land</strong> or <strong>Water</strong>?<br />
TOPICS: Weather, climate, uneven heating of the Earth’s surface<br />
GRADE LEVEL: 6-10<br />
CONTENT STANDARD: Earth and Space Science<br />
CONTENT OBJECTIVE: To illustrate how dark land surfaces, light land surfaces and water all heat at<br />
different rates. This will illustrate that water heats more slowly than land and therefore the surface of the Earth<br />
must heat at different rates, causing our weather.<br />
TIME REQUIRED:<br />
90 minutes, have other worksheet activities to do while waiting.<br />
MATERIALS NEEDED:<br />
3 identical waterproof containers (1–2 cup size plastic containers, U-shaped dishes, large Styrofoam<br />
cups, etc.)<br />
3 thermometers<br />
Large reflector lamp and ring stand with at least a 100-w bulb<br />
Black or dark brown sand, white sand and water, all at room temperature (Wards sells sand)<br />
Stop watches or a large clock with second hand<br />
TEACHER DIRECTIONS FOR INSTRUCTION/ACTIVITY:<br />
This is a laboratory to be used when studying weather. The uneven heating of the Earth’s surface causes<br />
weather. When you have differences in air temperature, the hot air will rise and the cold air will sink. These<br />
movements create wind (which also is affected by the rotation of the Earth). Hotter air has lower air pressure.<br />
Higher air pressure will flow into areas of lower air pressure, also creating wind. This activity will demonstrate<br />
how, even at this small scale, water heats up much more slowly that land. This will lead into a discussion about<br />
how continents will be warmer, the air above continents will be warmer and therefore the different temperatures<br />
of the air will lead to wind and weather. The activity also gives a good lead-in to a discussion of sea and land<br />
breezes, and why there are more moderate temperatures along ocean coasts. Cities on the coast are milder in<br />
winter, cooler in the summer (think San Francisco). Inland areas (think South Dakota) can be in the upper 90’s<br />
in the summer, and well below zero in the winter.<br />
If you do not have a block schedule, you may shorten the time spent heating up and cooling. I have used<br />
30 minutes of heating and 15 minutes of cooling, but you want to make sure you have high wattage light bulbs or<br />
the experiment won’t work well. Also use smaller amounts of sand and water, perhaps in a smaller cup.<br />
Emphasize that it important that the sand and water start at the same temperatures.<br />
Have students gather materials and check to make sure set up is correct (most importantly that the heat<br />
source is directly over all three cups evenly!). Make sure each group has a reliable timekeeper and that they all<br />
know how to read the thermometers. Since there is a lot of waiting during this activity, I usually give them a<br />
reading and worksheet assignment to complete during the experiment.<br />
EVALUATION:
Graphs should generally show the dark sand heating up the fastest and cooling the fastest, the light sand a little<br />
slower, and the water the slowest.<br />
Answers to questions:<br />
1. This answer should describe the results shown in the table and on their graph (as explained above). The<br />
graph, of course, should match with the numbers in the table.<br />
2. Students should conclude that the water absorbs the same amount of heat without going up in temperature as<br />
quickly. If they know the concept of heat capacity, urge them to discuss that here (you may want to put<br />
that term in the question). Most will know that darker colors absorb more wavelengths of color and<br />
therefore the dark sand was the hottest (and cooled faster as well).<br />
3. The results indicate that the Earth, being covered by large bodies of water and land, will heat unevenly. The<br />
interior of larger continents will probably get hotter than smaller landmasses<br />
4. A. The uneven heating of the Earth’s surface, creating air with different temperatures and pressures, will cause<br />
wind and therefore weather to occur. B. The ability of water to hold more heat means the Earth’s<br />
temperature will be much more moderate than if there were a larger percentage of land, making the<br />
surface of the Earth more habitable for humans and all life (lucky for us).<br />
LESSON PLAN AUTHOR & CONTACT INFO: Christine McLelland, Adapted from Project Earth<br />
Science Meteorology, 1994, NSTA Publications. subaruteacher@geosociety.org<br />
STUDENT PAGES FOLLOW:
Name: __________________________ Date: _________<br />
Which Gets Hotter: LAND OR WATER?<br />
OBJECTIVE: You will determine if land or ocean absorbs heat faster and discuss the implications of your<br />
findings on the Earth's weather system.<br />
Materials: Obtain 3 identical waterproof containers, three thermometers, a reflector lamp and ring stand, room<br />
temperature water, and light and dark room temperature sand. Mark the color of your two sand samples<br />
on the data table<br />
Preparation: Fill one container about half full with light sand, one with dark sand, and the third with water to the<br />
same level. Place the thermometers upright into the sand and water, submerging the ball of the<br />
thermometer into the material. Place the containers under the light source so that they all obtain equal<br />
amounts of light rays from it. Make sure the thermometers are upright and not receiving direct light.<br />
Procedure: Before you turn the light on, take the initial temperature, adjusting the water's temperature if<br />
needed to match the sand's temperature. Turn the light on and measure the temperature of each material<br />
in Celsius every 5 minutes. Record on the data table below. After 40 minutes, turn off the light and<br />
record the falling temperatures for about 30 minutes. Graph the results on the graph paper provided,<br />
using different colors or patterns for each material. Answer the questions below.<br />
DATA: Color of light sand: ____________ Color of dark sand: _______________<br />
Time: 0<br />
<strong>Water</strong><br />
<strong>Temp</strong>:<br />
Light<br />
Sand:<br />
Dark<br />
Sand:<br />
o C<br />
ANALYSIS:<br />
1. Please describe the results of your experiments for the three cups:<br />
2. What can you conclude from these results? (I.e., which material heats and cools the fastest/slowest?)<br />
3. What do these results indicate about the heating of the Earth?<br />
4. Explain how these results affect the weather on the Earth in detail. What do you think would happen if the<br />
Earth were covered with over 70% land instead of water?