a review of some dynamic problems in hydropower plants - IHS
a review of some dynamic problems in hydropower plants - IHS
a review of some dynamic problems in hydropower plants - IHS

Create successful ePaper yourself
Turn your PDF publications into a flip-book with our unique Google optimized e-Paper software.
IAHR WG1 Stuttgart Oct.8-10, 2003. (Corrected version).<br />
A REVIEW OF SOME DYNAMIC PROBLEMS IN HYDROPOWER PLANTS<br />
Hermod Brekke Pr<strong>of</strong>essor Emeritus<br />
NORCONSULT A.S.<br />
SUMMARY<br />
The paper deals briefly with the draft tube <strong>problems</strong> and high frequency <strong>problems</strong> caused by the blade pass<strong>in</strong>g<br />
frequency <strong>of</strong> Francis turb<strong>in</strong>es. The theory will not be presented <strong>in</strong> the paper, but will be presented <strong>in</strong> the<br />
audience.<br />
References will be given <strong>in</strong> the paper together with illustrations <strong>of</strong> the developed geometry <strong>of</strong> Francis runners.<br />
The ma<strong>in</strong> body <strong>of</strong> the paper will describe an unpublished problem caused by water column separation <strong>in</strong> the<br />
penstock <strong>of</strong> Muna pump<strong>in</strong>g station <strong>in</strong> Bogota Colombia and a demonstration <strong>of</strong> how a stability could be obta<strong>in</strong>ed<br />
by a pressure feed back system <strong>in</strong> an unstable power plant with a very long penstock.<br />
LOW CYCLE DRAFT TUBE PROBLEMS IN FRANCIS TURBINES.<br />
Part load surge <strong>problems</strong> <strong>in</strong> the Francis turb<strong>in</strong>es are well known and this problem has its root <strong>in</strong> the shape <strong>of</strong> the<br />
runner. No draft tube can save a runner with very unstable behaviour.<br />
Normally the surge problem starts at part load not far from the best efficiency po<strong>in</strong>t with the so called <strong>in</strong>ter-blade<br />
separation.<br />
The <strong>in</strong>ter-blade separation is also, besides the runner blade geometry, affected by the cone extended from the<br />
runner hub and turb<strong>in</strong>es with the shaft go<strong>in</strong>g through the draft tube bend seems have less <strong>problems</strong> with<br />
<strong>in</strong>stability.<br />
At lower load, the well known cork screw swirl is build<strong>in</strong>g up <strong>in</strong> all Francis turb<strong>in</strong>es without shaft through the<br />
draft tube, caused by <strong>in</strong>stability when the tangential velocity component have established a potential swirl with<br />
velocity that <strong>in</strong>creases with decreas<strong>in</strong>g radius towards the centre.<br />
The surge <strong>problems</strong> caused by the cork-screw swirl is strongly <strong>in</strong>fluenced by the runner geometry.<br />
Recently the runners <strong>of</strong> Guri power plant <strong>in</strong> Venezuela was substituted by new runners <strong>of</strong> the so called X-blade<br />
type reduc<strong>in</strong>g the <strong>dynamic</strong> part load <strong>problems</strong> dramatically.<br />
The new so called X-blade runners have a relatively strong negative blade lean angle towards the band i.e. the<br />
blade jo<strong>in</strong>t at the band is runn<strong>in</strong>g <strong>in</strong> front <strong>of</strong> the jo<strong>in</strong>t at the hub, but the blade is twisted back at the outlet <strong>in</strong><br />
order to obta<strong>in</strong> a stabilized balanced pressure between the band and the hub and thus reduce the cross flow on the<br />
pressure side <strong>of</strong> the blades. The outlet edges <strong>of</strong> the blades are also skewed i.e. the jo<strong>in</strong>t at the band is runn<strong>in</strong>g <strong>in</strong><br />
front <strong>of</strong> the jo<strong>in</strong>t at the hub. When the X- blade runners was presented first time they were described as<br />
“PRESSURE BALANCED RUNNERS WITH SKEWED OUTLETS “, but the name was improved to X-blade<br />
runners by the Ch<strong>in</strong>ese.<br />
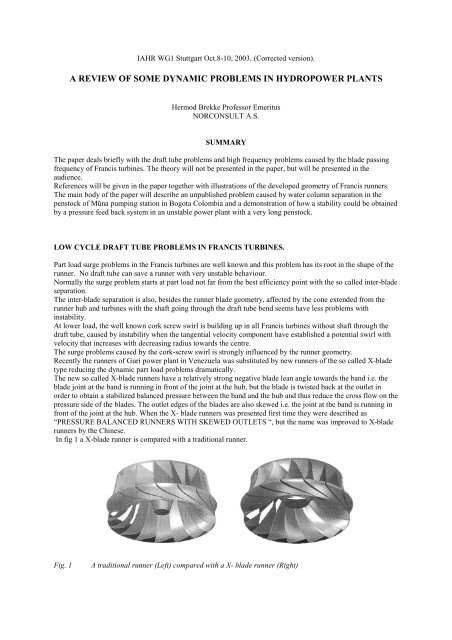
In fig 1 a X-blade runner is compared with a traditional runner.<br />
Fig. 1 A traditional runner (Left) compared with a X- blade runner (Right)
The ma<strong>in</strong> reason for the improved behaviour <strong>of</strong> the X-blade runners is the reduced cross flow which is almost<br />
zero at best efficiency, and thus it is also reduced at part load compared with a traditional runner.<br />
Also the skewed outlet edge has a stabiliz<strong>in</strong>g effect on the flow at part load.<br />
It can be proven theoretically, that the pressure gradient from hub to band is a function <strong>of</strong> the blade lean, i.e. the<br />
slope <strong>of</strong> the blade normal to the meridian velocity vector component, and <strong>in</strong> addition the geometry <strong>of</strong> the blade<br />
hub.<br />
dh/dm= f( geometry, Cm and ) where is the blade lean angle. (Ref.1.)<br />
In fig 2 is shown the recorded draft tube pressure surges at part load <strong>of</strong> a runner with skewed outlet edges<br />
compared with a runner with radial outlet edges.<br />
Fig. 2. Recorded draft tube surge at part load <strong>of</strong> a runner with skewed outlet edges (Left) compared with a<br />
runner with radial outlet edges (Right). The two turb<strong>in</strong>es are <strong>in</strong>stalled <strong>in</strong> the same power house with the same<br />
operat<strong>in</strong>g conditions, but are delivered from different manufacturers.<br />
Full load surges.<br />
At full load a vapour –air filled void is normally built up <strong>in</strong> the centre <strong>of</strong> the runner outlet rotat<strong>in</strong>g <strong>in</strong> opposite<br />
direction <strong>of</strong> the runner. Such void photo taken from a model test is showed <strong>in</strong> fig 3.<br />
At the power plant Kvilldal <strong>in</strong> Western Norway, power oscillations <strong>of</strong> 50-60 MW occurred at full load <strong>of</strong> two<br />
turb<strong>in</strong>es each at 315 MW.<br />
Fig 3 The natural frequency <strong>of</strong> penstock fr=1/Tr=1/(4Lp /a), draft tube frequency fdr=(gA H0/(L0 V0)) 0.5 /(2 ) ,<br />
and the generator rotor that was approximately 1.4 Hz and very close to fr and fdr .<br />
The reason for this problem was proven to be three natural frequencies very close to each other.
The first frequency was the resonance frequency <strong>of</strong> the penstock.<br />
The other was the natural frequency <strong>of</strong> the generator rotor <strong>in</strong> the magnetic field <strong>of</strong> the stator, depend<strong>in</strong>g on the<br />
load and sett<strong>in</strong>g <strong>of</strong> the voltage regulator and the external electric load situation.<br />
F<strong>in</strong>ally, the natural frequency <strong>of</strong> the draft tube mass oscillation cushioned by the air-vapour volume under the<br />
runner.<br />
In fig 3 the physical problem is illustrated.<br />
High frequency pressure pulsations<br />
The well known blade pass<strong>in</strong>g pressure pulsations will not be discussed <strong>in</strong> this paper.<br />
However, it should be noted that the majority <strong>of</strong> blade crack<strong>in</strong>g are caused by pressure pulsations caused by the<br />
impulses from the blades pass<strong>in</strong>g the wakes from the guide vanes.<br />
Examples are given <strong>in</strong> figure 4 and figure 5.<br />
Figure 4 illustrates pressure pulsations measured between the band and bottom cover <strong>of</strong> the high head turb<strong>in</strong>e at<br />
Hemsil I with number <strong>of</strong> guide vanes and runner blades (<strong>in</strong>clud<strong>in</strong>g splitter blades) were 28 and 30 respectively.<br />
The problem was solved by <strong>in</strong>stall<strong>in</strong>g a new runner with the same blade geometry as the exist<strong>in</strong>g runner, but<br />
with 32 blades <strong>in</strong>stead <strong>of</strong> 30 blades. The sound level dB A was reduced from 120 to 85. The problem was not<br />
blade crack<strong>in</strong>g but sound <strong>in</strong> this case.<br />
In fig 5 is shown measured stress amplitudes at the outlet <strong>of</strong> a high head Francis turb<strong>in</strong>e blade, 25 MPa.<br />
Fig 4 Sectional view <strong>of</strong> the turb<strong>in</strong>e at Hemsil I with recorded pressure pulsations between runner and lower<br />
cower. H=510 m, P= 48 500 HP, N=750 rpm.<br />
Fig 5 Stress amplitudes measured at the blade outlet edge <strong>of</strong> the runner for Tonstad power plant. P=160 MW.
PRESSURE SURGES AT MUNA PUMPING PLANT<br />
The Muna pump<strong>in</strong>g station is located near Bogota city <strong>in</strong> Colombia where three pumps have been <strong>in</strong>stalled.<br />
The ma<strong>in</strong> problem for this pump<strong>in</strong>g plant was an unacceptable reverse runaway speed if two or three pumps <strong>in</strong><br />
operation tripped simultaneously caused by defects <strong>in</strong> the electricity supply.<br />
In such case the water hammer pressure rise was not the problem, because the <strong>in</strong>creased pressure caus<strong>in</strong>g the<br />
high backwards runaway speed could only be expla<strong>in</strong>ed by water column separation and air <strong>in</strong>let through the air<br />
<strong>in</strong>let valve followed by an air compression caused by the return<strong>in</strong>g water column from the upper 280 long<br />
concrete pipe. The system is illustrated <strong>in</strong> figure 6.<br />
Fig 6. The lay out <strong>of</strong> Muna pump<strong>in</strong>g plant. Head from air <strong>in</strong>let valve (critical po<strong>in</strong>t) to tail race level =18 m, and<br />
from air <strong>in</strong>let valve to head race level = 9 m at m<strong>in</strong>imum level <strong>in</strong> the reservoir. Length <strong>of</strong> upper horizontal and<br />
slight <strong>in</strong>cl<strong>in</strong><strong>in</strong>g concrete pipe =280 m .(NB! Length <strong>of</strong> pipes mot <strong>in</strong> scale.)<br />
The technical data for the three pumps are: P= 7.07 MW, Q= 18.0 m 3 /s, H= 37.5 m, (For <strong>in</strong>creased head and<br />
max head loss), n= 223,7 rpm, Inertia mass for pump and motor: GD 2 = 169.2 tm 2 , <strong>in</strong>ertia time constant:<br />
Ta=3.28 sec. (It should be noted that the atmospheric pressure <strong>in</strong> Bogota is approximately 7.5 m WC (Altitude<br />
2557. m above sea level.)<br />
By regard<strong>in</strong>g the pump characteristic diagram enclosed at the end <strong>of</strong> this paper, we f<strong>in</strong>d that the flow will be zero<br />
if the speed is decreased to 88% <strong>of</strong> rated speed and the retard<strong>in</strong>g torque drops from 100% to 52% if the head is<br />
constant at 37.5 m, which is not the case dur<strong>in</strong>g tripp<strong>in</strong>g <strong>of</strong> the pumps.<br />
If the speed drops further the retard<strong>in</strong>g torque will <strong>in</strong>crease to 124% at zero speed and the flow will be reversed<br />
at -91% <strong>of</strong> rated flow at rated head.<br />
Because this problem had to be solved by means <strong>of</strong> a pocket calculator at night dur<strong>in</strong>g my stay <strong>in</strong> Ch<strong>in</strong>a a<br />
simplified solution had to be made by a rough calculation with advices to solve the problem.<br />
Follow<strong>in</strong>g rough calculations was made based on a study <strong>of</strong> the pump characteristic diagram and the conduit<br />
system:<br />
Time from rated speed to stop with assumed break<strong>in</strong>g torque -91%, Tstop 3.28/0.91= 3.5 sec. The reversed<br />
runaway speed <strong>of</strong> –143% <strong>of</strong> nom<strong>in</strong>al speed, will be reached with<strong>in</strong> 4.7 sec from zero speed at a constant head <strong>of</strong><br />
37.5 m .<br />
Because zero flow occurs at 88% speed with an average torque <strong>of</strong> 76% accord<strong>in</strong>g to the pump characteristic<br />
diagram, the time to zero flow will be Tstop 3.28(1-0.88)/0.76=0.52 sec.<br />
However, the low pressure will reach the critical po<strong>in</strong>t at the air <strong>in</strong>let valve approximately 1.0 sec later due to the<br />
water hammer reflection time i.e. 1.5 sec after the tripp<strong>in</strong>g <strong>of</strong> the pumps.(Lengths for control <strong>of</strong> these data is not<br />
<strong>in</strong>cluded.)<br />
Prevention <strong>of</strong> separation at the critical po<strong>in</strong>t will not be possible <strong>in</strong> this case because <strong>of</strong> the small ratio between<br />
the <strong>in</strong>ertia time constant <strong>of</strong> the pump unit and the <strong>in</strong>ertia time constant <strong>of</strong> the penstock: i.e. Ta/Tw 3.0.<br />
It should be noted that the time before the pumps reaches reversed runaway speed, will be <strong>in</strong>creased because the<br />
pressure will be reduced to 18 m WC after separation because the torque will be reduced to approximately 34%<br />
<strong>of</strong> the torque at rated head and with a reduction <strong>of</strong> the maximum reversed runaway speed by 70% i.e. –100%<br />
<strong>in</strong>stead <strong>of</strong> –143%.<br />
However, <strong>in</strong> this case the high reversed speed is not caused by water hammer, but by compression <strong>of</strong> the trapped<br />
air volume when the water upstream <strong>of</strong> the trapped air starts to accelerate downwards driven by gravitation.<br />
The highest pressure will be reached when the upstream water column stops after the compression <strong>of</strong> the air<br />
between the s<strong>in</strong>k<strong>in</strong>g water level up-streams <strong>of</strong> the pumps and the upper water column. This high pressure<br />
<strong>in</strong>creases the speed <strong>of</strong> the pumps that are rotat<strong>in</strong>g <strong>in</strong> reversed direction.
Because <strong>of</strong> the decreased torque <strong>of</strong> the pumps before the compression <strong>of</strong> the trapped air, the maximum reversed<br />
runaway speed would be reached after a time Trunaway (3.5+4.7)/0.34=24 sec.<br />
However, the pressure rise from the air compression occurs after approximately 20 sec for two pumps and the<br />
dangerous reversed runaway can be avoided by clos<strong>in</strong>g the butterfly valve <strong>in</strong> 10 sec or <strong>in</strong> 15 sec as a<br />
maximum time.<br />
Calculations:<br />
The pressure drop at the critical po<strong>in</strong>t where the air <strong>in</strong>let valve are located, will be:<br />
h=a C/g m where: C=-(Q/A)(2L/a)/Tsh<br />
Tsh 1.5/0.34= 4.4 sec = the time from the pumps loose the electricity supply until the flow is zero. (1.5 sec is<br />
stopp<strong>in</strong>g time + water hammer propagation time)<br />
The follow<strong>in</strong>g presented analysis <strong>of</strong> the compression <strong>of</strong> the trapped air is based upon an assumption that the<br />
outlet <strong>of</strong> the concrete pipe <strong>in</strong>to the reservoir is furnished with a threshold so no water will enter the pipe dur<strong>in</strong>g<br />
reversed flow. If that is not the case the situation will be worse.<br />
It is assumed that the velocity at the time <strong>of</strong> separation will be C0 (m/s), the cross section <strong>of</strong> the pipe to be<br />
constant =A (m 2 ), the length <strong>of</strong> the pipe upstream <strong>of</strong> the critical po<strong>in</strong>t to be L (m) and the length <strong>of</strong> the cavity<br />
filled with air =X (m) (The volume <strong>of</strong> air =XA (m 3 )) See fig 6.<br />
The follow<strong>in</strong>g equations may then be established when it is assumed that the concrete pipe is filled with water to<br />
the <strong>in</strong>let from the reservoir:<br />
Equilibrium <strong>of</strong> forces: F=m dC/dt<br />
The energy equation (Friction neglected): Fdx=m (dx/dt) dC<br />
In this case the mass m is not constant and x is the length <strong>of</strong> water volume leav<strong>in</strong>g the pipe at the pipe outlet at<br />
the reservoir Muna (See fig 6). The elasticity <strong>of</strong> the pipe is neglected <strong>in</strong> the follow<strong>in</strong>g calculation.<br />
When tak<strong>in</strong>g <strong>in</strong>to account that the force from gravity is negative and that the mass is reduced by Ax from the<br />
po<strong>in</strong>t <strong>of</strong> time when the flow separates at the critical po<strong>in</strong>t, the follow<strong>in</strong>g equation yields:<br />
gHA dx= A(L-x) c dc<br />
Rearrang<strong>in</strong>g and <strong>in</strong>tegrat<strong>in</strong>g to the maximum value <strong>of</strong> x=X where the water flow upstream <strong>of</strong> the separation<br />
po<strong>in</strong>t stops:<br />
X was then found by <strong>in</strong>tegration:<br />
− gH<br />
X<br />
0<br />
dx<br />
=<br />
( L − x)<br />
0<br />
C0<br />
cdc<br />
( C /( 2gH<br />
)<br />
( ) )<br />
2<br />
− 0<br />
X = L 1−<br />
e<br />
(1)<br />
When the maximum length <strong>of</strong> the air volume was found by equation 1 the air compression caused by the<br />
reversed flow upstream <strong>of</strong> the separation po<strong>in</strong>t was be studied <strong>in</strong> order to f<strong>in</strong>d the maximum pressure that gives a<br />
high runaway speed <strong>of</strong> the pumps <strong>in</strong> reversed direction<br />
.
Follow<strong>in</strong>g assumptions was made:<br />
1. The cavity is located <strong>in</strong> the horizontal part <strong>of</strong> the pipe.<br />
2. The upper horizontal part <strong>of</strong> the pipe is filled with water and will not be dra<strong>in</strong>ed <strong>of</strong> water. (See fig. 6)<br />
3. A threshold will prevent additional water to enter the pipe from the reservoir. (Without a threshold the<br />
situation will be worce.)<br />
4. The air <strong>in</strong>let valve closes immediately when the water column upstream stops and the <strong>in</strong>ner pressure is equal<br />
to outer pressure.<br />
5. Frictional damp<strong>in</strong>g is neglected.<br />
6. the value X found by equation 1 is used as a boundary condition <strong>in</strong>put value for the calculation <strong>of</strong> the<br />
compression.<br />
Dur<strong>in</strong>g reversed flow follow<strong>in</strong>g equation for the compression yields:<br />
C0 X0<br />
A(L-X) c dc= gA(P0-p) dx (2)<br />
0 x<br />
Here =density <strong>of</strong> water, A= cross section, P0= atmospheric pressure, p= absolute pressure dur<strong>in</strong>g compression<br />
And X= the maximum length <strong>of</strong> the air volume at the lowest pressure (ref eq.1),X0= the length <strong>of</strong> the air volume<br />
when the pressure <strong>of</strong> the compressed air is equal to the driv<strong>in</strong>g back pressure i.e. =P0-p and f<strong>in</strong>ally C0=maximum<br />
velocity dur<strong>in</strong>g the reversed flow period when air and head is equalized i.e. p=P0 and x=X0)<br />
Dur<strong>in</strong>g the acceleration period the k<strong>in</strong>etic energy that is accumulated <strong>in</strong> the reversed flow<strong>in</strong>g water column, will<br />
reach its maximum value as shown <strong>in</strong> equation 2 at a length=X0 and a volume =X0A at a pressure =P0 as<br />
illustrated <strong>in</strong> figure 7.<br />
From the length X0 a compression <strong>of</strong> the air with closed air <strong>in</strong>let valve, will decelerate the flow and at volume<br />
AX2 and pressure P2 the velocity <strong>of</strong> the water column will be zero.<br />
The compression is assumed to be adiabatic with a compression exponent =1.4 giv<strong>in</strong>g a maximum pressure <strong>of</strong><br />
40.08 m WC. However, a calculation with a polytropic exponent <strong>of</strong> 1.3 was also tested, giv<strong>in</strong>g a higher<br />
maximum pressure <strong>of</strong> 41.3 m WC.<br />
The equation <strong>of</strong> adiabatic compression yields:<br />
P(xA) = P(XA = P0(X0A)<br />
Or p=(X/x) P (3)<br />
When substitut<strong>in</strong>g for p <strong>in</strong> the left hand side <strong>in</strong> equation 2 follow<strong>in</strong>g equations can be established:<br />
X0 X2<br />
(P0-PX /x )dx= (PX /x – P0)dx (4)<br />
X X 0<br />
After <strong>in</strong>tegration and rearrangement follow<strong>in</strong>g equation can be established <strong>in</strong> order to f<strong>in</strong>d X2=f(X,P) and then<br />
the maximum pressure could be found by a simple iteration on a pocket calculator.<br />
The f<strong>in</strong>al equation yield:<br />
X2 - ((1+P/(P0( -1)))X)X2 ( -1) + PX /( -1) = 0 (5)<br />
And P2 = P(X/X2) (6)<br />
The result <strong>of</strong> the calculations is illustrated <strong>in</strong> figure 7.
The maximum pressure reached 40.08 m WC caused by compression <strong>of</strong> the air and this was the ma<strong>in</strong> reason for<br />
the non-acceptable reversed runaway speed. It should be noted that by us<strong>in</strong>g a polytropic exponent <strong>of</strong> 1.3 <strong>in</strong>stead<br />
<strong>of</strong> the adiabatic exponent 1.4, the maximum pressure <strong>in</strong>creased to 41.28 m WC. It was also surpris<strong>in</strong>g that the<br />
maximum pressure with tripp<strong>in</strong>g <strong>of</strong> 3 pumps was equal to the tripp<strong>in</strong>g <strong>of</strong> 2 pumps.<br />
Physically this can be expla<strong>in</strong>ed by longer distance with air filled pipe and less water <strong>in</strong> reversed flow because it<br />
was assumed that no water from the reservoir entered the pipe dur<strong>in</strong>g the reversed flow period.<br />
RESULT OF CALCULATIONS.<br />
2 pumps tripp<strong>in</strong>g: Flow 36=m 3 /s 2 pumps tripp<strong>in</strong>g Flow=36m 3 /s 3 pumps tripp<strong>in</strong>g: Flow=53 m 3 /s<br />
= 1.4 =1.3 =1.4<br />
X2=6.449 X2=5.526 X2=13.823<br />
X0=12.156 X0=11.189 X0=26.055<br />
X=21.348 X=20.52 X=45.760<br />
P2=40.08 m WC P2=41.28 m WC P2=40.08 m WC<br />
H2=40.08-7.5=32.58 m H2=41.28-7.5=33.78 m H2=40.08-7.5=32.5<br />
Fig 7 Illustration <strong>of</strong> the compression history caused by reversed flow after water column separation.<br />
IMPROVING GOVERNING STABILITY BY PRESSURE FEED BACK SYSTEMS.<br />
In figure 8 is shown the general block diagram for a pressure feed back system where the algorithm <strong>in</strong>dicates<br />
the algorithm that transforms the pressure signal <strong>in</strong> the feed back loop to the governor.<br />
Fig. 8 Block diagram for the govern<strong>in</strong>g system <strong>of</strong> a <strong>hydropower</strong> plant equipped with a Francis turb<strong>in</strong>e. For a<br />
plant with a Pelton turb<strong>in</strong>e the value <strong>of</strong> Qn = 0.
It is well known that the <strong>in</strong>ertia mass and elasticity <strong>of</strong> the penstock are the ma<strong>in</strong> reason for the stability <strong>problems</strong><br />
<strong>of</strong> <strong>hydropower</strong> <strong>plants</strong>.<br />
The first known <strong>in</strong>troduction <strong>of</strong> a pressure feed back system was made by Dr. Le<strong>in</strong> (Ref 2).<br />
Le<strong>in</strong> <strong>in</strong>troduced a so called DT1 that is a derivative element with one time constant, element <strong>in</strong> the compensator<br />
element shown <strong>in</strong> figure 8.<br />
The author <strong>of</strong> this paper worked on the power plant SKJAAK <strong>in</strong> Norway that had a very difficult stability<br />
problem and an improvement <strong>of</strong> compensator element was needed.<br />
The element <strong>in</strong>troduced by Dr. Le<strong>in</strong> yields:<br />
The function <strong>of</strong> the new element yields:<br />
= kTds/(1+THs) (7)<br />
=kT1s/((1+T1s)(1+Tds)(1+0.5s)) (8)<br />
However, it is <strong>of</strong> <strong>in</strong>terest to study and simplify the block diagram <strong>in</strong> figure 8 by study<strong>in</strong>g a Pelton turb<strong>in</strong>e where<br />
the <strong>in</strong>fluence from the speed on the flow disappears i.e. Qn=0.<br />
Note that <strong>in</strong> the block diagram <strong>in</strong> fig.8, =2hw tanh(Ls/a), where s=j<br />
n<br />
n<br />
ref<br />
( 1+<br />
Tds)(<br />
1−<br />
Φ)<br />
= (9)<br />
btT s(<br />
1+<br />
0.<br />
5Φ(<br />
1−<br />
2((<br />
1+<br />
T s)<br />
/( T s)))<br />
Θ)<br />
) T s<br />
d<br />
Introduc<strong>in</strong>g: b = 0.5(1-2((1+Tds)/Tds) ) (10)<br />
Then we obta<strong>in</strong>: n/nref = ((1+Tds)/btTdsTas) (1- )/(1+b ) (11)<br />
Here the function (1- )/(1+b )=P/y i.e. the transfer function <strong>of</strong> turb<strong>in</strong>e power as function <strong>of</strong> needle<br />
open<strong>in</strong>g.<br />
We can now re write the transfer function P/y(s) as follows:<br />
P ( 1−<br />
Φ)<br />
( b −1)<br />
( 1+<br />
bΦ)<br />
( b + 1)<br />
( 1−<br />
bΦ)<br />
( b −1)<br />
( b + 1)<br />
( 1−<br />
bΦ)<br />
= =<br />
+<br />
= +<br />
(12)<br />
y ( 1+<br />
bΦ)<br />
2b<br />
( 1+<br />
bΦ)<br />
2b<br />
( 1+<br />
bΦ)<br />
2b<br />
2b<br />
( 1+<br />
bΦ)<br />
We f<strong>in</strong>d now that the power response forms a circle <strong>in</strong> the complex plane plot with the centre <strong>in</strong> (b-1)/(2b) on<br />
the real axis.<br />
As a demonstration <strong>of</strong> the pressure feedback system let us use the DT1 element proposed by Dr Le<strong>in</strong> and let<br />
TH=Td <strong>in</strong> equation 7. Then let us look at the result by mak<strong>in</strong>g variation <strong>of</strong> the constant k as illustrated <strong>in</strong><br />
figure 9.<br />
As expected we f<strong>in</strong>d that for k=0, i.e. no pressure compensat<strong>in</strong>g system, we get a circle through +1.0 and –2.0 on<br />
the real axis and the circle has a radius =1.5.<br />
When we decreases the value <strong>of</strong> k, the radius <strong>of</strong> the circle decreases, but the circlr will always go through the<br />
po<strong>in</strong>t 1.0, 0.0. It is also <strong>in</strong>terest<strong>in</strong>g to see that for negative values <strong>of</strong> k the radius <strong>in</strong>creases and the system will be<br />
more unstable than without a pressure feed back system as expected because we now get a positive feed back<br />
signal.<br />
d<br />
d<br />
a
Fig 9. The transfer function <strong>of</strong> P/y(s) with the DT1 element (equation 7) where TH=Td for k=3,1, 0 and-0.5.<br />
In figure 10 is illustrated the Nyquist diagram for the stability on isolated load with variations <strong>of</strong> the constant k<br />
<strong>of</strong> a DT1 element with Td=TH. We f<strong>in</strong>d here that a decreased circle as shown <strong>in</strong> fig 9 may decrease the stability.<br />
However, an improved sett<strong>in</strong>g might have been obta<strong>in</strong>ed by adjust<strong>in</strong>g Td TH , but our work was aimed at a<br />
more complex function <strong>of</strong> the pressure feed back function.<br />
Fig.10 Nyquist diagram <strong>of</strong> the transfer function n/nref with a DT1 element (equation 7)<strong>in</strong> the pressure feed back<br />
system with variation <strong>of</strong> k=0.01,0.5 and 1.0.<br />
F<strong>in</strong>ally the more complex pressure feed back function was analysed. The function is shown <strong>in</strong> equation 8.<br />
By f<strong>in</strong>e-tun<strong>in</strong>g the time constants T1 and lett<strong>in</strong>g Td be equal to the <strong>in</strong>tegral time constant <strong>in</strong> the turb<strong>in</strong>e governor<br />
we f<strong>in</strong>d that the stability marg<strong>in</strong> is very good. (See distance to the po<strong>in</strong>t (–1,0) on the real axis.<br />
The result <strong>of</strong> the computation is illustrated <strong>in</strong> figure 11 show<strong>in</strong>g the <strong>in</strong>fluence <strong>of</strong> variation <strong>of</strong> the constant k.
Fig 11. Nyquist diagram <strong>of</strong> n/nref with the authors approach with different values <strong>of</strong> the amplification<br />
k =0.5,1.0 and 2.0.<br />
ACKNOWLEDGEMENTS.<br />
The author wants to thank his colleagues at Kvaerner Energy and at NTNU for collaboration dur<strong>in</strong>g the work<br />
presented <strong>in</strong> this paper.<br />
A special thank to Dr <strong>in</strong>g Li X<strong>in</strong> X<strong>in</strong> for his collaboration with regulat<strong>in</strong>g stability programm<strong>in</strong>g.<br />
REFERENCES<br />
1. Brekke H:“Hydraaulic design strategy <strong>of</strong> Francis turb<strong>in</strong>es”. Hydropower 1996. Lausanne July 1996.<br />
2. Le<strong>in</strong> G. and Maurer W.: “Advances <strong>in</strong> control <strong>of</strong> <strong>hydropower</strong> <strong>plants</strong>” Report University <strong>of</strong> Stuttgart.