PDF version - Children's Hospital Boston
PDF version - Children's Hospital Boston
PDF version - Children's Hospital Boston

You also want an ePaper? Increase the reach of your titles
YUMPU automatically turns print PDFs into web optimized ePapers that Google loves.
© 2008 Nature Publishing Group http://www.nature.com/naturebiotechnology<br />
ARTICLES<br />
a<br />
b<br />
Percent intensity<br />
(1)<br />
CH 3 O<br />
(2)<br />
CH 3 O<br />
30<br />
20<br />
10<br />
0<br />
0.01<br />
CH 3 O<br />
O<br />
m<br />
O<br />
m<br />
O<br />
2 HN<br />
R (nm)<br />
O<br />
O<br />
O<br />
n<br />
O<br />
TNP-470<br />
DMF<br />
O<br />
O<br />
O<br />
m n<br />
O<br />
n<br />
O<br />
NH 2<br />
O<br />
O<br />
0.10<br />
1.00<br />
10.00<br />
100.00<br />
1.0E+3<br />
1.0E+4<br />
NH<br />
NH<br />
O<br />
TNP-470<br />
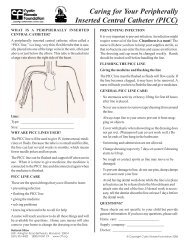
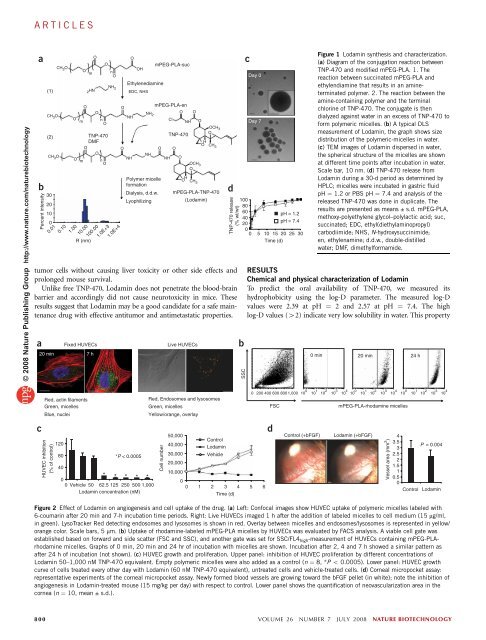
tumor cells without causing liver toxicity or other side effects and<br />
prolonged mouse survival.<br />
Unlike free TNP-470, Lodamin does not penetrate the blood-brain<br />
barrier and accordingly did not cause neurotoxicity in mice. These<br />
results suggest that Lodamin may be a good candidate for a safe maintenance<br />
drug with effective antitumor and antimetastatic properties.<br />
a<br />
120<br />
Fixed HUVECs<br />
20 min 7 h<br />
Red, actin filaments<br />
Green, micelles<br />
Blue, nuclei<br />
OH<br />
Ethylenediamine<br />
EDC, NHS<br />
NH<br />
Polymer micelle<br />
formation<br />
Dialysis, d.d.w.<br />
Lyophilizing<br />
mPEG-PLA-suc<br />
NH2 mPEG-PLA-en<br />
O O<br />
Cl<br />
NH O<br />
O O<br />
NH O<br />
OCH3 O<br />
OCH3 O<br />
O H<br />
CH3 O<br />
mPEG-PLA-TNP-470<br />
(Lodamin)<br />
H<br />
CH3 Live HUVECs<br />
Red, Endosomes and lysosomes<br />
Green, micelles<br />
Yellow/orange, overlay<br />
d<br />
100<br />
TNP-470 release<br />
(% wt/wt)<br />
c<br />
Day 0<br />
Day 7<br />
80<br />
60<br />
40<br />
20<br />
0<br />
0 5<br />
c d<br />
HUVEC inhibition<br />
(% of control)<br />
80<br />
40<br />
*P < 0.0005<br />
0<br />
* * * * *<br />
0 Vehicle 50 62.5 125 250 500 1,000<br />
Lodamin concentration (nM)<br />
Cell number<br />
b<br />
SSC<br />
pH = 1.2<br />
pH = 7.4<br />
10 15 20 25 30<br />
Time (d)<br />
RESULTS<br />
Chemical and physical characterization of Lodamin<br />
To predict the oral availability of TNP-470, we measured its<br />
hydrophobicity using the log-D parameter. The measured log-D<br />
values were 2.39 at pH ¼ 2 and 2.57 at pH ¼ 7.4. The high<br />
log-D values (42) indicate very low solubility in water. This property<br />
FSC<br />
0 min 20 min 24 h<br />
0 200 400 600 800 1,000 10 0 10 1 10 2 10 3 10 4<br />
10 0 10 1 10 2 10 3 10 4 10 0 10 1 10 2 10 3 10 4<br />
mPEG-PLA-rhodamine micelles<br />
50,000<br />
40,000<br />
Control<br />
Lodamin<br />
Control (+bFGF) Lodamin (+bFGF)<br />
30,000<br />
20,000<br />
10,000<br />
0<br />
Vehicle<br />
0 1 2 3<br />
Time (d)<br />
4 5 6<br />
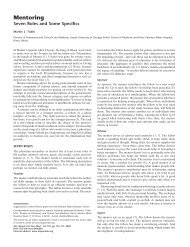
Figure 1 Lodamin synthesis and characterization.<br />
(a) Diagram of the conjugation reaction between<br />
TNP-470 and modified mPEG-PLA. 1. The<br />
reaction between succinated mPEG-PLA and<br />
ethylendiamine that results in an amineterminated<br />
polymer. 2. The reaction between the<br />
amine-containing polymer and the terminal<br />
chlorine of TNP-470. The conjugate is then<br />
dialyzed against water in an excess of TNP-470 to<br />
form polymeric micelles. (b) A typical DLS<br />
measurement of Lodamin, the graph shows size<br />
distribution of the polymeric-micelles in water.<br />
(c) TEM images of Lodamin dispersed in water,<br />
the spherical structure of the micelles are shown<br />
at different time points after incubation in water.<br />
Scale bar, 10 nm. (d) TNP-470 release from<br />
Lodamin during a 30-d period as determined by<br />
HPLC; micelles were incubated in gastric fluid<br />
pH ¼ 1.2 or PBS pH ¼ 7.4 and analysis of the<br />
released TNP-470 was done in duplicate. The<br />
results are presented as means ± s.d. mPEG-PLA,<br />
methoxy-polyethylene glycol–polylactic acid; suc,<br />
succinated; EDC, ethyl(diethylaminopropyl)<br />
carbodiimide; NHS, N-hydroxysuccinimide;<br />
en, ethylenamine; d.d.w., double-distilled<br />
water; DMF, dimethylformamide.<br />
Vessel area (mm 2 )<br />
4<br />
3.5<br />
P = 0.004<br />
3<br />
2.5<br />
2<br />
1.5<br />
1<br />
0.5<br />
0<br />
Control Lodamin<br />
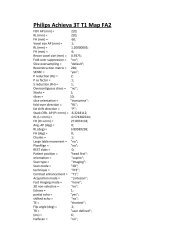
Figure 2 Effect of Lodamin on angiogenesis and cell uptake of the drug. (a) Left: Confocal images show HUVEC uptake of polymeric micelles labeled with<br />
6-coumarin after 20 min and 7-h incubation time periods. Right: Live HUVECs imaged 1 h after the addition of labeled micelles to cell medium (15 mg/ml,<br />
in green). LysoTracker Red detecting endosomes and lysosomes is shown in red. Overlay between micelles and endosomes/lysosomes is represented in yellow/<br />
orange color. Scale bars, 5 mm. (b) Uptake of rhodamine-labeled mPEG-PLA micelles by HUVECs was evaluated by FACS analysis. A viable cell gate was<br />
established based on forward and side scatter (FSC and SSC), and another gate was set for SSC/FL4 high-measurement of HUVECs containing mPEG-PLArhodamine<br />
micelles. Graphs of 0 min, 20 min and 24 hr of incubation with micelles are shown. Incubation after 2, 4 and 7 h showed a similar pattern as<br />
after 24 h of incubation (not shown). (c) HUVEC growth and proliferation. Upper panel: inhibition of HUVEC proliferation by different concentrations of<br />
Lodamin 50–1,000 nM TNP-470 equivalent. Empty polymeric micelles were also added as a control (n ¼ 8, *P o 0.0005). Lower panel: HUVEC growth<br />
curve of cells treated every other day with Lodamin (60 nM TNP-470 equivalent), untreated cells and vehicle-treated cells. (d) Corneal micropocket assay:<br />
representative experiments of the corneal micropocket assay. Newly formed blood vessels are growing toward the bFGF pellet (in white); note the inhibition of<br />
angiogenesis in Lodamin-treated mouse (15 mg/kg per day) with respect to control. Lower panel shows the quantification of neovascularization area in the<br />
cornea (n ¼ 10, mean ± s.d.).<br />
800 VOLUME 26 NUMBER 7 JULY 2008 NATURE BIOTECHNOLOGY