DEPARTMENT OF FISHERIES ANNUAL REPORT TO THE ...
DEPARTMENT OF FISHERIES ANNUAL REPORT TO THE ...
DEPARTMENT OF FISHERIES ANNUAL REPORT TO THE ...

Create successful ePaper yourself
Turn your PDF publications into a flip-book with our unique Google optimized e-Paper software.
SUMMARy <strong>OF</strong> <strong>THE</strong> yEAR � FINANCIAL OvERvIEw<br />
financial Position<br />
The Statement of Financial Position shows what the<br />
Department owns (assets) as well as owes (liabilities).<br />
This is useful in assessing and analysing how good the<br />
Department is at managing its resources.<br />
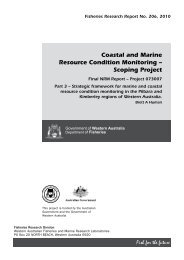
Financial position – five-year trend<br />
Figure 14 shows the value of the assets and liabilities,<br />
and net assets of the Department over the last five<br />
financial years.<br />
The net assets of the Department is the difference<br />
between total assets and total liabilities and represents<br />
the residual interest in the assets after deducting the<br />
probable call on these resources, represented by liabilities.<br />
Under the Fisheries Adjustment Schemes Act 1987<br />
the Department has the capacity to reduce effort in a<br />
fishery by acquiring commercial fishing authorisations.<br />
The Act allows the Department to borrow money from<br />
the Treasurer to purchase the authorisations. The<br />
fishers remaining in the relevant fisheries are required<br />
to pay additional fees to recover the outlays incurred<br />
by the Department. Under these schemes, outstanding<br />
amounts owing from fishers as at 30 June of the<br />
financial year are recognised as ‘Amounts Receivable’.<br />
In the 2010/11 year significant acquisitions<br />
occurred in the Shark Bay prawn, Shark Bay scallop and<br />
Abrolhos Island trawl fisheries. The borrowings relating<br />
to these schemes and the recognition of associated<br />
amounts receivable has impacted both assets and<br />
liabilities at 30 June 2011.<br />
Figure 14. Financial position – five-year trend<br />
$ '000<br />
120,000<br />
100,000<br />
80,000<br />
60,000<br />
40,000<br />
20,000<br />
0<br />
45,431<br />
Assets<br />
Liabilities<br />
NET ASSETS<br />
63,887<br />
2006/07 2007/08 2008/09 2009/10 2010/11<br />
YEAR<br />
59,915<br />
61,764<br />
61,185<br />
33